Morphological characteristics of motor neurons do not determine their relative susceptibility to degeneration in a mouse model of severe spinal muscular atrophy - PubMed (original) (raw)
Morphological characteristics of motor neurons do not determine their relative susceptibility to degeneration in a mouse model of severe spinal muscular atrophy
Sophie R Thomson et al. PLoS One. 2012.
Abstract
Spinal muscular atrophy (SMA) is a leading genetic cause of infant mortality, resulting primarily from the degeneration and loss of lower motor neurons. Studies using mouse models of SMA have revealed widespread heterogeneity in the susceptibility of individual motor neurons to neurodegeneration, but the underlying reasons remain unclear. Data from related motor neuron diseases, such as amyotrophic lateral sclerosis (ALS), suggest that morphological properties of motor neurons may regulate susceptibility: in ALS larger motor units innervating fast-twitch muscles degenerate first. We therefore set out to determine whether intrinsic morphological characteristics of motor neurons influenced their relative vulnerability to SMA. Motor neuron vulnerability was mapped across 10 muscle groups in SMA mice. Neither the position of the muscle in the body, nor the fibre type of the muscle innervated, influenced susceptibility. Morphological properties of vulnerable and disease-resistant motor neurons were then determined from single motor units reconstructed in Thy.1-YFP-H mice. None of the parameters we investigated in healthy young adult mice - including motor unit size, motor unit arbor length, branching patterns, motor endplate size, developmental pruning and numbers of terminal Schwann cells at neuromuscular junctions - correlated with vulnerability. We conclude that morphological characteristics of motor neurons are not a major determinant of disease-susceptibility in SMA, in stark contrast to related forms of motor neuron disease such as ALS. This suggests that subtle molecular differences between motor neurons, or extrinsic factors arising from other cell types, are more likely to determine relative susceptibility in SMA.
Conflict of interest statement
Competing Interests: The authors have declared that no competing interests exist. The authors can confirm that author THG is currently an academic editor at PLOS ONE. This does not alter the authors’ adherence to all the PLOS ONE policies on sharing data and materials.
Figures
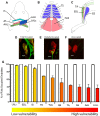
Figure 1. Differential susceptibility to degeneration between motor neurons innervating anatomically distinct muscles in a mouse model of severe SMA.
A – Schematic illustration of the anatomical locations of the LALr, LALc, AAL, AS, and IS muscles in the mouse, collectively known as the cranial muscles (Figure adapted from Murray et al., 2010). B – Schematic illustration of the anatomical locations of the TVA and TS muscles in the abdominal and thoracic walls of the mouse. C – Schematic illustration of the anatomical locations of the TA, EDL and GS muscles in the hind limb of the mouse. D−F – Representative confocal micrographs showing differing levels of synaptic pathology at neuromuscular junctions in P5 Smn−/−;SMN2 mice (green = neurofilament and SV2; red = bungarotoxin-labelled acetylcholine receptors). D shows an example of a healthy, fully occupied motor endplate. E shows an example of a partially occupied motor endplate, where the motor nerve terminal (green) has retracted from the majority of the motor endplate. F shows an example of a vacant motor endplate where the nerve terminal has completely retracted from the motor endplate. Scale bars = 5 µm. G – Bar chart (mean±SEM) showing the percentage of fully occupied endplates in healthy littermate controls (white bars; N = 3 mice) and Smn−/−;SMN2 mice (coloured bars; N = 3 mice). Mean values were used to rank the muscles from low vulnerability (yellow) to high vulnerability (red). This colour coding system has been applied to subsequent figures in order to distinguish muscles with vulnerable and disease-resistant motor neurons.
Figure 2. Reconstruction of entire single motor units from Thy.1-YFP-H mice.
A – Representative example of a low magnification confocal montage showing YFP-expressing motor neurons innervating the LALr muscle from a Thy.1-YFP-H mouse. Whole mount muscles were dissected and incubated with TRITC-conjugated α-bungarotoxin to label motor endplates (red). B – An example trace of one motor unit from the LALr shown in panel A. A total of 105 entire motor unit reconstructions were produced for subsequent analyses of motor unit morphology.
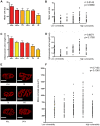
Figure 3. No apparent correlation between morphological properties of motor neurons and their susceptibility to SMA.
A/B – Bar chart (Mean±SEM; A) and scatter plot (B) of motor unit sizes in a range of vulnerable (red bars in A) and disease-resistant (yellow bars in A) muscles, determined by obtaining the total number of synapses formed by a single motor neuron. No significant correlation was found between motor unit size and the relative susceptibility of a motor neuron (P>0.05, Spearman correlation analysis; N≥3 mice per muscle). C/D – Bar chart (C) and scatter plot (D) of total intramuscular arbor lengths from motor neurons innervating a range of vulnerable and disease-resistant muscles. No significant correlation was found between total intramuscular arbor length and the relative susceptibility of a motor neuron (P>0.05, Spearman correlation analysis; N≥3 mice per muscle). E – Example fluorescence micrographs of motor endplates from each muscle group investigated. Scale bars = 30 µm. F – Scatter plot of endplate areas (µm2) in a range of vulnerable and disease-resistant muscles. No significant correlation was found between the size of neuromuscular synapses and the relative susceptibility of innervating motor neurons (P>0.05, Spearman correlation analysis; N≥3 mice per muscle).
Figure 4. Motor unit branching patterns do not influence susceptibility to degeneration in SMA.
A/B – Bar chart (mean±SEM; A) and scatter plot (B) showing the number of branch points in motor units from a range of vulnerable (red bars in A) and disease-resistant (yellow bars in A) muscles. No significant correlation was found between the number of branch points and the relative susceptibility of a motor neuron (P>0.05, Spearman correlation analysis; N≥3 mice per muscle).
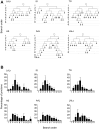
Figure 5. Further analysis of motor unit branching patterns revealed no influence on the susceptibility to degeneration in SMA
. A – Representative examples of individual branching diagrams from single motor units innervating the range of vulnerable and disease-resistant muscles analysed. Note the similarities in overall branching patterns in all examples shown. B – Bar charts (mean±SEM) showing the percentage of branch points per branching order in motor units innervating the range of vulnerable and disease-resistant muscles analysed. Once again, note the similarity in distribution of branch orders in all examples shown.
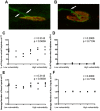
Figure 6. The relative susceptibility of a motor neuron to SMA is not determined by differences in intrinsic remodelling capabilities.
A/B – Representative confocal micrographs showing immunohistochemically labelled neuromuscular junctions from a littermate control SMA mouse (Smn+/−;SMN2) at P7 (A) and P14 (B). White arrows in A show two axonal inputs (green) converging onto a single motor endplate (red), illustrating a polyneuronally innervated neuromuscular junction (the ‘immature’ state). The white arrow in B shows how a single axonal input is innervating the motor endplate, illustrating a mononeuronally innervated neuromuscular junction (the ‘mature’ state). C/D – Scatter plots showing the incidence of polyneuronally innervated endplates at P7 (C) and P14 (D) across a range of vulnerable and disease-resistant muscles in healthy littermate controls. There was no significant correlation between the percentage of polyinnervation (as a marker of the rate of synaptic remodelling during synapse elimination) and the relative susceptibility of the motor neuron at either P7 or P14 (P>0.05, Spearman correlation analysis; N = 3 mice per age group). E/F – Scatter plots showing the average number of axon inputs to motor endplates at P7 (E) and P14 (F) across a range of vulnerable and disease-resistant muscles in healthy littermate controls. As for the assessment based on percentages of polyinnervation, there was no significant correlation between the average number of axon inputs (as a marker of the rate of synaptic remodelling during synapse elimination) and the relative susceptibility of the motor neuron at either P7 or P14 (P>0.05, Spearman correlation analysis; N = 3 mice per age group). Note that, as expected, statistical analyses on C and D gave identical results to those on E and F as data were generated from the same experimental material.
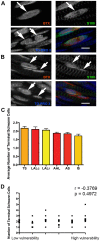
Figure 7. The number of terminal Schwann cells at the neuromuscular junction does not influence the relative susceptibility of motor neurons in SMA.
A/B – Example confocal micrographs showing immunohistochemically labelled terminal Schwann cells (S100; green) at neuromuscular junctions in the LALr (A) and AAL (B) muscles. Nuclei were labelled with TOPRO-3 (blue) and motor endplates were labelled with bungarotoxin (red). The bottom left panel of A and B shows a merge of all three individual channels. Images were acquired on a confocal microscope using sequential capture to ensure no bleed-through from one channel to the next. The arrows in A show a single motor endplate (in the BTX channel), with clear terminal Schwann cell cytoplasm above it (in the S100 channel), but with two nuclei present within the S100 footprint (TO-PRO3 channel). This NMJ was therefore assessed to have 2 associated terminal Schwann cells. The arrows in B show two distinct motor endplates (in the BTX channel), each with clear terminal Schwann cell cytoplasm above it (in the S100 channel), but with only one nucleus present within the S100 footprint (TO-PRO3 channel) at each NMJ. These NMJs were therefore assessed to have 1 associated terminal Schwann cell each. Scale bars = 5 µm. C – Bar chart (mean±SEM) showing the mean number of terminal Schwann cells (tSCs) per NMJ in a range of muscles from P5 healthy littermate control mice (N = 3 mice). D – Scatter plot showing the number of tSCs per NMJ in each muscle examined, plotted against the relative vulnerability of motor neurons innervating that muscle. Statistical analysis showed that there was no significant correlation between the number of tSCs per NMJ and the susceptibility of the motor neuron in SMA (P>0.05, Spearman correlation analysis).
Similar articles
- Mouse models of SMA show divergent patterns of neuronal vulnerability and resilience.
Woschitz V, Mei I, Hedlund E, Murray LM. Woschitz V, et al. Skelet Muscle. 2022 Sep 12;12(1):22. doi: 10.1186/s13395-022-00305-9. Skelet Muscle. 2022. PMID: 36089582 Free PMC article. - Pre-symptomatic development of lower motor neuron connectivity in a mouse model of severe spinal muscular atrophy.
Murray LM, Lee S, Bäumer D, Parson SH, Talbot K, Gillingwater TH. Murray LM, et al. Hum Mol Genet. 2010 Feb 1;19(3):420-33. doi: 10.1093/hmg/ddp506. Epub 2009 Nov 2. Hum Mol Genet. 2010. PMID: 19884170 - Non-aggregating tau phosphorylation by cyclin-dependent kinase 5 contributes to motor neuron degeneration in spinal muscular atrophy.
Miller N, Feng Z, Edens BM, Yang B, Shi H, Sze CC, Hong BT, Su SC, Cantu JA, Topczewski J, Crawford TO, Ko CP, Sumner CJ, Ma L, Ma YC. Miller N, et al. J Neurosci. 2015 Apr 15;35(15):6038-50. doi: 10.1523/JNEUROSCI.3716-14.2015. J Neurosci. 2015. PMID: 25878277 Free PMC article. - Beyond Motor Neurons in Spinal Muscular Atrophy: A Focus on Neuromuscular Junction.
Torri F, Mancuso M, Siciliano G, Ricci G. Torri F, et al. Int J Mol Sci. 2024 Jul 3;25(13):7311. doi: 10.3390/ijms25137311. Int J Mol Sci. 2024. PMID: 39000416 Free PMC article. Review. - Spinal Muscular Atrophy: More than a Disease of Motor Neurons?
Nash LA, Burns JK, Chardon JW, Kothary R, Parks RJ. Nash LA, et al. Curr Mol Med. 2016;16(9):779-792. doi: 10.2174/1566524016666161128113338. Curr Mol Med. 2016. PMID: 27894243 Review.
Cited by
- Mouse models of SMA show divergent patterns of neuronal vulnerability and resilience.
Woschitz V, Mei I, Hedlund E, Murray LM. Woschitz V, et al. Skelet Muscle. 2022 Sep 12;12(1):22. doi: 10.1186/s13395-022-00305-9. Skelet Muscle. 2022. PMID: 36089582 Free PMC article. - Motor unit recovery following Smn restoration in mouse models of spinal muscular atrophy.
Comley LH, Kline RA, Thomson AK, Woschitz V, Landeros EV, Osman EY, Lorson CL, Murray LM. Comley LH, et al. Hum Mol Genet. 2022 Sep 10;31(18):3107-3119. doi: 10.1093/hmg/ddac097. Hum Mol Genet. 2022. PMID: 35551393 Free PMC article. - Spatial Distribution of Motor Endplates and its Adaptive Change in Skeletal Muscle.
Yin X, Yu T, Chen B, Xu J, Chen W, Qi Y, Zhang P, Li Y, Kou Y, Ma Y, Han N, Wan P, Luo Q, Zhu D, Jiang B. Yin X, et al. Theranostics. 2019 Jan 24;9(3):734-746. doi: 10.7150/thno.28729. eCollection 2019. Theranostics. 2019. PMID: 30809305 Free PMC article. - PTEN depletion decreases disease severity and modestly prolongs survival in a mouse model of spinal muscular atrophy.
Little D, Valori CF, Mutsaers CA, Bennett EJ, Wyles M, Sharrack B, Shaw PJ, Gillingwater TH, Azzouz M, Ning K. Little D, et al. Mol Ther. 2015 Feb;23(2):270-7. doi: 10.1038/mt.2014.209. Epub 2014 Nov 5. Mol Ther. 2015. PMID: 25369768 Free PMC article. - Reduced P53 levels ameliorate neuromuscular junction loss without affecting motor neuron pathology in a mouse model of spinal muscular atrophy.
Courtney NL, Mole AJ, Thomson AK, Murray LM. Courtney NL, et al. Cell Death Dis. 2019 Jul 4;10(7):515. doi: 10.1038/s41419-019-1727-6. Cell Death Dis. 2019. PMID: 31273192 Free PMC article.
References
- Lunn MR, Wang CH (2008) Spinal muscular atrophy. Lancet 371: 2120–2133. - PubMed
- Talbot K, Davies KE (2001) Spinal muscular atrophy. Semin Neurol 21: 189–197. - PubMed
- Lefebvre S, Bürglen L, Reboullet S, Clermont O, Burlet P, et al. (1995) Identification and characterization of a spinal muscular atrophy-determining gene. Cell 13: 155–165. - PubMed
Publication types
MeSH terms
LinkOut - more resources
Full Text Sources
Medical
Molecular Biology Databases
Miscellaneous
