Ecological analysis of antigen-specific CTL repertoires defines the relationship between naive and immune T-cell populations - PubMed (original) (raw)
Ecological analysis of antigen-specific CTL repertoires defines the relationship between naive and immune T-cell populations
Paul G Thomas et al. Proc Natl Acad Sci U S A. 2013.
Abstract
Ecology is typically thought of as the study of interactions organisms have with each other and their environment and is focused on the distribution and abundance of organisms both within and between environments. On a molecular level, the capacity to probe analogous questions in the field of T-cell immunology is imperative as we acquire substantial datasets both on epitope-specific T-cell populations through high-resolution analyses of T-cell receptor (TCR) use and on global T-cell populations analyzed via high-throughput DNA sequencing. Here, we present the innovative application of existing statistical measures (used typically in the field of ecology), together with unique statistical analyses, to comprehensively assess how the naïve epitope-specific CD8(+) cytotoxic T lymphocyte (CTL) repertoire translates to that found following an influenza-virus-specific immune response. Such interrogation of our extensive, cumulated TCR CDR3β sequence datasets, derived from both naïve and immune CD8(+) T-cell populations specific for four different influenza-derived epitopes (D(b)NP(366), influenza nucleoprotein amino acid residues 366-374; D(b)PA(224), influenza acid polymerase amino acid residues 224-233; D(b)PB1-F2(62), influenza polymerase B 1 reading frame 2 amino acid residues 62-70; K(b)NS2(114), and influenza nonstructural protein 2 amino acid residues 114-121), demonstrates that epitope-specific TCR use in an antiviral immune response is the consequence of a complex interplay between the intrinsic characteristics of the naïve cytotoxic T lymphocyte precursor pool and extrinsic (likely antigen driven) influences, the contribution of which varies in an epitope-specific fashion.
Conflict of interest statement
The authors declare no conflict of interest.
Figures
Fig. 1.
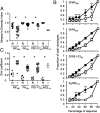
Selective clonotype expansion in immune epitope-specific responses. (A) Clonotypic diversity within naïve (N, closed symbols) and immune (I, open symbols) mice was measured using Simpson’s diversity index (*P < 0.01 using Student’s unpaired t test). (B) Evenness of clonotype distribution in naïve and immune mice was determined by ranking clonotypes from largest to smallest for each mouse and the cumulative proportion of total clonotypes was plotted against the cumulative percentage of the response (percentage of the total sequences). Shown are the means ± SD of data obtained from 6, 6, 5, and 4 naïve mice (closed symbols) and 11, 13, 19, and 2 immune mice (open symbols), for DbNP366, DbPA224, DbPB1-F262, and KbNS2114, respectively. (C) Statistical comparison of clonotype distribution between naïve (N, closed symbols) and immune (I, open symbols) populations was performed using the Gini coefficient (26) (*P < 0.001, comparing naïve to immune sets).
Fig. 2.
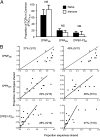
Clonotype sharing versus abundance in virus-specific CTL responses. (A) PTIC is the proportion of the clonotypic response from individual immune mice that is shared by at least 33% of mice sampled. Shown is mean ± SD for sequence data described in Fig. 1. Statistical analyses were performed using the Mann–Whitney test. NS, not significant, P > 0.05. (B) Relative abundance of shared clonotypes was determined by plotting, for each mouse, the proportion of clonotypes shared in ∼25% (first column) or ∼40% (second column) of mice (actual percentage of mice is noted within each plot and is determined by the number of mice analyzed) against the proportion of the total response those clonotypes contribute (proportion sequences shared).
Fig. 3.
Nucleotide flexibility within and between naïve individuals. Model sharing indices were generated using two methods of rarefaction to test how the measures of within- and between-mouse sharing compared with a random distribution. (A) All experimentally observed nucleotide sequences from naïve animals were randomly assigned to one of six theoretical “mice” (without replacement) and the within-mouse and between-mice sharing measures were calculated for this artificially produced dataset, with 1,000 total simulations. (B) For each epitope specificity, sequences were randomly distributed among theoretical mice, by randomly drawing from the pool of sequences, with each sequence having an equal probability of being chosen in each draw (i.e., sampling with replacement). Within-mouse and between-mice sharing is then calculated (as described) for the theoretical set (dots; a representative 100 of a total 1,000 simulations) or actual data (triangles).
Similar articles
- Effect of MHC class I diversification on influenza epitope-specific CD8+ T cell precursor frequency and subsequent effector function.
Day EB, Charlton KL, La Gruta NL, Doherty PC, Turner SJ. Day EB, et al. J Immunol. 2011 Jun 1;186(11):6319-28. doi: 10.4049/jimmunol.1000883. Epub 2011 May 2. J Immunol. 2011. PMID: 21536802 Free PMC article. - Paired TCRαβ analysis of virus-specific CD8(+) T cells exposes diversity in a previously defined 'narrow' repertoire.
Cukalac T, Kan WT, Dash P, Guan J, Quinn KM, Gras S, Thomas PG, La Gruta NL. Cukalac T, et al. Immunol Cell Biol. 2015 Oct;93(9):804-14. doi: 10.1038/icb.2015.44. Epub 2015 Mar 25. Immunol Cell Biol. 2015. PMID: 25804828 Free PMC article. - Lack of prominent peptide-major histocompatibility complex features limits repertoire diversity in virus-specific CD8+ T cell populations.
Turner SJ, Kedzierska K, Komodromou H, La Gruta NL, Dunstone MA, Webb AI, Webby R, Walden H, Xie W, McCluskey J, Purcell AW, Rossjohn J, Doherty PC. Turner SJ, et al. Nat Immunol. 2005 Apr;6(4):382-9. doi: 10.1038/ni1175. Epub 2005 Feb 27. Nat Immunol. 2005. PMID: 15735650 - The molecular mechanisms of CD8+ T cell responses to SARS-CoV-2 infection mediated by TCR-pMHC interactions.
Deng S, Xu Z, Hu J, Yang Y, Zhu F, Liu Z, Zhang H, Wu S, Jin T. Deng S, et al. Front Immunol. 2024 Oct 10;15:1468456. doi: 10.3389/fimmu.2024.1468456. eCollection 2024. Front Immunol. 2024. PMID: 39450171 Free PMC article. Review. - Specific T-cell activation in an unspecific T-cell repertoire.
Van Den Berg HA, Molina-París C, Sewell AK. Van Den Berg HA, et al. Sci Prog. 2011;94(Pt 3):245-64. doi: 10.3184/003685011X13139280383942. Sci Prog. 2011. PMID: 22026148 Free PMC article. Review.
Cited by
- Dynamic blood single-cell immune responses in patients with COVID-19.
Huang L, Shi Y, Gong B, Jiang L, Zhang Z, Liu X, Yang J, He Y, Jiang Z, Zhong L, Tang J, You C, Jiang Q, Long B, Zeng T, Luo M, Zeng F, Zeng F, Wang S, Yang X, Yang Z. Huang L, et al. Signal Transduct Target Ther. 2021 Mar 6;6(1):110. doi: 10.1038/s41392-021-00526-2. Signal Transduct Target Ther. 2021. PMID: 33677468 Free PMC article. - Artificial intelligence-powered discovery of small molecules inhibiting CTLA-4 in cancer.
Sobhani N, Tardiel-Cyril DR, Chai D, Generali D, Li JR, Vazquez-Perez J, Lim JM, Morris R, Bullock ZN, Davtyan A, Cheng C, Decker WK, Li Y. Sobhani N, et al. BJC Rep. 2024;2:4. doi: 10.1038/s44276-023-00035-5. Epub 2024 Jan 23. BJC Rep. 2024. PMID: 38312352 Free PMC article. - End-Stage Renal Disease Causes Skewing in the TCR Vβ-Repertoire Primarily within CD8+ T Cell Subsets.
Huang L, Betjes MGH, Klepper M, Langerak AW, Baan CC, Litjens NHR. Huang L, et al. Front Immunol. 2017 Dec 15;8:1826. doi: 10.3389/fimmu.2017.01826. eCollection 2017. Front Immunol. 2017. PMID: 29326709 Free PMC article. - Identification of a CD8+ T-cell response to a predicted neoantigen in malignant mesothelioma.
Sneddon S, Rive CM, Ma S, Dick IM, Allcock RJN, Brown SD, Holt RA, Watson M, Leary S, Lee YCG, Robinson BWS, Creaney J. Sneddon S, et al. Oncoimmunology. 2019 Nov 3;9(1):1684713. doi: 10.1080/2162402X.2019.1684713. eCollection 2020. Oncoimmunology. 2019. PMID: 32002298 Free PMC article. - How many TCR clonotypes does a body maintain?
Lythe G, Callard RE, Hoare RL, Molina-París C. Lythe G, et al. J Theor Biol. 2016 Jan 21;389:214-24. doi: 10.1016/j.jtbi.2015.10.016. Epub 2015 Nov 7. J Theor Biol. 2016. PMID: 26546971 Free PMC article.
References
- Malherbe L, Hausl C, Teyton L, McHeyzer-Williams MG. Clonal selection of helper T cells is determined by an affinity threshold with no further skewing of TCR binding properties. Immunity. 2004;21(5):669–679. - PubMed
- Schmid DA, et al. Evidence for a TCR affinity threshold delimiting maximal CD8 T cell function. J Immunol. 2010;184(9):4936–4946. - PubMed
Publication types
MeSH terms
Substances
Grants and funding
- AI072193/AI/NIAID NIH HHS/United States
- R01 AI070251/AI/NIAID NIH HHS/United States
- K25 AI072193/AI/NIAID NIH HHS/United States
- AI077714/AI/NIAID NIH HHS/United States
- AI70251/AI/NIAID NIH HHS/United States
- F32 AI065097/AI/NIAID NIH HHS/United States
- K22 AI077714/AI/NIAID NIH HHS/United States
- AI065097/AI/NIAID NIH HHS/United States
LinkOut - more resources
Full Text Sources
Other Literature Sources
Research Materials
Miscellaneous


