Inhibition of clathrin by pitstop 2 activates the spindle assembly checkpoint and induces cell death in dividing HeLa cancer cells - PubMed (original) (raw)
Inhibition of clathrin by pitstop 2 activates the spindle assembly checkpoint and induces cell death in dividing HeLa cancer cells
Charlotte M Smith et al. Mol Cancer. 2013.
Abstract
Background: During metaphase clathrin stabilises the mitotic spindle kinetochore (K)-fibres. Many anti-mitotic compounds target microtubule dynamics. Pitstop 2™ is the first small molecule inhibitor of clathrin terminal domain and inhibits clathrin-mediated endocytosis. We investigated its effects on a second function for clathrin in mitosis.
Results: Pitstop 2 did not impair clathrin recruitment to the spindle but disrupted its function once stationed there. Pitstop 2 trapped HeLa cells in metaphase through loss of mitotic spindle integrity and activation of the spindle assembly checkpoint, phenocopying clathrin depletion and aurora A kinase inhibition.
Conclusions: Pitstop 2 is therefore a new tool for investigating clathrin spindle dynamics. Pitstop 2 reduced viability in dividing HeLa cells, without affecting dividing non-cancerous NIH3T3 cells, suggesting that clathrin is a possible novel anti-mitotic drug target.
Figures
Figure 1
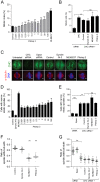
Pitstop 2 disrupts the mitotic spindle and impairs mitotic progression. A-B, Asynchronously growing HeLa cells were treated with the indicated concentration of pitstop 2, 0.1% DMSO vehicle, or 0.3 μM MLN8237 for 6 h (A). Asynchronously growing CHC-depleted cells were treated with pitstop 2 (30 μM), dynole 34-2 (30 μM), MLN8237 (0.3 μM) or DMSO vehicle (0.1%) for 6 h (B). Graphs show the percentage of cells in metaphase (mitotic index, mean ± S.E.M. from two independent experiments, n≥300 per sample). (C) Representative microscopy images of G2/M-synchronized HeLa cells after 30 min treatment with pitstop 2 (30 μM), dynole 34-2 (30 μM), MLN8237 (0.3 μM) or DMSO vehicle (0.1%). Images of untreated, CHC-depleted and epsin-depleted G2/M-synchronized cells are also shown. Alpha-tubulin (red); CHC (green); DNA (blue).D-E, Graphs (mean ± S.E.M. of two independent experiments; n≥30 per sample) show the percentage of metaphase cells with a narrow mitotic spindle in (D) cells described in C as well as in (E) untreated, CHC-depleted, epsin-depleted G2/M-synchronized and in CHC-depleted cells treated with pitstop 2 (30 μM), dynole 34-2 (30 μM), MLN8237 (0.3 μM), or DMSO vehicle (0.1%) for 30 min following G2/M synchronization. F-G, Dot blots show the ratio of the width of the mitotic spindle/total cell of metaphase cells quantified in (D) and (E). Pitstop 2 assessed at 30 μM. Each dot represents one cell. Solid black line represents median (n≥2, 30 cells per sample). Statistical significance determined by Student’s _t_-test (* p < 0.05, ** p < 0.01).
Figure 2
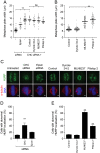
Pitstop 2 disrupts chromosome congression and K-fibre organization during metaphase. A-B, Metaphase synchronized HeLa cells were treated with the indicated siRNA either alone or in combination with pitstop 2 (30 μM), dynole 34-2 (30 μM), MLN8237 (0.3 μM), or DMSO (0.1%) (A) or with the indicated drug alone (B). The graph shows the width of the metaphase plate in each experimental condition, where each dot represents a cell (n≥2 30 cells were scored per sample). Median is indicated by the solid black line. Statistical significance was determined by a Student’s _t_-test (* p < 0.05, ** p < 0.01). C-E, Metaphase synchronized HeLa cells treated with the indicated siRNA or drugs were stained for α-tubulin (red), HURP (green), and DNA (DAPI, blue). Representative immunofluorescence microscopy images are shown in (C). The graphs (mean ± S.E.M.; n≥30 per sample) show the percentage of siRNA-treated (D) and drug-treated (E) cells with abnormal HURP localisation. Statistical significance was determined using a Student’s _t_-test (* p < 0.05, ** p < 0.01).
Figure 3
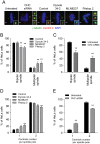
Pitstop 2 induces multipolar spindle formation and loss of centriole cohesion. A, Representative immunofluorescence microscopy images of metaphase synchronized CHC-depleted HeLa cells or HeLa treated with pitstop 2 (30 μM), dynole 34-2 (30 μM), MLN8237 (0.3 μM) or DMSO vehicle (0.1%) showing the centrosomes (centrin 2, red) surrounded by the PCM (γ-tubulin, green). DNA shown in blue. Inset shows a zoomed in image of the centrosomes. B-E, HeLa cells treated with the indicated drugs (B and D) or siRNA (C and E) described in (A) were scored for the presence of multipolar spindles (B and C) and the poles of these spindles were scored for the number of centrioles per PCM (D and E). The graphs (mean ± S.E.M. of two independent experiments; n≥30 per sample) show the percentage of cells with these characteristics. The x-axis in D and E represent the number of centrioles per spindle pole in each metaphase cell. Statistical significance was determined by a Student’s_t_-test (* p < 0.05, ** p < 0.01).
Figure 4
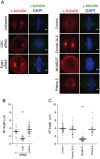
Pitstop 2 does not affect microtubule nucleation from the mitotic spindle poles. A, Metaphase synchronized HeLa cells were treated as described in Figure 2C then subjected to a MT regrowth assay whereby the MTs were allowed to regrow for 5 mins following depolymerization. Cells were fixed and stained for γ-tubulin (green), α-tubulin (red), and DNA (DAPI, blue). B-C, The dot blots show the length of the longest MT grown from each spindle pole in HeLa cells treated with the indicated siRNA (B) or drugs (C) as described in A. The median MT length in each experimental condition is indicated by the solid black line. n≥30 per sample. Statistical significance was determined by a Student’s _t_-test (* p < 0.05, ** p < 0.01).
Figure 5
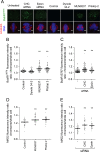
Pitstop 2 activates the SAC. A, Metaphase synchronized HeLa cells were treated as described in Figure legend 2C then fixed and stained for phospho-BubR1S676(green), α-tubulin (red) and DNA (DAPI, blue). Representative immunofluorescence microscopy images show that the amount of phospho-BubR1S676 on the chromosomes increases following treatment with pitstop 2, MLN8237, and following depletion of CHC or epsin. B-C, The dot blots show the fluorescence intensity ratio of BubR1S676 on the chromosomes/whole cell in individual HeLa cells treated with the indicated drugs (B) or siRNA (C). D-E, Metaphase synchronized HeLa cells were treated and processed as described in A except that they were stained for MAD2 instead of BubR1S676. The dot blots show the fluorescence intensity ratio of MAD2 on the chromosomes/whole cell in individual HeLa cells treated with the indicated drugs (B) or siRNA (C). The median fluorescence intensity ratio in all dots blots shown is indicated by the solid black line. n≥30 per sample from two independent experiments. Statistical significance was determined by a Student’s _t_-test (* p < 0.05, ** p < 0.01).
Figure 6
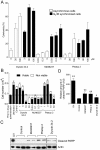
Pitstop 2 causes cell death and inhibits cell growth in dividing cells. A, Asynchronously growing and G2/M-synchronized HeLa cells were subject to an LDH assay following a 20 h treatment with increasing concentrations of pitstop 2, dynole 34-2 and MLN8237. The graph shows the amount of LDH in each experimental condition, as an indicator of cellular cytotoxicity, which was calculated as a percentage of total cell lysis. B, G2/M-synchronized HeLa cells were exposed to increasing concentrations of dynole 34-2, MLN8237 and pitstop 2 for 24 h. Total viable and non-viable cell number (mean ± S.D. from two independent experiments) were assessed by trypan blue. C, Cells were treated as described in B. Lysates were collected and immunoblotted for cleaved PARP. HeLa cells exposed to UV served as a positive control. Actin served as a loading control. D, Quantitative densitometric analysis of cleaved PARP levels shown in C. Graph (mean ± S.E.M. from five independent experiments) shows the relative amount of PARP in HeLa cells following treatment with the indicated conditions that have been normalised to background.
Figure 7
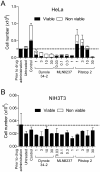
Pitstop 2 does not affect the growth and viability of non-tumourigenic NIH3T3 fibroblasts. A-B, HeLa (A) and NIH3T3 (B) cells were synchronized in mitosis and then treated with increasing concentrations of the indicated compounds at 24 h intervals. After 48 h, total viable and non-viable cell number (mean ± S.D. from two independent experiments) was assessed by trypan blue. Drug concentrations are indicated in μM units.
Similar articles
- Pitstop 2 is a potent inhibitor of clathrin-independent endocytosis.
Dutta D, Williamson CD, Cole NB, Donaldson JG. Dutta D, et al. PLoS One. 2012;7(9):e45799. doi: 10.1371/journal.pone.0045799. Epub 2012 Sep 21. PLoS One. 2012. PMID: 23029248 Free PMC article. - 6,7-Dimethoxy-3-(3-methoxyphenyl)isoquinolin-1-amine induces mitotic arrest and apoptotic cell death through the activation of spindle assembly checkpoint in human cervical cancer cells.
Chung KS, Choi HE, Shin JS, Cho YW, Choi JH, Cho WJ, Lee KT. Chung KS, et al. Carcinogenesis. 2013 Aug;34(8):1852-60. doi: 10.1093/carcin/bgt133. Epub 2013 Apr 24. Carcinogenesis. 2013. PMID: 23615402 - Polo-like kinase 1 inhibitor BI2536 causes mitotic catastrophe following activation of the spindle assembly checkpoint in non-small cell lung cancer cells.
Choi M, Kim W, Cheon MG, Lee CW, Kim JE. Choi M, et al. Cancer Lett. 2015 Feb 28;357(2):591-601. doi: 10.1016/j.canlet.2014.12.023. Epub 2014 Dec 15. Cancer Lett. 2015. PMID: 25524551 - The role of clathrin in mitotic spindle organisation.
Royle SJ. Royle SJ. J Cell Sci. 2012 Jan 1;125(Pt 1):19-28. doi: 10.1242/jcs.094607. J Cell Sci. 2012. PMID: 22294613 Free PMC article. Review. - Mitotic inhibition of clathrin-mediated endocytosis.
Fielding AB, Royle SJ. Fielding AB, et al. Cell Mol Life Sci. 2013 Sep;70(18):3423-33. doi: 10.1007/s00018-012-1250-8. Epub 2013 Jan 11. Cell Mol Life Sci. 2013. PMID: 23307073 Free PMC article. Review.
Cited by
- Clathrin's adaptor interaction sites are repurposed to stabilize microtubules during mitosis.
Rondelet A, Lin YC, Singh D, Porfetye AT, Thakur HC, Hecker A, Brinkert P, Schmidt N, Bendre S, Müller F, Mazul L, Widlund PO, Bange T, Hiller M, Vetter IR, Bird AW. Rondelet A, et al. J Cell Biol. 2020 Feb 3;219(2):e201907083. doi: 10.1083/jcb.201907083. J Cell Biol. 2020. PMID: 31932847 Free PMC article. - Human Immunodeficiency Virus 1 Preferentially Fuses with pH-Neutral Endocytic Vesicles in Cell Lines and Human Primary CD4+ T-Cells.
Sharma M, Marin M, Wu H, Prikryl D, Melikyan GB. Sharma M, et al. ACS Nano. 2023 Sep 12;17(17):17436-17450. doi: 10.1021/acsnano.3c05508. Epub 2023 Aug 17. ACS Nano. 2023. PMID: 37589658 Free PMC article. - The AP-2 complex interacts with γ-TuRC and regulates the proliferative capacity of neural progenitors.
Camblor-Perujo S, Ozer Yildiz E, Küpper H, Overhoff M, Rastogi S, Bazzi H, Kononenko NL. Camblor-Perujo S, et al. Life Sci Alliance. 2023 Dec 12;7(2):e202302029. doi: 10.26508/lsa.202302029. Print 2024 Feb. Life Sci Alliance. 2023. PMID: 38086550 Free PMC article. - Opposite changes in the expression of clathrin and caveolin-1 in normal and cancerous human prostate tissue: putative clathrin-mediated recycling of EGFR.
Xie B, Zuhair H, Henrique R, Millar M, Robson T, Thrasivoulou C, Dickens K, Pendjiky J, Muneer A, Patel H, Ahmed A. Xie B, et al. Histochem Cell Biol. 2023 Jun;159(6):489-500. doi: 10.1007/s00418-023-02183-8. Epub 2023 Mar 4. Histochem Cell Biol. 2023. PMID: 36869937 Free PMC article. - Role of Silymarin in Cancer Treatment: Facts, Hypotheses, and Questions.
Koltai T, Fliegel L. Koltai T, et al. J Evid Based Integr Med. 2022 Jan-Dec;27:2515690X211068826. doi: 10.1177/2515690X211068826. J Evid Based Integr Med. 2022. PMID: 35018864 Free PMC article. Review.
References
Publication types
MeSH terms
Substances
LinkOut - more resources
Full Text Sources
Other Literature Sources
