The type 2 diabetes-associated gene ide is required for insulin secretion and suppression of α-synuclein levels in β-cells - PubMed (original) (raw)
. 2013 Jun;62(6):2004-14.
doi: 10.2337/db12-1045. Epub 2013 Jan 24.
Affiliations
- PMID: 23349488
- PMCID: PMC3661649
- DOI: 10.2337/db12-1045
The type 2 diabetes-associated gene ide is required for insulin secretion and suppression of α-synuclein levels in β-cells
Pär Steneberg et al. Diabetes. 2013 Jun.
Abstract
Genome-wide association studies have identified several type 2 diabetes (T2D) risk loci linked to impaired β-cell function. The identity and function of the causal genes in these susceptibility loci remain, however, elusive. The HHEX/IDE T2D locus is associated with decreased insulin secretion in response to oral glucose stimulation in humans. Here we have assessed β-cell function in Ide knockout (KO) mice. We find that glucose-stimulated insulin secretion (GSIS) is decreased in Ide KO mice due to impaired replenishment of the releasable pool of granules and that the Ide gene is haploinsufficient. We also show that autophagic flux and microtubule content are reduced in β-cells of Ide KO mice. One important cellular role for IDE involves the neutralization of amyloidogenic proteins, and we find that α-synuclein and IDE levels are inversely correlated in β-cells of Ide KO mice and T2D patients. Moreover, we provide evidence that both gain and loss of function of α-synuclein in β-cells in vivo impair not only GSIS but also autophagy. Together, these data identify the Ide gene as a regulator of GSIS, suggest a molecular mechanism for β-cell degeneration as a consequence of Ide deficiency, and corroborate and extend a previously established important role for α-synuclein in β-cell function.
Figures
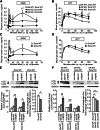
FIG. 1.
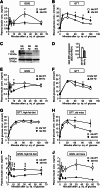
Impaired insulin secretion and glucose intolerance in Ide KO mice. Insulin (A) and glucose (B) levels during GTT performed on 7–8-week-old Ide KO (n = 8) and Ide WT (n = 8) mice. Immunoblot (C) and quantification (D) analyses of islet IDE expression in Ide WT, Ide Hz, and Ide KO mice (n = 3 mice of each genotype). GSIS (E) and GTT (F) in 20-week-old Ide Hz (n = 7) and Ide WT (n = 8) mice. GTT (G and H) and GSIS (I and J) on Ide KO (n = 9) and Ide WT mice (n = 16) on high-fat diet for 13 weeks (G and I) and on 12–16-month-old Ide KO (n = 4) and Ide WT mice (n = 3) (H and J). Data are presented as mean ± SEM. *P < 0.05; **P < 0.01; ***P < 0.001 (Student t test). GAPDH, glyceraldehyde-3-phosphate dehydrogenase.
FIG. 2.
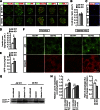
Increased pancreatic insulin and IAPP content in Ide KO mice. A: Representative immunohistochemical staining of pancreatic sections from 12-week-old Ide KO and Ide WT mice showing insulin (green), glucagon, somatostatin, pancreatic polypeptide (PP), Glut2, Ipf1/Pdx1, and Isl1 (all in red). Scale bar, 50 μm. B: Quantification of β-cell area in Ide WT (n = 3) and Ide KO (n = 3) mice. C: Representative caspase-3 immunohistochemistry staining of pancreas sections from 14-week-old Ide WT and Ide KO mice. D: Radioimmunoassay analyses of total pancreatic insulin content in Ide KO (n = 7) and Ide WT mice (n = 4). E: Enzyme immunosorbent assay analyses of total pancreatic IAPP content in Ide KO (n = 4) and Ide WT mice (n = 4). F: Representative immunohistochemistry staining of pancreatic sections from fed and 24-h starved Ide KO and Ide WT mice (n = 3 per genotype) showing p62 and polyubiquitin. Scale bar, 10 μm. G and H: Immunoblot (G) and quantification (H) analyses of LC3-II expression in nonstarved and starved Ide KO (n = 6 mice) and Ide WT (n = 6 mice) islets, in the absence or presence of chloroquine (s + chl). Data are presented as mean ± SEM. *P < 0.05; **P < 0.01; ***P < 0.001 (Student t test). GAPDH, glyceraldehyde-3-phosphate dehydrogenase.
FIG. 3.
Ide KO mice fail to replenish the readily releasable pool of insulin granules. Insulin secretion after intraperitoneal injection of glibenclamide (12-week-old Ide KO [n = 7] and Ide WT [n = 3]) (A), arginine (13–17-week-old Ide KO [n = 11] and Ide WT [n = 14]) (B), and carbachol (14–18-week-old Ide KO [n = 8] and Ide WT [n = 9]) (C). D: Insulin secretion after consecutive, dual arginine injections administered at time 0 and 10 min, indicated by arrows in 16-week-old Ide KO (n = 6) and Ide WT (n = 4) mice. E: Insulin secretion from four single, size-matched islets incubated in the presence of 150 μmol/L diazoxide and 30 mmol/L K+ at either 16.8 (diamonds) or 2.8 mmol/L (triangles) glucose. Significance is indicated for comparison of datasets between 16.8 and 2.8 mmol/L glucose for Ide WT (*) and Ide KO (°), respectively. Islets were isolated from 12–15-week-old Ide KO (n = 5) and Ide WT (n = 4) mice. Data are presented as mean ± SEM. *P < 0.05; **P < 0.01; ***/°°°P < 0.001 (Student t test).
FIG. 4.
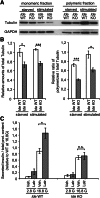
Microtubule levels are reduced in Ide KO islets. Immunoblot (A) and quantification (B) analyses of monomeric and polymeric tubulin fractions from starved and glucose-stimulated Ide KO and Ide WT islets (n = 8 mice per genotype). C: Insulin secretion from isolated Ide KO (n = 4 mice) and Ide WT (n = 4 mice) islets after exposure to latrunculin-B at low (2.8 mmol/L) and high (16.8 mmol/L) glucose concentrations. Data are presented as mean ± SEM. *P < 0.05; ***P < 0.001 (Student t test). GAPDH, glyceraldehyde-3-phosphate dehydrogenase; Veh, Vehicle; Latr, Latrunculin B.
FIG. 5.
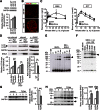
α-Synuclein levels are increased in Ide KO islets. A: Immunoblot and quantification analyses of α-synuclein (SNCA) levels in isolated islets from Ide WT, Ide Hz, and Ide KO mice (n = 3 per genotype). B: Representative immunohistochemistry staining of Ide WT and Ide KO pancreas using SNCA (red) and glucagon (green) antibodies. Scale bar, 50 µm. C: GSIS and GTT performed on 10–17-week-old Rip/Snca (n = 11) and control (n = 9) mice. D: Immunoblot and quantification analyses of LC3-II and SNCA expression in nonstarved and starved ± BafA1 (s + BafA1) islets isolated from Rip/Snca (n = 6) and control (n = 6) mice. E: Representative immunoblot of SNCA incubated for 0’, 30’, 1 h, or 2 h in the absence or presence of recombinant IDE, using α-synuclein antibody. F: Representative immunoblot of SNCA incubated with increasing concentrations of recombinant IDE, using SNCA antibody. G: Representative immunoblot and quantification analyses of islets from T2D (n = 4) and nondiabetic (n = 4) patients using IDE antibody. H: Representative immunoblot and quantification analyses of islets from T2D and nondiabetic patients using SNCA antibody. Arrowheads indicate monomeric α-synuclein (I) and an ∼50–70 kDa oligomeric product (III) in T2D islets. Data are presented as mean ± SEM. *P < 0.05; **P < 0.01; ***P < 0.001 (Student t test). GAPDH, glyceraldehyde-3-phosphate dehydrogenase.
FIG. 6.
α-Synuclein mutant (Snca KO) mice show decreased GSIS and reduced autophagy flux in islets. A–D: Insulin (A and C) and glucose (B and D) levels during GTT performed on 7–9-week-old Ide WT, Ide KO, Snca KO;Ide KO (A and B), Snca WT, and Snca KO mice (C and D) (n = 8–15 per genotype). Significance is indicated for comparison of datasets between Ide WT and Ide KO (*), Snca WT and Snca KO (*), and Ide WT and Snca KO;Ide KO (°), respectively. E and F: Immunoblot and quantification analyses of LC3-II expression in nonstarved and starved Ide WT, Ide KO, Snca KO;Ide KO, Snca KO, and Snca WT islets, in the absence or presence of BafA1 (s + BafA1) (n = 6 mice per genotype). Data are presented as mean ± SEM. *P < 0.05; **P < 0.01; ***P < 0.001 (Student t test). GAPDH, glyceraldehyde-3-phosphate dehydrogenase.
FIG. 7.
Model for the role of IDE in β-cell function. IDE forms irreversible complexes with α-synuclein monomers. Loss of Ide in β-cells leads to increased levels of free α-synuclein monomers that, via subsequent formation of oligomers, impair insulin secretion and autophagy, possibly in part by attenuation of the microtubule network.
Similar articles
- Insulin-degrading enzyme ablation in mouse pancreatic alpha cells triggers cell proliferation, hyperplasia and glucagon secretion dysregulation.
Merino B, Casanueva-Álvarez E, Quesada I, González-Casimiro CM, Fernández-Díaz CM, Postigo-Casado T, Leissring MA, Kaestner KH, Perdomo G, Cózar-Castellano I. Merino B, et al. Diabetologia. 2022 Aug;65(8):1375-1389. doi: 10.1007/s00125-022-05729-y. Epub 2022 Jun 2. Diabetologia. 2022. PMID: 35652923 Free PMC article. - Pancreatic β-cell-specific deletion of insulin-degrading enzyme leads to dysregulated insulin secretion and β-cell functional immaturity.
Fernández-Díaz CM, Merino B, López-Acosta JF, Cidad P, de la Fuente MA, Lobatón CD, Moreno A, Leissring MA, Perdomo G, Cózar-Castellano I. Fernández-Díaz CM, et al. Am J Physiol Endocrinol Metab. 2019 Nov 1;317(5):E805-E819. doi: 10.1152/ajpendo.00040.2019. Epub 2019 Sep 3. Am J Physiol Endocrinol Metab. 2019. PMID: 31479304 Free PMC article. - Pharmacological activation of insulin-degrading enzyme improves insulin secretion and glucose tolerance in diet-induced obese mice.
Sanz-González A, Cózar-Castellano I, Broca C, Sabatier J, Acosta GA, Royo M, Hernándo-Muñoz C, Torroba T, Perdomo G, Merino B. Sanz-González A, et al. Diabetes Obes Metab. 2023 Nov;25(11):3268-3278. doi: 10.1111/dom.15225. Epub 2023 Jul 26. Diabetes Obes Metab. 2023. PMID: 37493025 - Targeting Insulin-Degrading Enzyme to Treat Type 2 Diabetes Mellitus.
Tang WJ. Tang WJ. Trends Endocrinol Metab. 2016 Jan;27(1):24-34. doi: 10.1016/j.tem.2015.11.003. Epub 2015 Dec 2. Trends Endocrinol Metab. 2016. PMID: 26651592 Free PMC article. Review. - Modulation of β-cell function: a translational journey from the bench to the bedside.
Goldfine AB, Kulkarni RN. Goldfine AB, et al. Diabetes Obes Metab. 2012 Oct;14 Suppl 3:152-60. doi: 10.1111/j.1463-1326.2012.01647.x. Diabetes Obes Metab. 2012. PMID: 22928576 Review.
Cited by
- Targeting Insulin-Degrading Enzyme in Insulin Clearance.
Leissring MA, González-Casimiro CM, Merino B, Suire CN, Perdomo G. Leissring MA, et al. Int J Mol Sci. 2021 Feb 24;22(5):2235. doi: 10.3390/ijms22052235. Int J Mol Sci. 2021. PMID: 33668109 Free PMC article. Review. - Hematopoietically expressed homeobox gene is associated with type 2 diabetes in KK Cg-Ay/J mice and a Taiwanese Han Chinese population.
Lu CC, Chen YT, Chen SY, Hsu YM, Lin CC, Tsao JW, Juan YN, Yang JS, Tsai FJ. Lu CC, et al. Exp Ther Med. 2018 Jul;16(1):185-191. doi: 10.3892/etm.2018.6152. Epub 2018 May 10. Exp Ther Med. 2018. PMID: 29896239 Free PMC article. - The cell biology of systemic insulin function.
Tokarz VL, MacDonald PE, Klip A. Tokarz VL, et al. J Cell Biol. 2018 Jul 2;217(7):2273-2289. doi: 10.1083/jcb.201802095. Epub 2018 Apr 5. J Cell Biol. 2018. PMID: 29622564 Free PMC article. Review. - Establishment of mitochondrial pyruvate carrier 1 (MPC1) gene knockout mice with preliminary gene function analyses.
Li X, Li Y, Han G, Li X, Ji Y, Fan Z, Zhong Y, Cao J, Zhao J, Mariusz G, Zhang M, Wen J, Nesland JM, Suo Z. Li X, et al. Oncotarget. 2016 Nov 29;7(48):79981-79994. doi: 10.18632/oncotarget.13210. Oncotarget. 2016. PMID: 27835892 Free PMC article. - Short-Term Calorie Restriction Maintains Plasma Insulin Concentrations along with a Reduction in Hepatic Insulin-Degrading Enzyme Levels in db/db Mice.
Nonaka Y, Takeda R, Kano Y, Hoshino D. Nonaka Y, et al. Nutrients. 2021 Apr 3;13(4):1190. doi: 10.3390/nu13041190. Nutrients. 2021. PMID: 33916828 Free PMC article.
References
- Perry JR, Frayling TM. New gene variants alter type 2 diabetes risk predominantly through reduced beta-cell function. Curr Opin Clin Nutr Metab Care 2008;11:371–377 - PubMed
- Saxena R, Voight BF, Lyssenko V, et al. Diabetes Genetics Initiative of Broad Institute of Harvard and MIT, Lund University, and Novartis Institutes of BioMedical Research Genome-wide association analysis identifies loci for type 2 diabetes and triglyceride levels. Science 2007;316:1331–1336 - PubMed
- Grarup N, Rose CS, Andersson EA, et al. Studies of association of variants near the HHEX, CDKN2A/B, and IGF2BP2 genes with type 2 diabetes and impaired insulin release in 10,705 Danish subjects: validation and extension of genome-wide association studies. Diabetes 2007;56:3105–3111 - PubMed
Publication types
MeSH terms
Substances
LinkOut - more resources
Full Text Sources
Other Literature Sources
Medical
Molecular Biology Databases
Research Materials
