Apelin inhibits diet-induced obesity by enhancing lymphatic and blood vessel integrity - PubMed (original) (raw)
. 2013 Jun;62(6):1970-80.
doi: 10.2337/db12-0604. Epub 2013 Feb 1.
Affiliations
- PMID: 23378608
- PMCID: PMC3661640
- DOI: 10.2337/db12-0604
Apelin inhibits diet-induced obesity by enhancing lymphatic and blood vessel integrity
Mika Sawane et al. Diabetes. 2013 Jun.
Abstract
Angiogenesis is tightly associated with the outgrowth of adipose tissue, leading to obesity, which is a risk factor for type 2 diabetes and hypertension, mainly because expanding adipose tissue requires an increased nutrient supply from blood vessels. Therefore, induction of vessel abnormality by adipokines has been well-studied, whereas how altered vascular function promotes obesity is relatively unexplored. Also, surviving Prox1 heterozygous mice have shown abnormal lymphatic patterning and adult-onset obesity, indicating that accumulation of adipocytes could be closely linked with lymphatic function. Here, we propose a new antiobesity strategy based on enhancement of lymphatic and blood vessel integrity with apelin. Apelin knockout (KO) mice fed a high-fat diet (HFD) showed an obese phenotype associated with abnormal lymphatic and blood vessel enlargement. Fatty acids present in the HFD induced hyperpermeability of endothelial cells, causing adipocyte differentiation, whereas apelin promoted vascular stabilization. Moreover, treatment of apelin KO mice with a selective cyclooxygenase-2 inhibitor, celecoxib, that were fed an HFD improved vascular function and also attenuated obesity. Finally, apelin transgenic mice showed decreased subcutaneous adipose tissue attributable to inhibition of HFD-induced hyperpermeability of vessels. These results indicate that apelin inhibits HFD-induced obesity by enhancing vessel integrity. Apelin could serve as a therapeutic target for treating obesity and related diseases.
Figures
FIG. 1.
Obesity in HFD-fed apelin KO mice. A: Body weight of HFD-fed apelin KO and WT mice (N = 7). Increased body weight (B), inguinal subcutaneous fat weight (C), and mesenteric fat weight (D) in apelin KO mice after 17 weeks of HFD. E: Hematoxylin and eosin staining showed a thickened subcutaneous fat layer in apelin KO mice. BODIPY (green) and Isolectin (red) staining revealed increased lipid droplet (green) size in subcutaneous adipocytes in apelin KO mice (F). Morphometric analysis of adipocyte size confirmed enlargement of adipocytes in apelin KO mice (G). Arrows show crown-like structures in obese fat pads. Hematoxylin and eosin staining of subcutaneous adipose tissue surrounding lymph nodes (LN) (H) and of mesenteric fat tissue (I). J: Morphometric analysis of mesenteric adipocyte size. Bars indicate 200 μm except in (E), which shows 1 mm. Date are expressed as mean values ± SD. K: Double immunofluorescence staining with Ki67 (green) and perilipin (red) in the mesenteric fat of WT and apelin KO mice after HFD. Arrows show proliferating adipocytes. ***P < 0.001, **P < 0.01, *P < 0.05.
FIG. 2.
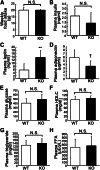
No significant difference was found in food consumption or lipid metabolism between apelin KO and WT mice after HFD. A: Food intake was similar in apelin KO mice and WT littermates. B: Obese apelin KO mice had a lower plasma insulin level, but the difference was not significant. C: Serum leptin levels were approximately two times higher in apelin KO mice than in WT mice (**P < 0.01). D: Serum adiponectin levels tended to be lower in apelin KO mice, but the difference was not significant. There was no significant difference of plasma glucose (E), HDL cholesterol (HDLC; F), triglyceride (G), or free fatty acid (FFA; H) between apelin KO mice and WT mice. Data are expressed as mean values ± SD (N = 7; **P < 0.01, †P < 0.1). N.S., not significant.
FIG. 3.
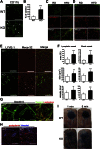
Enhanced inflammation and vascular malformation in obese apelin KO mice. A: Increased CD11b+ macrophages (green) in the subcutaneous adipose layer of skin from apelin KO mice. B: Morphometric analysis showed that the number of CD11b+ macrophages was significantly increased in apelin KO mice. Double immunofluorescence staining for podoplanin (C, red) or meca-32 (D, red) and for APJ (green) revealed upregulated expression of APJ in lymphatics of skin of HFD-fed mice. E: Double immunofluorescence staining of skin for LYVE-1 (green) and meca-32 (red) revealed enlargement (arrowheads) and enhanced formation of LYVE-1+ lymphatic vessels and meca-32+ blood vessels in apelin KO mice. F: Computer-assisted morphometric analyses of lymphatic and blood vessels in skin. G: Immunofluorescence staining for claudin-5 in a whole-mount of ear skin. Lymphatic vessels in apelin KO mice were partly dilated compared with controls. Double immunofluorescence staining of claudin-5 (green) and podoplanin (red) confirmed that the nonuniform vessels were podoplanin-positive lymphatic vessels. H: Immunofluorescence analysis of mouse skin for podoplanin (red) revealed lymphatic hyperplasia in the adipose layer of apelin KO mice. I: Intradermal injection of Evans blue dye visualized enhanced leakiness of enlarged lymphatic vessels and lymphatic backflush (arrowheads) in apelin KO mice at 1 and 5 min after the injection. Scale bars indicate 200 μm except in (G), which indicates 100 μm. Data are expressed as mean values ± SD. **P < 0.01, ***P < 0.001.
FIG. 4.
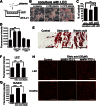
Apelin inhibits vascular hyperpermeability induced by oleic acid, thereby blocking adipocyte differentiation. A: Schematic illustration of coculture study of LECs with 3T3-L1 preadipocytes in the presence or absence of plasma. Confluent LECs were inserted with or without plasma on day 2 after initiation of differentiation. B: 3T3-L1 preadipocytes were stained with Oil-red-O (red) on day 9 after initiation of differentiation. C: Quantitative evaluation of lipid droplets of 3T3-L1 preadipocytes. D: Treatment with oleic acid increased the fluorescence intensity of permeated FITC-dextran from LECs, as compared with the control. E: Human subcutaneous preadipocytes were stained with Oil-red-O (red) on day 9 after initiation of differentiation with oleic acid or stearic acid. Fatty acid–exposed culture showed an increased amount of lipid droplets compared with the control. The addition of apelin-13 blocked the hyperpermeability of LECs (F) and human umbilical vein endothelial cells (HUVECs; G) induced by oleic acid. H: Immunohistochemistry of VE-cadherin (red) in LECs and HUVEC, showing discontinuous staining of VE-cadherin after incubation with oleic acid. Apelin-13 blocked the discontinuity of staining of VE-cadherin and the gap formation induced by oleic acid. Scale bars indicate 200 μm (E) and 100 μm (B and H). Data are expressed as mean values ± SD. *P < 0.05, **P < 0.01, ***P < 0.001.
FIG. 5.
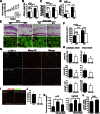
Obesity induced by apelin depletion after HFD was blocked by orally administered selective COX2 inhibitor. A: Weight gain in WT and apelin KO mice maintained on HFD or HFD containing CEL (N = 3–7). The change of body weight (B) and tissue weight of inguinal subcutaneous (C) and mesenteric (D) fat after HFD or HFD with CEL. E: Histological analysis of skin and subcutaneous adipose tissue imaging using BODIPY (green) and Isolectin (red) showed that hypertrophic adipocytes (green) were reduced in CEL-treated HFD-fed apelin KO and WT mice. Arrows show crown-like structures in obese fat pads. F: Mean adipocyte size in CEL-treated, HFD-fed, apelin KO mice was smaller than in HFD-fed apelin KO mice. G: Immunohistochemical analyses for LYVE-1 (green) and meca-32 (red) revealed that enlargement of lymphatic and blood vessels (arrowheads) in the skin of HFD-fed apelin KO mice was inhibited by CEL. H: Morphometric analyses of lymphatic and blood vessels in CEL-treated, HFD-fed, apelin KO mice and HFD-fed apelin KO mice. I: Double immunofluorescence staining for CD11b (red) and FABP4 (green) showed that macrophage infiltration in the subcutaneous fat layer from HFD-fed apelin KO mice was blocked by CEL. J: The number of infiltrated macrophages was decreased in apelin KO mice fed HFD with CEL. K: Increased permeability in LECs and human umbilical vein endothelial cells (HUVECs) after the treatment with oleic acid was blocked by the addition of CEL. Bars indicate 1 mm (E, top) and 200 μm (E, bottom, G, and I). Data are expressed as mean values ± SD. L: COX2 expression after apelin treatment of LECs. ***P < 0.001, **P < 0.01, and *P < 0.05.
FIG. 6.
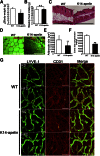
Resistance to obesity in K14-apelin mice. A: Change in body weight of HFD-fed K14-apelin and WT mice (N = 4–7). B: Average weekly food intake of each genotype. C: Hematoxylin and eosin staining of skin sections from HFD-fed, K14-apelin, and WT mice. A reduced subcutaneous adipose layer was found in K14-apelin mice. D: BODIPY (green) and Isolectin (red) staining revealed decreased size of subcutaneous adipocytes (green) in K14-apelin mice after HFD feeding. E: Morphometric analysis of adipocyte size confirmed that adipocytes were smaller in HFD-fed K14-apelin mice. Data are expressed as mean values ± SD. F: Inhibition of lymphatic dye leakage in mesenteric fat of K14-apelin mice after HFD. G: Whole-mount staining of mouse ears using antibodies against LYVE-1 (green) and CD31 (red) revealed that HFD induced enlargement of both lymphatic and blood vessels, whereas no significant difference was found between RD- and HFD-fed K14-apelin mice. Two parallel yellow lines as indicated in (G) show vascular size. Bars indicate 1 mm (C) and 200 μm (D, G). **P < 0.01, *P < 0.05.
FIG. 7.
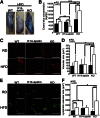
Structural and functional changes of vessels in the adipose tissues of K14-apelin and apelin KO mice after HFD. A: Miles assay revealed increased Evans blue leakage in epididymal fat of apelin KO mice and decreased leakage in that of K14-apelin mice as compared with WT mice after feeding of HFD. B: Quantitative analysis of dye leakage in the epididymal fat showed that HFD enhanced dye leakage in WT and apelin KO mice, whereas dye leakage was blocked in K14-apelin mice. Immunofluorescence analysis using antibodies against meca-32 (C) and LYVE-1 (E) in mesenteric fat. Arrowheads show enlarged blood vessels (C) and lymphatic vessels (E). Quantitative analysis of blood vessels (D) and lymphatic vessels (F) in mesenteric fat of WT, K14-apelin, and apelin KO mice. Bars indicate 200 μm. **P < 0.01, *P < 0.05.
Similar articles
- Cardiotrophin-1 Regulates Adipokine Production in 3T3-L1 Adipocytes and Adipose Tissue From Obese Mice.
López-Yoldi M, Marcos-Gomez B, Romero-Lozano MA, Sáinz N, Prieto J, Martínez JA, Bustos M, Moreno-Aliaga MJ. López-Yoldi M, et al. J Cell Physiol. 2017 Sep;232(9):2469-2477. doi: 10.1002/jcp.25590. Epub 2017 Apr 10. J Cell Physiol. 2017. PMID: 27608275 - Transition from metabolic adaptation to maladaptation of the heart in obesity: role of apelin.
Alfarano C, Foussal C, Lairez O, Calise D, Attané C, Anesia R, Daviaud D, Wanecq E, Parini A, Valet P, Kunduzova O. Alfarano C, et al. Int J Obes (Lond). 2015 Feb;39(2):312-20. doi: 10.1038/ijo.2014.122. Epub 2014 Jul 16. Int J Obes (Lond). 2015. PMID: 25027224 Free PMC article. - Deletion of adipocyte NOS3 potentiates high-fat diet-induced hypertension and vascular remodelling via chemerin.
Man AWC, Zhou Y, Reifenberg G, Camp A, Münzel T, Daiber A, Xia N, Li H. Man AWC, et al. Cardiovasc Res. 2023 Dec 30;119(17):2755-2769. doi: 10.1093/cvr/cvad164. Cardiovasc Res. 2023. PMID: 37897505 Free PMC article. - Apelin and visfatin: unique "beneficial" adipokines upregulated in obesity?
Bełtowski J. Bełtowski J. Med Sci Monit. 2006 Jun;12(6):RA112-9. Epub 2006 May 29. Med Sci Monit. 2006. PMID: 16733497 Review. - The Lymphatic Vasculature: Its Role in Adipose Metabolism and Obesity.
Escobedo N, Oliver G. Escobedo N, et al. Cell Metab. 2017 Oct 3;26(4):598-609. doi: 10.1016/j.cmet.2017.07.020. Epub 2017 Aug 24. Cell Metab. 2017. PMID: 28844882 Free PMC article. Review.
Cited by
- Mesenteric Lymphatic-Perilymphatic Adipose Crosstalk: Role in Alcohol-Induced Perilymphatic Adipose Tissue Inflammation.
Souza-Smith FM, Siggins RW, Molina PE. Souza-Smith FM, et al. Alcohol Clin Exp Res. 2015 Aug;39(8):1380-7. doi: 10.1111/acer.12796. Epub 2015 Jul 4. Alcohol Clin Exp Res. 2015. PMID: 26147204 Free PMC article. - Angiogenesis in adipose tissue and obesity.
Corvera S, Solivan-Rivera J, Yang Loureiro Z. Corvera S, et al. Angiogenesis. 2022 Nov;25(4):439-453. doi: 10.1007/s10456-022-09848-3. Epub 2022 Jul 20. Angiogenesis. 2022. PMID: 35857195 Free PMC article. Review. - Lymphatic Vasculature in Energy Homeostasis and Obesity.
Ho YC, Srinivasan RS. Ho YC, et al. Front Physiol. 2020 Jan 22;11:3. doi: 10.3389/fphys.2020.00003. eCollection 2020. Front Physiol. 2020. PMID: 32038308 Free PMC article. Review. - Modulation of endothelium function by fatty acids.
Mallick R, Duttaroy AK. Mallick R, et al. Mol Cell Biochem. 2022 Jan;477(1):15-38. doi: 10.1007/s11010-021-04260-9. Epub 2021 Sep 16. Mol Cell Biochem. 2022. PMID: 34529222 Free PMC article. Review. - The Lymphatic System in Zebrafish Heart Development, Regeneration and Disease Modeling.
Feng X, Travisano S, Pearson CA, Lien CL, Harrison MRM. Feng X, et al. J Cardiovasc Dev Dis. 2021 Feb 19;8(2):21. doi: 10.3390/jcdd8020021. J Cardiovasc Dev Dis. 2021. PMID: 33669620 Free PMC article. Review.
References
- Oliver G, Detmar M. The rediscovery of the lymphatic system: old and new insights into the development and biological function of the lymphatic vasculature. Genes Dev 2002;16:773–783 - PubMed
- Hu FB, Willett WC, Li T, Stampfer MJ, Colditz GA, Manson JE. Adiposity as compared with physical activity in predicting mortality among women. N Engl J Med 2004;351:2694–2703 - PubMed
- Crandall DL, Hausman GJ, Kral JG. A review of the microcirculation of adipose tissue: anatomic, metabolic, and angiogenic perspectives. Microcirculation 1997;4:211–232 - PubMed
- Cao Y. Adipose tissue angiogenesis as a therapeutic target for obesity and metabolic diseases. Nat Rev Drug Discov 2010;9:107–115 - PubMed
MeSH terms
Substances
LinkOut - more resources
Full Text Sources
Other Literature Sources
Medical
Molecular Biology Databases
Research Materials

