Single molecule molecular inversion probes for targeted, high-accuracy detection of low-frequency variation - PubMed (original) (raw)
Single molecule molecular inversion probes for targeted, high-accuracy detection of low-frequency variation
Joseph B Hiatt et al. Genome Res. 2013 May.
Abstract
The detection and quantification of genetic heterogeneity in populations of cells is fundamentally important to diverse fields, ranging from microbial evolution to human cancer genetics. However, despite the cost and throughput advances associated with massively parallel sequencing, it remains challenging to reliably detect mutations that are present at a low relative abundance in a given DNA sample. Here we describe smMIP, an assay that combines single molecule tagging with multiplex targeted capture to enable practical and highly sensitive detection of low-frequency or subclonal variation. To demonstrate the potential of the method, we simultaneously resequenced 33 clinically informative cancer genes in eight cell line and 45 clinical cancer samples. Single molecule tagging facilitated extremely accurate consensus calling, with an estimated per-base error rate of 8.4 × 10(-6) in cell lines and 2.6 × 10(-5) in clinical specimens. False-positive mutations in the single molecule consensus base-calls exhibited patterns predominantly consistent with DNA damage, including 8-oxo-guanine and spontaneous deamination of cytosine. Based on mixing experiments with cell line samples, sensitivity for mutations above 1% frequency was 83% with no false positives. At clinically informative sites, we identified seven low-frequency point mutations (0.2%-4.7%), including BRAF p.V600E (melanoma, 0.2% alternate allele frequency), KRAS p.G12V (lung, 0.6%), JAK2 p.V617F (melanoma, colon, two lung, 0.3%-1.4%), and NRAS p.Q61R (colon, 4.7%). We anticipate that smMIP will be broadly adoptable as a practical and effective method for accurately detecting low-frequency mutations in both research and clinical settings.
Figures
Figure 1.
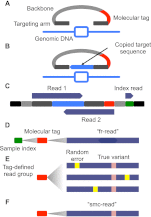
Schematic of smMIP method. (A) Molecular inversion probes (MIPs) consisting of two 16–24 nt “targeting arms” (dark gray) joined by a constant 28-nt “backbone” sequence (light gray) and a 12-nt degenerate “molecular tag” (red) were designed for the coding exons (light-blue rectangle) of 33 cancer-related genes. Targeting arms were complementary to sequences flanking individual regions of interest, each 112 nt in length. (B) Probes are pooled, hybridized to genomic DNA, and polymerase and ligase were added to “gap-fill” the reverse complement of the genomic DNA to which the probe is hybridized (light-blue) and ligate the probe into a single-stranded circle. (C) After exonuclease treatment and PCR, sequencing library molecules consist of platform compatibility (black), probe backbone (light gray), targeting arm (dark gray), copied target (light blue), molecular tag (red), and sample-specific index introduced during PCR (green). Massively parallel sequencing is used to collect three reads (dark blue). (D) Overlapping read-pairs are reconciled to form “fr-reads” (dark blue), assigned to samples via the sample-specific index sequence (green) and individual capture events via the molecular tag (red). (E) Groups of fr-reads assigned to the same probe via alignment to the reference genome and sharing the same molecular tag and sample index form a “tag-defined read group” (TDRG). Random errors (yellow) that occur during library construction and sequencing may be present in some members of the TDRG at some positions. (F) TDRGs are used to call a
s
ingle
m
olecule
c
onsensus sequence (“smc-read”) for the captured target sequence that is robust to such errors.
Figure 2.
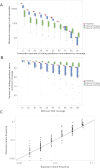
smMIP capture performance and detection of low-frequency variation. (A) Distributions of minimum coverage in a given percentile of total targeted coding positions, rank-ordered by smc-read coverage, for eight HapMap cell line (red) and 45 clinical cancer (blue and green) samples (box plot center line: median; top and bottom edges: quartiles; whiskers: farthest data point within 150% of interquartile range; dots: outliers). Zeroth-percentile indicates maximum coverage. (B) Distributions of fraction of coding positions above a given smc-read coverage cutoff. (C) Observed versus expected variant frequency in smc-read base-calls from mixtures of HapMap genomic DNA samples at known ratios for positions with at least 100× coverage (R = 0.94). Ideal performance is shown as gray line (y = x).
Figure 3.
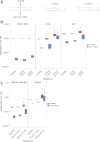
Substitution error rates as a function of expected and observed nucleotide during gap-fill. (A) Schematic illustrating mononucleotide and dinucleotide substitution dependencies being considered. All rates are shown for a given expected gap-fill mono- or dinucleotide, which is the complementary nucleotide(s) to the nucleotide(s) present in the target genomic DNA, considering only ≥Q41 fr-read base-calls and Q60 smc-read base-calls at putative homozygous positions based on GATK calls. (B) Distributions of substitution error rates for eight HapMap cell line and 45 clinical cancer samples, comparing fr-reads and smc-reads, and all substitutions other than C>A or G>A (W>N + N>B, left) to only C>A (middle), or G>A (right). (C) Distributions of substitution error rates comparing fr-reads and smc-reads, and all G>A substitutions occurring in the non-CG dinucleotide context (DG>DA + GN>AN, left) to G>A substitutions occurring only in the CG dinucleotide context (CG>CA, right).
Figure 4.
Sensitivity and false discovery rates for subclonal variation in synthetic mixtures. Sensitivity versus false discovery rate for low-frequency variants (0.1%–40%) in synthetically mixed HapMap samples for variant calls from fr-reads (red) and smc-reads (blue), for coding positions that were adequately genotyped in both unmixed HapMap samples and for which there was no substantial (binomial adjusted P < 10−10) subclonality in the predominant HapMap sample. Expected subclonal variant frequencies are listed at the top of each panel. Area beneath the curve is shown as an inset in each panel. Candidate subclonal variants occurring in coding sequence and at a frequency of at least 0.1% were prioritized using multiple testing-adjusted binomial _P_-values that were calculated from substitution error rates.
Similar articles
- Accurate detection of low-level mosaic mutations in pediatric acute lymphoblastic leukemia using single molecule tagging and deep-sequencing.
Yu J, Antić Ž, van Reijmersdal SV, Hoischen A, Sonneveld E, Waanders E, Kuiper RP. Yu J, et al. Leuk Lymphoma. 2018 Jul;59(7):1690-1699. doi: 10.1080/10428194.2017.1390232. Epub 2017 Oct 23. Leuk Lymphoma. 2018. PMID: 29058513 - Accurate Pan-Cancer Molecular Diagnosis of Microsatellite Instability by Single-Molecule Molecular Inversion Probe Capture and High-Throughput Sequencing.
Waalkes A, Smith N, Penewit K, Hempelmann J, Konnick EQ, Hause RJ, Pritchard CC, Salipante SJ. Waalkes A, et al. Clin Chem. 2018 Jun;64(6):950-958. doi: 10.1373/clinchem.2017.285981. Epub 2018 Apr 9. Clin Chem. 2018. PMID: 29632127 Free PMC article. - Identification of novel GNAS mutations in intramuscular myxoma using next-generation sequencing with single-molecule tagged molecular inversion probes.
Bekers EM, Eijkelenboom A, Rombout P, van Zwam P, Mol S, Ruijter E, Scheijen B, Flucke U. Bekers EM, et al. Diagn Pathol. 2019 Feb 8;14(1):15. doi: 10.1186/s13000-019-0787-3. Diagn Pathol. 2019. PMID: 30736805 Free PMC article. - Direct mutation analysis by high-throughput sequencing: from germline to low-abundant, somatic variants.
Gundry M, Vijg J. Gundry M, et al. Mutat Res. 2012 Jan 3;729(1-2):1-15. doi: 10.1016/j.mrfmmm.2011.10.001. Epub 2011 Oct 12. Mutat Res. 2012. PMID: 22016070 Free PMC article. Review. - Immunohistochemistry as a reliable method for detection of BRAF-V600E mutation in melanoma: a systematic review and meta-analysis of current published literature.
Anwar MA, Murad F, Dawson E, Abd Elmageed ZY, Tsumagari K, Kandil E. Anwar MA, et al. J Surg Res. 2016 Jun 15;203(2):407-15. doi: 10.1016/j.jss.2016.04.029. Epub 2016 Apr 23. J Surg Res. 2016. PMID: 27363650 Review.
Cited by
- IMPRESS: Improved methylation profiling using restriction enzymes and smMIP sequencing, combined with a new biomarker panel, creating a multi-cancer detection assay.
Vandenhoeck J, Neefs I, Vanpoucke T, Ibrahim J, Suls A, Peeters D, Schepers A, Hoischen A, Fransen E, Peeters M, Van Camp G, Op de Beeck K. Vandenhoeck J, et al. Br J Cancer. 2024 Oct;131(7):1224-1236. doi: 10.1038/s41416-024-02809-1. Epub 2024 Aug 24. Br J Cancer. 2024. PMID: 39181941 Free PMC article. - A Review of Probe-Based Enrichment Methods to Inform Plant Virus Diagnostics.
Farrall T, Brawner J, Dinsdale A, Kehoe M. Farrall T, et al. Int J Mol Sci. 2024 Jul 30;25(15):8348. doi: 10.3390/ijms25158348. Int J Mol Sci. 2024. PMID: 39125919 Free PMC article. Review. - A novel colorectal cancer test combining microsatellite instability and BRAF/RAS analysis: Clinical validation and impact on Lynch syndrome screening.
Gallon R, Herrero-Belmonte P, Phelps R, Hayes C, Sollars E, Egan D, Spiewak H, Nalty S, Mills S, Loo PS, Borthwick GM, Santibanez-Koref M, Burn J, McAnulty C, Jackson MS. Gallon R, et al. BJC Rep. 2024;2(1):48. doi: 10.1038/s44276-024-00072-8. Epub 2024 Jul 1. BJC Rep. 2024. PMID: 38962168 Free PMC article. - Development, validation and application of single molecule molecular inversion probe based novel integrated genetic screening method for 29 common lysosomal storage disorders in India.
Sheth H, Nair A, Bhavsar R, Kamate M, Gowda VK, Bavdekar A, Kadam S, Nampoothiri S, Panigrahi I, Kaur A, Shah S, Mehta S, Jagadeesan S, Suresh I, Kapoor S, Bajaj S, Devi RR, Prajapati A, Godbole K, Patel H, Luhar Z, Shah RC, Iyer A, Bijarnia S, Puri R, Muranjan M, Shah A, Magar S, Gupta N, Tayade N, Gandhi A, Sowani A, Kale S, Jalan A, Solanki D, Dalal A, Mane S, Prabha CR, Sheth F, Joshi CG, Joshi M, Sheth J. Sheth H, et al. Hum Genomics. 2024 May 10;18(1):46. doi: 10.1186/s40246-024-00613-9. Hum Genomics. 2024. PMID: 38730490 Free PMC article. - Measurable (Minimal) Residual Disease in Myelodysplastic Neoplasms (MDS): Current State and Perspectives.
Zhang L, Deeb G, Deeb KK, Vale C, Peker Barclift D, Papadantonakis N. Zhang L, et al. Cancers (Basel). 2024 Apr 15;16(8):1503. doi: 10.3390/cancers16081503. Cancers (Basel). 2024. PMID: 38672585 Free PMC article. Review.
References
- Bielas JH, Loeb LA 2005. Quantification of random genomic mutations. Nat Methods 2: 285–290 - PubMed
- De Roock W, Jonker DJ, Di Nicolantonio F, Sartore-Bianchi A, Tu D, Siena S, Lamba S, Arena S, Frattini M, Piessevaux H, et al. 2010. Association of KRAS p.G13D mutation with outcome in patients with chemotherapy-refractory metastatic colorectal cancer treated with cetuximab. JAMA 304: 1812–1820 - PubMed
Publication types
MeSH terms
Substances
Grants and funding
- RC2 HL102926/HL/NHLBI NIH HHS/United States
- CA160080/CA/NCI NIH HHS/United States
- HL-102926/HL/NHLBI NIH HHS/United States
- HL-102925/HL/NHLBI NIH HHS/United States
- RC2 HL102923/HL/NHLBI NIH HHS/United States
- UC2 HL102926/HL/NHLBI NIH HHS/United States
- UC2 HL103010/HL/NHLBI NIH HHS/United States
- HL-103010/HL/NHLBI NIH HHS/United States
- HL-102924/HL/NHLBI NIH HHS/United States
- F30 AG039173/AG/NIA NIH HHS/United States
- RC2 HL102924/HL/NHLBI NIH HHS/United States
- AG039173/AG/NIA NIH HHS/United States
- UC2 HL102923/HL/NHLBI NIH HHS/United States
- UC2 HL102924/HL/NHLBI NIH HHS/United States
- RC2 HL103010/HL/NHLBI NIH HHS/United States
- T32 GM007266/GM/NIGMS NIH HHS/United States
- HL-102923/HL/NHLBI NIH HHS/United States
- R21 CA160080/CA/NCI NIH HHS/United States
- RC2 HL102925/HL/NHLBI NIH HHS/United States
- UC2 HL102925/HL/NHLBI NIH HHS/United States
LinkOut - more resources
Full Text Sources
Other Literature Sources
Research Materials
Miscellaneous


