Endothelial cell-specific lymphotoxin-β receptor signaling is critical for lymph node and high endothelial venule formation - PubMed (original) (raw)
Endothelial cell-specific lymphotoxin-β receptor signaling is critical for lymph node and high endothelial venule formation
Lucas Onder et al. J Exp Med. 2013.
Abstract
The development of lymph nodes (LNs) and formation of LN stromal cell microenvironments is dependent on lymphotoxin-β receptor (LTβR) signaling. In particular, the LTβR-dependent crosstalk between mesenchymal lymphoid tissue organizer and hematopoietic lymphoid tissue inducer cells has been regarded as critical for these processes. Here, we assessed whether endothelial cell (EC)-restricted LTβR signaling impacts on LN development and the vascular LN microenvironment. Using EC-specific ablation of LTβR in mice, we found that conditionally LTβR-deficient animals failed to develop a significant proportion of their peripheral LNs. However, remnant LNs showed impaired formation of high endothelial venules (HEVs). Venules had lost their cuboidal shape, showed reduced segment length and branching points, and reduced adhesion molecule and constitutive chemokine expression. Due to the altered EC-lymphocyte interaction, homing of lymphocytes to peripheral LNs was significantly impaired. Thus, this study identifies ECs as an important LTβR-dependent lymphoid tissue organizer cell population and indicates that continuous triggering of the LTβR on LN ECs is critical for lymphocyte homeostasis.
Figures
Figure 1.
LTβR expression in LN endothelial and mesenchymal stromal cells. (a) CD45+ hematopoietic cell–depleted cell suspensions from pooled peripheral LNs were stained with anti-CD31 and anti-Pdpn and analyzed by flow cytometry. FACS-sorted stromal subpopulations were analyzed for expression of (b) Wnt1 and (c) Ltbr mRNA by real-time PCR (mean ± SEM from duplicate measurements; n = 4 independent samples analyzed in two independent experiments). (d) LTβR expression on different stromal cells as determined by flow cytometry (solid lines), dotted lines indicate isotype control staining of the respective population. (e) Mean fluorescence intensity (MFI) of LTβR expression on the indicated stromal cell populations (mean ± SEM; n = 4 mice, pooled from two independent experiments).
Figure 2.
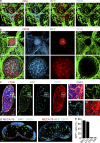
Targeting of LN endothelial cells in VE-cadherin-Cre mice. (a) Histological analysis of the inguinal LN anlage in VE-Cadherin-CrexR26-RFP embryos at E16.5. LN anlagen were stained in whole-mount with antibodies against RFP, CD31, and CD4. Bar, 20 µm. (b) Whole-mount histological analysis of the inguinal LN anlage in VE-cadherin-CrexR26-RFP embryos at E18.5 using the indicated antibodies. Top images show the overview of inguinal region with LN anlage embedded in the vasculature. Bar, 100 µm. Bottom shows magnification of boxed area in top image. Data show one representative analysis out of three. (c) LTβR expression in VE-Cadherin-CrexR26-RFP neonatal LNs. Sections were stained with antibodies against RFP, CD31, LTβR, and counterstained with DAPI. Boxed areas i–iv are annotated and shown in the right panels at higher magnification. Bars, 50 µm (20 µm for magnified insets). (d) Transgene expression in inguinal LNs of adult VE-Cadherin-CrexR26-RFP mice. Bar, 200 µm. Data show one representative analysis out of three. (e) Flow cytometric analysis of transgene expression (RFP) in CD45− LN stromal cells (mean ± SEM; n = 6 mice, pooled from two independent experiments).
Figure 3.
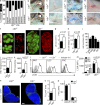
Ablation of LTβR signaling in ECs impacts peripheral LN development. (a) The presence of the indicated LNs was recorded in 4-wk-old VE-cadherin-CrexLtβrfl/fl mice and plotted as percent present/absent (n = 10 mice). Mice were injected with 1% Chicago sky blue 1 wk before the analysis. Microphotographs show presence or absence of (b) axillary (white arrow head) and brachial (black arrow head), (c) inguinal, or (d) mesenteric LNs in the indicated mouse strains. Representative microphotographs from one out of four mice per group. (e) Macroscopic appearance of developing inguinal LNs in VE-cadherin-CrexLtβrfl/fl mice (top image) and LTβR-proficient controls (bottom image). (f) Inguinal LNs from the indicated strains were analyzed by OPT for the presence of the HEV network (MECA-79+) and B cell follicles (B220+). Bar, 500 µm. Quantitative analysis based on OPT data for LN volume (g) and B cell follicle volume (h). (i) Flow cytometry–based quantification of LN cellularity. Values indicate relative cell numbers in VE-cadherin-CrexLtβrfl/fl mice compared with Ltβr+/+ mice (mean ± SEM; n = 6 mice per group in 3 independent experiments). Quantitative analysis based on OPT data for (j) HEV network length and (k) HEV branching points (mean ± SEM; n = 6 mice per group pooled from three independent experiments). (l) Representative histograms showing flow cytometric analysis of LTβR expression on CD31+Pdpn+ LECs, CD31+Pdpn− BECs, and CD31−Pdpn+ FRCs of VE-cadherin-CrexLtβrfl/fl and Ltβr+/+ LNs. (m) Quantification of MFI for LTβR expression in respective populations (mean ± SEM from six mice per group, pooled from two independent experiments). (n) Lymphatic sinus formation in inguinal LNs from the indicated mouse strains as determined by confocal microscopy using staining with anti-LyveI. Bar, 200 µm. (o) Quantification of LyveI+ area in inguinal LNs from VE-cadherin-CrexLtβrfl/fl and Ltβr+/+ mice (three sections per LN, values indicate mean ± SEM from six mice pooled from two independent experiments). (p) Accumulation of 40-kD FITC-dextran in draining LNs at 10 min after s.c. injection into the hind footpad. FITC fluorescence intensity on histological sections of popliteal and inguinal LN was quantified by confocal microscopy (three sections per LN, values indicate mean ± SEM from four mice pooled from two independent experiments).
Figure 4.
Impact of EC-specific LTβR deficiency on the MECA-79+ LN endothelium. (a) LN sections were stained with fluorescently labeled antibodies against ICAM-1, MECA-79, and ERTR-7 and analyzed by confocal microscopy. Bar, 10 µm. Arrowheads indicate presence of ERTR-7+ perivascular stroma, and arrow indicates decreased endothelial ICAM-1 expression. Data show one representative analysis out of five mice. (b) Flow cytometric determination of ICAM-1 expression (MFI) on CD31+Pdpn− BECs in peripheral LNs from VE-cadherin-Cre_x_Ltβrfl/fl mice and Ltβr+/+ mice (mean ± SEM from four mice per group, pooled from two independent experiments). (c) Confocal microscopic analysis of inguinal LN sections stained with fluorescently labeled antibodies against CCL21 and MECA-79, confocal sections (2D) with orthogonal display of the z-stack dimension at indicated x/y coordinates. Arrows indicate presence or absence of CCL21 expression on MECA-79+ vascular structures in z dimension. 3D reconstruction of z stacks are shown in right panel, stars indicate CCL21+MECA-79+ HEVs. Bar, 30 µm. Data show one representative analysis out of three. Quantitative RT-PCR analysis of Ccl19 and Ccl21 (d) and Glycam1 and Mfge8 (e) expression in inguinal LNs from VE-cadherin-CrexLtβrfl/fl and Ltβr+/+ mice (mean ± SEM of duplicate measurements from four mice per group, pooled from two independent experiments).
Figure 5.
LTβR signaling in ECs is required for lymphocyte homeostasis. C57BL/6 splenocytes were labeled with CFSE and adoptively transferred into VE-cadherin-CrexLtβrfl/fl mice and Ltβr+/+ mice. (a) Popliteal LN sections of indicated recipients were stained with fluorescently labeled antibodies against CD31, CD4, and CFSE and analyzed by confocal microscopy. Bar, 100 µm. (right) Higher magnification images of the boxed areas in the images on the left. Bar, 50 µm. Data show one representative analysis out of four. (b) Flow cytometric analysis of transferred cells (CFSE+) lymphocytes in VE-cadherin-CrexLtβrfl/fl and Ltβr+/+inguinal LNs. Left panel shows absolute numbers and right panel shows percentage of CFSE+ cells in the respective population (mean ± SEM from 4 mice pooled from two independent experiments). (c) High-resolution analysis of CFSE+ lymphocytes in (arrow) and around (arrowhead) CD31+ vascular endothelia in LNs of VE-cadherin-CrexLtβrfl/fl and Ltβr+/+ recipients. Bar, 10 µm. (d) Confocal microscopic analysis of intraendothelial pocket formation (arrow) in LNs of VE-cadherin-CrexLtβrfl/fl and Ltβr+/+ recipients. Bar, 10 µm. (e) Lymphocyte motility in the T cell zone and around HEV in popliteal LNs of VE-cadherin-CrexLtβrfl/fl and Ltβr+/+ mice as determined by intravital two-photon microscopy. Values represent single tracks pooled from two independent experiments (n = 4 mice per group, mean indicated by horizontal bar).
Similar articles
- Differential Roles of LTβR in Endothelial Cell Subsets for Lymph Node Organogenesis and Maturation.
Wang Z, Chai Q, Zhu M. Wang Z, et al. J Immunol. 2018 Jul 1;201(1):69-76. doi: 10.4049/jimmunol.1701080. Epub 2018 May 14. J Immunol. 2018. PMID: 29760194 - Antigen-dependent rescue of nose-associated lymphoid tissue (NALT) development independent of LTbetaR and CXCR5 signaling.
Krege J, Seth S, Hardtke S, Davalos-Misslitz AC, Förster R. Krege J, et al. Eur J Immunol. 2009 Oct;39(10):2765-78. doi: 10.1002/eji.200939422. Eur J Immunol. 2009. PMID: 19757439 - Single-Cell Analysis Reveals Heterogeneity of High Endothelial Venules and Different Regulation of Genes Controlling Lymphocyte Entry to Lymph Nodes.
Veerman K, Tardiveau C, Martins F, Coudert J, Girard JP. Veerman K, et al. Cell Rep. 2019 Mar 12;26(11):3116-3131.e5. doi: 10.1016/j.celrep.2019.02.042. Cell Rep. 2019. PMID: 30865898 - Understanding high endothelial venules: Lessons for cancer immunology.
Ager A, May MJ. Ager A, et al. Oncoimmunology. 2015 May 7;4(6):e1008791. doi: 10.1080/2162402X.2015.1008791. eCollection 2015 Jun. Oncoimmunology. 2015. PMID: 26155419 Free PMC article. Review. - Angiogenesis in Lymph Nodes Is a Critical Regulator of Immune Response and Lymphoma Growth.
Menzel L, Höpken UE, Rehm A. Menzel L, et al. Front Immunol. 2020 Dec 3;11:591741. doi: 10.3389/fimmu.2020.591741. eCollection 2020. Front Immunol. 2020. PMID: 33343570 Free PMC article. Review.
Cited by
- Tertiary lymphoid structures in autoimmune diseases.
Dong Y, Wang T, Wu H. Dong Y, et al. Front Immunol. 2024 Jan 8;14:1322035. doi: 10.3389/fimmu.2023.1322035. eCollection 2023. Front Immunol. 2024. PMID: 38259436 Free PMC article. Review. - Stromal Cells Underlining the Paths From Autoimmunity, Inflammation to Cancer With Roles Beyond Structural and Nutritional Support.
Honan AM, Chen Z. Honan AM, et al. Front Cell Dev Biol. 2021 May 25;9:658984. doi: 10.3389/fcell.2021.658984. eCollection 2021. Front Cell Dev Biol. 2021. PMID: 34113615 Free PMC article. Review. - Effector lymphocyte-induced lymph node-like vasculature enables naive T-cell entry into tumours and enhanced anti-tumour immunity.
Peske JD, Thompson ED, Gemta L, Baylis RA, Fu YX, Engelhard VH. Peske JD, et al. Nat Commun. 2015 May 13;6:7114. doi: 10.1038/ncomms8114. Nat Commun. 2015. PMID: 25968334 Free PMC article. - Selective expression of claudin-5 in thymic endothelial cells regulates the blood-thymus barrier and T-cell export.
Nagatake T, Zhao YC, Ito T, Itoh M, Kometani K, Furuse M, Saika A, Node E, Kunisawa J, Minato N, Hamazaki Y. Nagatake T, et al. Int Immunol. 2021 Mar 1;33(3):171-182. doi: 10.1093/intimm/dxaa069. Int Immunol. 2021. PMID: 33038259 Free PMC article. - Intestinal fibroblastic reticular cell niches control innate lymphoid cell homeostasis and function.
Cheng HW, Mörbe U, Lütge M, Engetschwiler C, Onder L, Novkovic M, Gil-Cruz C, Perez-Shibayama C, Hehlgans T, Scandella E, Ludewig B. Cheng HW, et al. Nat Commun. 2022 Apr 19;13(1):2027. doi: 10.1038/s41467-022-29734-2. Nat Commun. 2022. PMID: 35440118 Free PMC article.
References
- Braun A., Worbs T., Moschovakis G.L., Halle S., Hoffmann K., Bölter J., Münk A., Förster R. 2011. Afferent lymph-derived T cells and DCs use different chemokine receptor CCR7-dependent routes for entry into the lymph node and intranodal migration. Nat. Immunol. 12:879–887 10.1038/ni.2085 - DOI - PubMed
- Browning J.L., French L.E. 2002. Visualization of lymphotoxin-beta and lymphotoxin-beta receptor expression in mouse embryos. J. Immunol. 168:5079–5087 - PubMed
Publication types
MeSH terms
Substances
LinkOut - more resources
Full Text Sources
Other Literature Sources
Molecular Biology Databases


