New insights into DNA recognition by zinc fingers revealed by structural analysis of the oncoprotein ZNF217 - PubMed (original) (raw)
New insights into DNA recognition by zinc fingers revealed by structural analysis of the oncoprotein ZNF217
Marylène Vandevenne et al. J Biol Chem. 2013.
Abstract
Classical zinc fingers (ZFs) are one of the most abundant and best characterized DNA-binding domains. Typically, tandem arrays of three or more ZFs bind DNA target sequences with high affinity and specificity, and the mode of DNA recognition is sufficiently well understood that tailor-made ZF-based DNA-binding proteins can be engineered. We have shown previously that a two-zinc finger unit found in the transcriptional coregulator ZNF217 recognizes DNA but with an affinity and specificity that is lower than other ZF arrays. To investigate the basis for these differences, we determined the structure of a ZNF217-DNA complex. We show that although the overall position of the ZFs on the DNA closely resembles that observed for other ZFs, the side-chain interaction pattern differs substantially from the canonical model. The structure also reveals the presence of two methyl-π interactions, each featuring a tyrosine contacting a thymine methyl group. To our knowledge, interactions of this type have not previously been described in classical ZF-DNA complexes. Finally, we investigated the sequence specificity of this two-ZF unit and discuss how ZNF217 might discriminate its target DNA sites in the cell.
Figures
FIGURE 1.
Sequence-specific base contacts in classical ZNF-DNA complexes. A, the canonical model derived from consideration of the known ZF-DNA structures. B, ZNF217_F67 (Protein Data Bank (PDB) ID: 4IS1, this work). C, TRAMTRACK (PDB ID: 2DRP) (18). D, Zif268 (PDB ID: 1AAY) (15). In the canonical model, the sequence-specific contacts are made from side chains located at key positions −1, +2, +3 and +6 along the α-helix. Base-specific protein-DNA interactions are represented by black arrows.
FIGURE 2.
Structure of ZNF217_F67 in complex with a 20-bp oligonucleotide obtained from the C2 crystal form. A, ribbon diagram of the two DNA-bound protein molecules. The PDB code for the structure is 4IS1. B and C, structural alignment of ZNF217_F67 (magenta) and zinc fingers 2 and 3 from the Zif268-DNA complex (cyan) complexed to DNA (PDB 1AAY (75)). The alignment was made over all heavy atoms. Two views are shown.
FIGURE 3.
Protein-DNA interactions mediated by ZNF217_F67. A and B, phosphate backbone contacts and sequence-specific interactions observed between the protein and the DNA for finger 6 (A) and for finger 7 (B) are represented by black dashed lines.
FIGURE 4.
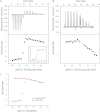
A and B, ITC data for the titration of ZNF217_F67 into specific (A) and nonspecific (B) DNA sequences. The upper panels represent the difference in heat release/uptake between the sample and the reference cell containing water. The lower panels correspond to the integrated enthalpy changes per mole of injected protein. The fit of the tight binding event observed for the specific DNA titration is detailed under “Experimental Procedures” and displayed in the inset (following subtraction of the nonspecific binding component). The experiment was conducted in 10 m
m
Tris buffer, pH 7.0, 50 m
m
NaCl, and 1 m
m
tris(2-carboxyethyl)phosphine at 25 °C. C, overlay of the integrated enthalpy changes calculated for the specific (black) and nonspecific (red) DNA titrations.
FIGURE 5.
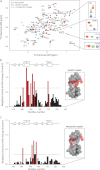
Chemical shift titration data for specific and nonspecific ZNF217_F67-DNA complexes. A, overlay of 15N HSQC spectra of the unbound protein (red) and bound to the specific (blue) or nonspecific DNA sequences (green). Assignments for the unbound protein are indicated (Nsc indicates assignments corresponding to asparagine side chain amide groups). B and C, weighted average chemical shift changes for backbone nuclei of ZNF217_F67 following the addition of specific (B) and nonspecific (C) DNA sequences. Chemical shift changes less than one standard deviation above the mean are shown in black, and those that are larger than one standard deviation are represented in red. The horizontal dashed line indicates one standard deviation above the mean of the chemical shift changes of all protein residues. Residues undergoing significant chemical shift changes in both complexes were also mapped onto the ZNF217 structure as displayed in the insets.
FIGURE 6.
Amino acid sequence alignment of human ZNF217_F67. The sequence alignment shows the conservation of the two tyrosine residues (gray boxes) involved in the methyl-π interactions with DNA. The interspecies sequence alignment of ZNF217 shows an extremely good conservation of the entire F67 domain across different species.
Similar articles
- Structural metal sites in nonclassical zinc finger proteins involved in transcriptional and translational regulation.
Lee SJ, Michel SL. Lee SJ, et al. Acc Chem Res. 2014 Aug 19;47(8):2643-50. doi: 10.1021/ar500182d. Epub 2014 Aug 6. Acc Chem Res. 2014. PMID: 25098749 - The multi-zinc finger protein ZNF217 contacts DNA through a two-finger domain.
Nunez N, Clifton MMK, Funnell APW, Artuz C, Hallal S, Quinlan KGR, Font J, Vandevenne M, Setiyaputra S, Pearson RCM, Mackay JP, Crossley M. Nunez N, et al. J Biol Chem. 2011 Nov 4;286(44):38190-38201. doi: 10.1074/jbc.M111.301234. Epub 2011 Sep 11. J Biol Chem. 2011. PMID: 21908891 Free PMC article. - Specific recognition of ZNF217 and other zinc finger proteins at a surface groove of C-terminal binding proteins.
Quinlan KG, Nardini M, Verger A, Francescato P, Yaswen P, Corda D, Bolognesi M, Crossley M. Quinlan KG, et al. Mol Cell Biol. 2006 Nov;26(21):8159-72. doi: 10.1128/MCB.00680-06. Epub 2006 Aug 28. Mol Cell Biol. 2006. PMID: 16940172 Free PMC article. - Updated understanding of the protein-DNA recognition code used by C2H2 zinc finger proteins.
Zhang X, Blumenthal RM, Cheng X. Zhang X, et al. Curr Opin Struct Biol. 2024 Aug;87:102836. doi: 10.1016/j.sbi.2024.102836. Epub 2024 May 15. Curr Opin Struct Biol. 2024. PMID: 38754172 Review. - Amplification of zinc finger gene 217 (ZNF217) and cancer: when good fingers go bad.
Quinlan KG, Verger A, Yaswen P, Crossley M. Quinlan KG, et al. Biochim Biophys Acta. 2007 Jun;1775(2):333-40. doi: 10.1016/j.bbcan.2007.05.001. Epub 2007 May 22. Biochim Biophys Acta. 2007. PMID: 17572303 Review.
Cited by
- DNA recognition of 5-carboxylcytosine by a Zfp57 mutant at an atomic resolution of 0.97 Å.
Liu Y, Olanrewaju YO, Zhang X, Cheng X. Liu Y, et al. Biochemistry. 2013 Dec 23;52(51):9310-7. doi: 10.1021/bi401360n. Epub 2013 Nov 20. Biochemistry. 2013. PMID: 24236546 Free PMC article. - Promiscuous DNA-binding of a mutant zinc finger protein corrupts the transcriptome and diminishes cell viability.
Gillinder KR, Ilsley MD, Nébor D, Sachidanandam R, Lajoie M, Magor GW, Tallack MR, Bailey T, Landsberg MJ, Mackay JP, Parker MW, Miles LA, Graber JH, Peters LL, Bieker JJ, Perkins AC. Gillinder KR, et al. Nucleic Acids Res. 2017 Feb 17;45(3):1130-1143. doi: 10.1093/nar/gkw1014. Nucleic Acids Res. 2017. PMID: 28180284 Free PMC article. - The zinc fingers of YY1 bind single-stranded RNA with low sequence specificity.
Wai DC, Shihab M, Low JK, Mackay JP. Wai DC, et al. Nucleic Acids Res. 2016 Nov 2;44(19):9153-9165. doi: 10.1093/nar/gkw590. Epub 2016 Jul 1. Nucleic Acids Res. 2016. PMID: 27369384 Free PMC article. - Improving selectivity of DNA-RNA binding zinc finger using directed evolution.
Sulej AA. Sulej AA. BMC Res Notes. 2019 Dec 4;12(1):792. doi: 10.1186/s13104-019-4833-8. BMC Res Notes. 2019. PMID: 31801592 Free PMC article. - NMR-based investigations into target DNA search processes of proteins.
Iwahara J, Zandarashvili L, Kemme CA, Esadze A. Iwahara J, et al. Methods. 2018 Sep 15;148:57-66. doi: 10.1016/j.ymeth.2018.05.004. Epub 2018 May 10. Methods. 2018. PMID: 29753002 Free PMC article. Review.
References
- Klug A., Schwabe J. W. (1995) Protein motifs 5. Zinc fingers. FASEB J. 9, 597–604 - PubMed
- Mackay J. P., Crossley M. (1998) Zinc fingers are sticking together. Trends Biochem. Sci. 23, 1–4 - PubMed
- Sánchez-García I., Rabbitts T. H. (1994) The LIM domain: a new structural motif found in zinc-finger-like proteins. Trends Genet. 10, 315–320 - PubMed
Publication types
MeSH terms
Substances
LinkOut - more resources
Full Text Sources
Other Literature Sources
Research Materials
Miscellaneous


