A kinome-wide RNAi screen in Drosophila Glia reveals that the RIO kinases mediate cell proliferation and survival through TORC2-Akt signaling in glioblastoma - PubMed (original) (raw)
doi: 10.1371/journal.pgen.1003253. Epub 2013 Feb 14.
Tim R Fenton, German G Gomez, Jill Wykosky, Scott R Vandenberg, Ivan Babic, Akio Iwanami, Huijun Yang, Webster K Cavenee, Paul S Mischel, Frank B Furnari, John B Thomas
Affiliations
- PMID: 23459592
- PMCID: PMC3573097
- DOI: 10.1371/journal.pgen.1003253
A kinome-wide RNAi screen in Drosophila Glia reveals that the RIO kinases mediate cell proliferation and survival through TORC2-Akt signaling in glioblastoma
Renee D Read et al. PLoS Genet. 2013.
Abstract
Glioblastoma, the most common primary malignant brain tumor, is incurable with current therapies. Genetic and molecular analyses demonstrate that glioblastomas frequently display mutations that activate receptor tyrosine kinase (RTK) and Pi-3 kinase (PI3K) signaling pathways. In Drosophila melanogaster, activation of RTK and PI3K pathways in glial progenitor cells creates malignant neoplastic glial tumors that display many features of human glioblastoma. In both human and Drosophila, activation of the RTK and PI3K pathways stimulates Akt signaling along with other as-yet-unknown changes that drive oncogenesis. We used this Drosophila glioblastoma model to perform a kinome-wide genetic screen for new genes required for RTK- and PI3K-dependent neoplastic transformation. Human orthologs of novel kinases uncovered by these screens were functionally assessed in mammalian glioblastoma models and human tumors. Our results revealed that the atypical kinases RIOK1 and RIOK2 are overexpressed in glioblastoma cells in an Akt-dependent manner. Moreover, we found that overexpressed RIOK2 formed a complex with RIOK1, mTor, and mTor-complex-2 components, and that overexpressed RIOK2 upregulated Akt signaling and promoted tumorigenesis in murine astrocytes. Conversely, reduced expression of RIOK1 or RIOK2 disrupted Akt signaling and caused cell cycle exit, apoptosis, and chemosensitivity in glioblastoma cells by inducing p53 activity through the RpL11-dependent ribosomal stress checkpoint. These results imply that, in glioblastoma cells, constitutive Akt signaling drives RIO kinase overexpression, which creates a feedforward loop that promotes and maintains oncogenic Akt activity through stimulation of mTor signaling. Further study of the RIO kinases as well as other kinases identified in our Drosophila screen may reveal new insights into defects underlying glioblastoma and related cancers and may reveal new therapeutic opportunities for these cancers.
Conflict of interest statement
The authors have declared that no competing interests exist.
Figures
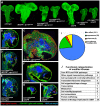
Figure 1. A kinome-wide screen for modifiers of EGFR- and PI3K-dependent glial neoplasia.
(A) Optical projections of whole brain-nerve cord complexes from late 3rd instar larvae approximately 130 hrs old, displayed at the same scale. Dorsal view; anterior up. GFP labels glia (green). Each brain is composed of 2 hemispheres and a nerve cord. Knockdown of strong suppressor loci decreased brain size, even relative to wild-type controls, as in CG11859dsRNA;dEGFRλ;dp110CAAX and CG11660dsRNA;dEGFRλ;dp110CAAX animals. Glial-specific overexpression of ΔEGFR drives increased glial cell numbers, brain enlargement, and lethality, and knockdown of strong suppressor loci grossly decreased brain size relative to controls, as in _CG11859dsRNA;Δ_EGFR and _CG11660dsRNA;Δ_EGFR animals. (B–H) 3 µm optical projections of brain hemispheres from late 3rd instar larvae approximately 130 hrs old, displayed at the same scale. Frontal sections, midway through brains. Anterior up; midline to left. Glial cell nuclei labeled with Repo (red); glial cell bodies labeled with GFP (green). Brains counter-stained with anti-HRP (blue), which reveals neuropil at high intensity and neuronal cell bodies at low intensity. Dark areas contain unstained neuronal precursor cells. dEGFRλ;dp110CAAX (C) and ΔEGFR (F) brains showed a dramatic increase in glial cell number (red nuclei, green) relative to wild-type (B). Upon suppression, as in CG11859dsRNA;dEGFRλ;dp110CAAX (D), _CG11859dsRNA;Δ_EGFR (G), and _CG11660dsRNA;Δ_EGFR (H), there are few excess glia (red nuclei), and remaining glial cells show abnormal development (green). Reduction in both glial (green) and neuronal cell types (low intensity blue) account for reduced brain size upon CG11660 and CG11859 knockdown in the context of dEGFRλ;dp110CAAX or ΔEGFR, which suggests that remaining abnormal glia do not properly support neuronal cell survival. Modifier constructs were also tested for effects in wild-type glia, as in CG11859dsRNA animals (E). (I) Breakdown of screen results by kinases tested. Unconfirmed modifiers are defined by only one RNAi construct each. (J) Functional classifications of confirmed modifiers. Individual kinases noted in Table S6.
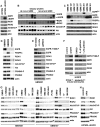
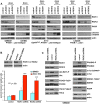
Figure 2. Expression of RIO kinases is associated with EGFR and Akt activity in GBM cells.
(A) U87MG and U87MG-ΔEGFR cells cultured with .1% serum for 36 hrs to enrich ΔEGFR signaling. ΔEGFR runs below full-length EGFR. (B) Biopsies of new (de novo) and recurrent GBMs. RIOK1 (∼75 kDa) and RIOK2 (∼63 kDa) antibodies used serially on the same blot. Serine-473 phosphorylation is a proxy for Akt activation. (C) Primary neurosphere GBM cultures. GBM39 is isolated from a ΔEGFR-positive serial xenograft . Others are low-passage cultures established from fresh tumors; expression of ΔEGFR, EGFR, or PDFGRα derives from parent tumors . EGFRhw is a high molecular weight (>200 kDa) mutant version detected in GBM 281. (D) RIOK expression and Akt signaling in neurospheres compared with a fresh culture of mixed human glia and astrocytes (established from normal adult cortex) grown under the same conditions. (E) GBM301 treated for 24 hrs with growth factor withdrawl (.1% GFs, .1% of the normal growth factor dosage) or 5 µM gefitinib. GBM301 cells are ΔEGFR-positive, EGFR-amplified, and PTEN-negative (see C). (F) Extracts from PTEN−/−; Ink4a/arf−/− astrocytes transduced with empty vector (left) or ΔEGFR (right), or grown with .5% serum and treated with gefitinib for 24 hrs (far right). EGFR inhibition evidenced by reduced Tyrosine-1068 phosphorylation. (G) Neurosphere cultures treated for 24 hours with DMSO or indicated inhibitors. P110 inhibitors: 50 µM LY294002, 1 µM BEZ-235, 2 µM GDC-0941 , 2 µM PI-103 . Akt inhibitors: 1 µM A443654, 10 µM Akt inhibitor IV , and 8 µM MK-2206 . Inhibition of PI3K-Akt signaling evidenced by reduced phosphorylation of PRAS40, a direct Akt substrate, and reduced Akt and/or PRAS40 protein levels. With A443654, increased Akt-Ser473 phosphorylation occurs despite Akt inhibition ; decreased Akt-Ser473 phosphorylation occurs with Akt inhibitor IV and MK-2206 . (H) U87MG-ΔEGFR cells treated with pan-Akt siRNAs compared to cells treated with nontargeting control siRNAs, harvested 72 hours post-transfection.
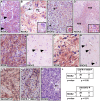
Figure 3. RIOK2 overexpression in GBM tumors is associated with Akt signaling.
(A–E) Immunohistochemistry for RIOK2 (reddish brown) showing cytoplasmic and submembraneous enrichment for RIOK2 in tumor cells. Hematoxilin counterstain, (A) GBM39 tissue, from a subcutanteous xenograft, showing RIOK2 staining in tumor cells (arrows), which formed lobules delineated by RIOK2-negative host stromal cells. (B) ΔEGFR-positive human GBM with RIOK2-positive giant cell component (inset shows a conspicuous giant cell), and RIOK2-negative tumor stroma composed of abnormal blood vessels (“BV”). (C) ΔEGFR-positive human GBM, abnormal mitotic cells with high RIOK2 staining denoted with asterisks and shown in inset close-up. (D) ΔEGFR-positive human GBM, lower magnification to highlight enriched RIOK2 in pseudopallisades (“PSS”), inset shows enriched RIOK2 staining present in dense cellular regions of pseudopallisades. (E) RIOK2 expression in an EGFR-overexpressing human GBM with (F) matched normal control tissue from the same surgical specimen, arrows denote normal astrocytes (recognized by their open nuclei). (G) RIOK2 expression in an EGFR-negative/Akt-S473-P-positive GBM shown alongside (H) another example of normal control brain tissue. Arrows denote normal neuronal cells (recognized by their basophilic cell bodies) with low/undetectable RIOK2 expression. (I) and (J) examples of Akt-S473-P and EGFR-Y1068-P immunoreactivity in RIOK2-positive GBM tumor specimens. (K) a RIOK2- negative GBM with a negative abnormal blood vessel (“BV”). (L) Statistical analysis of RIOK2-positive and negative tumor specimens showing a significant correlation between RIOK2 expression and phosphorylation of EGFR at Tyrosine-1068 and phosphorylation of Akt at Serine-473. More stains from tumors shown in Figures S10 and S11.
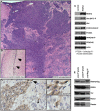
Figure 4. Overexpression of RIOK2 in murine astrocytes promotes tumorigenesis and TORC2-Akt signaling.
(A) H&E stain showing high-grade glioma derived from RIOK2overexpression; Pten−/−; Ink4a/arf−/− astrocytes grafted into the mouse brain. Tumor cells (purple) generate masses composed of spindle-shaped cells as well as infiltrative neoplastic cells that show invasion into the parenchyma and along blood vessels, animals sacrificed ∼19 days following injection. (B) representative needle tract (arrows) in a mouse brain grafted with control Pten−/−; Ink4a/arf−/− astrocytes engineered with empty vector; note the slight concentration of astrocytic cells along the needle tract but no tumor mass or infiltrates. (C) Western blots of RIOK2overexpression; Pten−/−; Ink4a/arf−/− astrocytes compared to Pten−/−; Ink4a/arf−/− astrocytes with empty vector, grown in vitro. (D) Immunoreactivity for Akt phosphorylated at Serine-473 (reddish brown) in a tumor derived from RIOK2overexpression; Pten−/−; Ink4a/arf−/− astrocytes, tumor margin shown, with many surrounding normal cells (purple nuclei, faint staining). Arrow indicates strong staining in invasive cells at tumor margin, asterisk indicates more distant individual invasive cells; both shown in close-up (right). (E) Epitope tagged RIOK2 (RIOK2-flag, runs slightly larger than endogenous untagged RIOK2) was overexpressed in 293T cells and immunoprecipitated along with associated proteins. Blots were probed for indicated proteins, whole lysates from both before (pre-IP) and after (post-IP) are included as a control for protein expression.
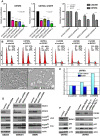
Figure 5. RIOKs drive proliferation and survival of GBM cells in a p53-dependent manner.
Figure 6. Loss of RIOK1 or RIOK2 function chemosensitizes GBM cells and reduces TORC2-Akt signaling.
(A) Knockdown of RIOK1 or RIOK2 sensitizes GBM cells to apoptosis in response to treatment with doxorubicin (doxo) and temozolomide (tmz), as evidenced by blots for active caspase-3 and PARP cleavage (A). All samples blotted for RIOK1 and RIOK2 to confirm changes in RIOK1 levels with RIOK2 knockdown, evident in p53-wild-type GBM cell lines. The RIOKs also decline with doxorubicin treatment. GBM301 cells were treated for 24 hrs with 1 µg/mL doxorubicin beginning 96 hrs post infection with viral vectors. U87MG, A172, and LNZ308 cells were treated for 24 hrs with 1 µg/mL doxorubicin and 100 µM temozolomide beginning 72 hrs post transfection with siRNAs. (B) FACS-based quantification of chemosensitivity. 96 hours post shRNA infection, U87MG samples were split in half and treated for 12 hours with either DMSO (light blue) or 1 µg/mL doxorubicin and 100 µM temozolomide (red). Live cells were collected and stained for 7AAD and Annexin-V. Data is represented as the percentage of Annexin V-positive 7AAD-negative cells in each sample, averaged over 2 experiments. P-values refer to student's two-tailed t-test used to compare doxorubicin and temozolomide-treated control to RIOK-shRNA cells. Validation of knockdown shown. FACS plots and raw data shown in Figure S15. (C) GBM301 cells treated with 25 µM ZVAD for 48 hrs beginning 3 days post-infection with viral vectors. Reduced phosphorylation of Akt on the TORC2 target site, Serine-473, is visible relative to total Akt protein. Reduced phosphorylation of several Akt targets, such as the FOXO3 transcription factor, is clear when phospho-epitope signal is compared to total protein controls. PARP cleavage is a read-out for apoptosis; PARP cleavage fragment in RIOK2 knockdown cells indicates residual caspase activity, due to the strong effect of RIOK2 loss. p53 upregulation was evident in GBM301 cells in the absence of residual caspase activity.
Figure 7. RIOK1 and RIOK2 are required for EGFR- and PI3K-mediated tumorigenesis.
Pathway diagram placing RIOK1 and RIOK2 in relation to Akt downstream of EGFR and PI3K signaling in GBM. RIOK2 mediates signaling both upstream and downstream of Akt via stimulation of TORC2 (left). Loss of RIOK1 or RIOK2 reduces Akt signaling downstream of oncogenic EGFR and PI3K signaling, and induces the p53-dependent ribosomal stress checkpoint via RpL11 (right).
Similar articles
- Drak/STK17A Drives Neoplastic Glial Proliferation through Modulation of MRLC Signaling.
Chen AS, Wardwell-Ozgo J, Shah NN, Wright D, Appin CL, Vigneswaran K, Brat DJ, Kornblum HI, Read RD. Chen AS, et al. Cancer Res. 2019 Mar 15;79(6):1085-1097. doi: 10.1158/0008-5472.CAN-18-0482. Epub 2018 Dec 10. Cancer Res. 2019. PMID: 30530503 Free PMC article. - Heat Stress-Induced PI3K/mTORC2-Dependent AKT Signaling Is a Central Mediator of Hepatocellular Carcinoma Survival to Thermal Ablation Induced Heat Stress.
Thompson SM, Callstrom MR, Jondal DE, Butters KA, Knudsen BE, Anderson JL, Lien KR, Sutor SL, Lee JS, Thorgeirsson SS, Grande JP, Roberts LR, Woodrum DA. Thompson SM, et al. PLoS One. 2016 Sep 9;11(9):e0162634. doi: 10.1371/journal.pone.0162634. eCollection 2016. PLoS One. 2016. PMID: 27611696 Free PMC article. - Anticancer effects of veratramine via the phosphatidylinositol-3-kinase/serine-threonine kinase/mechanistic target of rapamycin and its downstream signaling pathways in human glioblastoma cell lines.
Kim D, Kwon W, Park S, Kim W, Park JK, Han JE, Cho GJ, Yun S, Han SH, Kim MO, Ryoo ZY, Choi SK. Kim D, et al. Life Sci. 2022 Jan 1;288:120170. doi: 10.1016/j.lfs.2021.120170. Epub 2021 Nov 23. Life Sci. 2022. PMID: 34826438 - Role of mTOR in glioblastoma.
Duzgun Z, Eroglu Z, Biray Avci C. Duzgun Z, et al. Gene. 2016 Jan 10;575(2 Pt 1):187-90. doi: 10.1016/j.gene.2015.08.060. Epub 2015 Sep 1. Gene. 2016. PMID: 26341051 Review. - Discrete signaling mechanisms of mTORC1 and mTORC2: Connected yet apart in cellular and molecular aspects.
Jhanwar-Uniyal M, Amin AG, Cooper JB, Das K, Schmidt MH, Murali R. Jhanwar-Uniyal M, et al. Adv Biol Regul. 2017 May;64:39-48. doi: 10.1016/j.jbior.2016.12.001. Epub 2017 Jan 4. Adv Biol Regul. 2017. PMID: 28189457 Review.
Cited by
- RIO-kinase 2 is essential for hematopoiesis.
Messling JE, Peña-Rømer I, Moroni AS, Bruestl S, Helin K. Messling JE, et al. PLoS One. 2024 Apr 2;19(4):e0300623. doi: 10.1371/journal.pone.0300623. eCollection 2024. PLoS One. 2024. PMID: 38564577 Free PMC article. - Pathways controlling neurotoxicity and proteostasis in mitochondrial complex I deficiency.
Nithianandam V, Sarkar S, Feany MB. Nithianandam V, et al. Hum Mol Genet. 2024 May 4;33(10):860-871. doi: 10.1093/hmg/ddae018. Hum Mol Genet. 2024. PMID: 38324746 Free PMC article. - The RioK1 network determines p53 activity at multiple levels.
Damizia M, Moretta GM, De Wulf P. Damizia M, et al. Cell Death Discov. 2023 Nov 7;9(1):410. doi: 10.1038/s41420-023-01704-7. Cell Death Discov. 2023. PMID: 37935656 Free PMC article. - Exploration of tricyclic heterocycles as core structures for RIOK2 inhibitors.
Xiong H, Yu Q, Ma H, Yu X, Ouyang Y, Zhang ZM, Zhou W, Zhang Z, Cai Q. Xiong H, et al. RSC Med Chem. 2023 Jul 21;14(10):2007-2011. doi: 10.1039/d3md00209h. eCollection 2023 Oct 18. RSC Med Chem. 2023. PMID: 37859717 Free PMC article. - Riok1, A Novel Potential Target in MSI-High p53 Mutant Colorectal Cancer Cells.
Shechter S, Ya'ar Bar S, Khattib H, Gage MJ, Avni D. Shechter S, et al. Molecules. 2023 May 31;28(11):4452. doi: 10.3390/molecules28114452. Molecules. 2023. PMID: 37298928 Free PMC article.
References
- Furnari FB, Fenton T, Bachoo RM, Mukasa A, Stommel JM, et al. (2007) Malignant astrocytic glioma: genetics, biology, and paths to treatment. Genes Dev 21: 2683–2710. - PubMed
- Holland EC, Celestino J, Dai C, Schaefer L, Sawaya RE, et al. (2000) Combined activation of Ras and Akt in neural progenitors induces glioblastoma formation in mice. Nat Genet 25: 55–57. - PubMed
Publication types
MeSH terms
Substances
LinkOut - more resources
Full Text Sources
Other Literature Sources
Molecular Biology Databases
Research Materials
Miscellaneous
