MiR-210 promotes a hypoxic phenotype and increases radioresistance in human lung cancer cell lines - PubMed (original) (raw)
doi: 10.1038/cddis.2013.71.
J Doyen, S K Parks, T Bertero, A Paye, B Cardinaud, P Gounon, S Lacas-Gervais, A Noël, J Pouysségur, P Barbry, N M Mazure, B Mari
Affiliations
- PMID: 23492775
- PMCID: PMC3615727
- DOI: 10.1038/cddis.2013.71
MiR-210 promotes a hypoxic phenotype and increases radioresistance in human lung cancer cell lines
S Grosso et al. Cell Death Dis. 2013.
Abstract
The resistance of hypoxic cells to radiotherapy and chemotherapy is a major problem in the treatment of cancer. Recently, an additional mode of hypoxia-inducible factor (HIF)-dependent transcriptional regulation, involving modulation of a specific set of micro RNAs (miRNAs), including miR-210, has emerged. We have recently shown that HIF-1 induction of miR-210 also stabilizes HIF-1 through a positive regulatory loop. Therefore, we hypothesized that by stabilizing HIF-1 in normoxia, miR-210 may protect cancer cells from radiation. We developed a non-small cell lung carcinoma (NSCLC)-derived cell line (A549) stably expressing miR-210 (pmiR-210) or a control miRNA (pmiR-Ctl). The miR-210-expressing cells showed a significant stabilization of HIF-1 associated with mitochondrial defects and a glycolytic phenotype. Cells were subjected to radiation levels ranging from 0 to 10 Gy in normoxia and hypoxia. Cells expressing miR-210 in normoxia had the same level of radioresistance as control cells in hypoxia. Under hypoxia, pmiR-210 cells showed a low mortality rate owing to a decrease in apoptosis, with an ability to grow even at 10 Gy. This miR-210 phenotype was reproduced in another NSCLC cell line (H1975) and in HeLa cells. We have established that radioresistance was independent of p53 and cell cycle status. In addition, we have shown that genomic double-strand breaks (DSBs) foci disappear faster in pmiR-210 than in pmiR-Ctl cells, suggesting that miR-210 expression promotes a more efficient DSB repair. Finally, HIF-1 invalidation in pmiR-210 cells removed the radioresistant phenotype, showing that this mechanism is dependent on HIF-1. In conclusion, miR-210 appears to be a component of the radioresistance of hypoxic cancer cells. Given the high stability of most miRNAs, this advantage could be used by tumor cells in conditions where reoxygenation has occurred and suggests that strategies targeting miR-210 could enhance tumor radiosensitization.
Figures
Figure 1
Identification of a miR-210 transcriptional signature in pmiR-210 A549 cells. (a) MiR-210 expression was analyzed by qRT-PCR on A549 cells cultivated in normoxia or hypoxia (1% O2) and on A549-derived pmiR-Ctrl and pmiR-210 cells. Mean±S.E.M. is representative of three independent experiments carried out in duplicate. (b) Activity of miR-210 was assayed in pmiR-Ctl and pmiR-210 cell lines with a 2 × perfect sensor construct, and were normalized using psiCheck2. Mean±S.E.M. is representative of three independent experiments carried out in triplicate. **P<0.05. (c) Volcano plot showing the distribution of differentially expressed genes between pmiR-210 versus pmiR-Ctl A549 cells. The green window focuses on significantly downregulated transcripts, containing a high proportion of miR-210-predicted targets (yellow dots). (d) Overrepresentation of miR-210-predicted targets in the pmiR-210 cell line according to TargetScan algorithm. Representation of miRNA predicted targets in the set of downregulated genes was compared with the set of all expressed genes. For each miRNA, a fold enrichment value (horizontal axis) and an associated _P_-value (vertical axis) were calculated. The best enrichment score and _P_-value are obtained for miR-210. A significant score is also obtained for miR-147b, confirming the close functional proximity of miR-210 and miR-147b
Figure 2
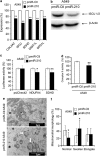
Mitochondrial functions are altered in pmiR-210 A549 cells. (a) Expression levels of five miR-210 targets (predicted and confirmed) were measured by qRT-PCR in pmiR-Ctl and pmiR-210 A549 cells. Mean±S.E.M. is representative of three independent experiments carried out in triplicate. (b) Western blotting showing downregulation of ISCU1/2 in pmiR-210 cells. Representative blot out of three independent experiments is shown. (c) Effect of miR-210 on NDUFA4 and SDHD was assessed using luciferase reporter assay. NDUFA4 3′-UTR, SDHD 3′-UTR construct or the control construct were transfected into pmiR-Ctl and pmiR-210 A549 cells and assayed for luciferase activity. Renilla luciferase values were normalized to Firefly luciferase activity. Mean±S.E.M. is representative of three independent experiments carried out in triplicate. (d) Complex II activity assays were performed on pmiR-Ctl and pmiR-210 A549 cells 48 h after plating. Mean±S.E.M. is representative of three independent experiments carried out in duplicate. (e) Electron micrograph showing morphology of mitochondria in pmiR-Ctl and pmiR-210 A549 cells. (f) Quantification of mitochondrial morphology. The quantification was done on thirty cells for each cell line. *P<0.01 and **P<0.05
Figure 3
Metabolic characterization of pmiR-Ctl and pmiR-210 A549 cells. (a) Immunoblotting of HIF-1_α_, CAIX, HKII and tubulin in pmiR-Ctl and pmiR-210 A549 cells in normoxia. (b) Immunofluorescence of HIF-1_α_ in pmiR-Ctl and pmiR-210 A549 cells in normoxia; scale bar, 50 _μ_m. (c) Characterization of the growth of pmiR-Ctl and pmiR-210 A549 cells incubated in normoxia (Nx) or in hypoxia 1% O2 (Hx1%) for 2 days (2d). Mean±S.E.M. is representative of two independent experiments carried out in duplicate. (d) OCR (left panel) and ECAR (right panel) were measured in real time in a Seahorse XF bioenergetic assay. A total of 2 × 10⁴ pmiR-Ctl and pmiR-210 A549 cells were seeded for 2d. Average OCR and ECAR were calculated from at least four measurements during the treatment of each compound (glucose, oligomycin, FCCP, rotenone) at the concentration as indicated. Mean±S.E.M. is representative of six independent experiments carried out in tetraplicate. **P<0.01 shows significant difference from the miR-Ctl after addition of oligomycin. (e) After 2d of culture, cells were lysed in assay buffer by sonication. Then, lactate was quantified in cellular extracts. Lactate quantity is expressed in relative lactate production. Mean±S.E.M. is representative of three independent experiments carried out in duplicate. *P<0.05 shows significant difference from the miR-Ctl
Figure 4
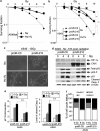
Radioresistance of pmiR-210 A549 cells. (a) Radioresistance of wild-type A549 (A549wt) cells cultured for 2 days in normoxia (Nx) and in hypoxia 1% O2 (Hx1%), and treated with the indicated dose of radiation. Cells were then subjected to a clonogenic cell survival assay. In x axis is the dose of X-radiation. In y axis is the surviving fraction. Mean±S.E.M. is representative of two independent experiments carried out in duplicate. (b) Radioresistance of both pmiR-Ctl and pmiR-210 A549 cells cultured for 2 days in normoxia (Nx) and hypoxia 1% O2 (Hx1%). The cells were then subjected to a clonogenic cell survival assay. In x axis is the dose of X-radiation. In y axis is the surviving fraction. Mean±S.E.M. is representative of three independent experiments carried out in duplicate for a+b. (c) Cell morphology from microscope images of pmiR-Ctl and pmiR-210 A549 cells cultured for 2 days in normoxia (Nx) and hypoxia 1% O2 (Hx1%), treated with 10 Gy and subject to clonogenic cell survival. (d) Immunoblotting of HIF-1_α_, CAIX, total p53, p53-P, p21, cleaved caspase-3 (cleaved Casp.3) and _β_-actin in pmiR-Ctl and pmiR-210 A549 cells in normoxia (Nx) 18 h after irradiations (0, 4 and 8 Gy). (e) Histograms show the quantification of the p21 and the cleaved caspase-3 bands. Mean±S.E.M. is representative of three independent experiments. **P<0.01. (f) Eighteen hours after the indicated dose of irradiation, cells were fixed and labeled with propidium iodide for analysis by flow cytometry. Histograms represent the percentage of cells in each phase of the cell cycle (subG1, G0/G1, S and G2/M). Representative results are shown from three independent experiments
Figure 5
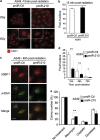
Increased kinetics of DSBs repair after radiation in pmiR-210 A549 cells. (a) Induction of 53BP1 foci in pmiR-Ctl and pmiR-210 A549 cells following 0–8 Gy at 15 min; scale bar, 7.3 _μ_m. (b) Histograms show the quantification of the average foci per nucleus from at least three independent measurements. (c) 53BP1 colocalizes with the canonical DSB marker _γ_H2AX in pmiR-Ctl and pmiR-210 A549 cells at 48 h following 8 Gy; scale bar, 7.3 _μ_m. (d) Histograms show the quantification of the foci per nucleus on average from at least three independent measurements in a time-responsive manner (18, 48 and 72 h after irradiations). (e) A549 cells, pmiR-Ctl and pmiR-210 were cultured for 2 days, and at this point, treated with cisplatin (1 _μ_g/ml) for 24 h or docetaxel (25 nM) for 4 h, or bleomycin for 2 h (10 _μ_g/ml). Then, cells were trypsinized and plated in triplicate (1000 cells per well in 6-well plates) for clonogenic survival. Cells were allowed to form colonies during 10 days. At this time, they were fixed and stained with crystal violet and counted using ImageJ software. Data represent the average of two independent experiments. *P<0.05 and **P<0.01
Figure 6
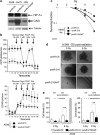
Involvement of HIF-1_α_ in miR-210 radioresistance. (a) Immunoblot of HIF-1_α_, CAIX and tubulin in pmiR-Ctl, pmiR-210 and pmiR-210/HIF− A549 cells in hypoxia 1% O2 (Hx1%). (b) OCR (top panel) and ECAR (bottom panel) were measured in real time in a Seahorse XF bioenergetic assay. A total of 2 × 10⁴ pmiR-210 and pmiR-210/HIF− A549 cells were seeded for 2 days. Average OCR and ECAR were calculated from at least four measurements during the treatment of each compound (glucose, oligomycin, FCCP, rotenone) at the concentration as indicated. Mean±S.E.M. is representative of three independent experiments carried out in tetraplicate. (c) Radioresistance of both pmiR-210 and pmiR-210/HIF− A549 cells cultured for 2 days in normoxia (Nx). The cells were then subjected to a clonogenic cell survival assay. In x axis is the dose of X-radiation. In y axis is the surviving fraction. Mean±S.E.M. is representative of three independent experiments carried out in duplicate. (d and e) A549 cells, pmiR-Ctl, pmiR-210 and pmiR-210/HIF−, were cultured as 3D spheroids for 5 days (D5), subjected to 0 or 8 Gy, and then cultured for 5 (D5) or 10 (D10) days. Spheroids were then subjected to accutase dissociation, and individualized live cells and dead cells were counted using Trypan blue. Data represent the average of three independent experiments. **P<0.01
Similar articles
- miR-210 is overexpressed in late stages of lung cancer and mediates mitochondrial alterations associated with modulation of HIF-1 activity.
Puisségur MP, Mazure NM, Bertero T, Pradelli L, Grosso S, Robbe-Sermesant K, Maurin T, Lebrigand K, Cardinaud B, Hofman V, Fourre S, Magnone V, Ricci JE, Pouysségur J, Gounon P, Hofman P, Barbry P, Mari B. Puisségur MP, et al. Cell Death Differ. 2011 Mar;18(3):465-78. doi: 10.1038/cdd.2010.119. Epub 2010 Oct 1. Cell Death Differ. 2011. PMID: 20885442 Free PMC article. - DNA Damage and Inflammatory Response of p53 Null H358 Non-Small Cell Lung Cancer Cells to X-Ray Exposure Under Chronic Hypoxia.
Nisar H, Brauny M, Labonté FM, Schmitz C, Konda B, Hellweg CE. Nisar H, et al. Int J Mol Sci. 2024 Nov 23;25(23):12590. doi: 10.3390/ijms252312590. Int J Mol Sci. 2024. PMID: 39684302 Free PMC article. - NF-κB in the Radiation Response of A549 Non-Small Cell Lung Cancer Cells to X-rays and Carbon Ions under Hypoxia.
Nisar H, Sanchidrián González PM, Labonté FM, Schmitz C, Roggan MD, Kronenberg J, Konda B, Chevalier F, Hellweg CE. Nisar H, et al. Int J Mol Sci. 2024 Apr 19;25(8):4495. doi: 10.3390/ijms25084495. Int J Mol Sci. 2024. PMID: 38674080 Free PMC article. - miR-210: More than a silent player in hypoxia.
Devlin C, Greco S, Martelli F, Ivan M. Devlin C, et al. IUBMB Life. 2011 Feb;63(2):94-100. doi: 10.1002/iub.427. Epub 2011 Feb 24. IUBMB Life. 2011. PMID: 21360638 Free PMC article. Review. - The dual role of MiR-210 in the aetiology of cancer: A focus on hypoxia-inducible factor signalling.
Afsar S, Syed RU, Bin Break MK, Alsukaybi RH, Alanzi RA, Alshobrmi AM, Alshagdali NM, Alshammari AD, Alharbi FM, Alshammari AM, Algharbi WF, Albrykan KM, Alshammari FN. Afsar S, et al. Pathol Res Pract. 2024 Jan;253:155018. doi: 10.1016/j.prp.2023.155018. Epub 2023 Dec 6. Pathol Res Pract. 2024. PMID: 38070222 Review.
Cited by
- Adipose tissue dysfunction and its effects on tumor metabolism.
Diedrich J, Gusky HC, Podgorski I. Diedrich J, et al. Horm Mol Biol Clin Investig. 2015 Jan;21(1):17-41. doi: 10.1515/hmbci-2014-0045. Horm Mol Biol Clin Investig. 2015. PMID: 25781550 Free PMC article. Review. - Adipose-derived exosomal miR-210/92a cluster inhibits adipose browning via the FGFR-1 signaling pathway in high-altitude hypoxia.
Zhang Y, Song K, Qi G, Yan R, Yang Y, Li Y, Wang S, Bai Z, Ge RL. Zhang Y, et al. Sci Rep. 2020 Sep 1;10(1):14390. doi: 10.1038/s41598-020-71345-8. Sci Rep. 2020. PMID: 32873843 Free PMC article. - The nuclear hypoxia-regulated NLUCAT1 long non-coding RNA contributes to an aggressive phenotype in lung adenocarcinoma through regulation of oxidative stress.
Moreno Leon L, Gautier M, Allan R, Ilié M, Nottet N, Pons N, Paquet A, Lebrigand K, Truchi M, Fassy J, Magnone V, Kinnebrew G, Radovich M, Cheok MH, Barbry P, Vassaux G, Marquette CH, Ponzio G, Ivan M, Pottier N, Hofman P, Mari B, Rezzonico R. Moreno Leon L, et al. Oncogene. 2019 Nov;38(46):7146-7165. doi: 10.1038/s41388-019-0935-y. Epub 2019 Aug 15. Oncogene. 2019. PMID: 31417181 - Nonfouling, Encoded Hydrogel Microparticles for Multiplex MicroRNA Profiling Directly from Formalin-Fixed, Paraffin-Embedded Tissue.
Nagarajan MB, Tentori AM, Zhang WC, Slack FJ, Doyle PS. Nagarajan MB, et al. Anal Chem. 2018 Sep 4;90(17):10279-10285. doi: 10.1021/acs.analchem.8b02010. Epub 2018 Aug 14. Anal Chem. 2018. PMID: 30106558 Free PMC article. - An integromic signature for lung cancer early detection.
Leng Q, Lin Y, Zhan M, Jiang F. Leng Q, et al. Oncotarget. 2018 May 15;9(37):24684-24692. doi: 10.18632/oncotarget.25227. eCollection 2018 May 15. Oncotarget. 2018. PMID: 29872497 Free PMC article.
References
- Gray LH, Conger AD, Ebert M, Hornsey S, Scott OC. The concentration of oxygen dissolved in tissues at the time of irradiation as a factor in radiotherapy. Br J Radiol. 1953;26:638–648. - PubMed
- Palcic B, Skarsgard LD. Reduced oxygen enhancement ratio at low doses of ionizing radiation. Radiat Res. 1984;100:328–339. - PubMed
- Harada H. How can we overcome tumor hypoxia in radiation therapy. J Radiat Res. 2011;52:545–556. - PubMed
- Ryan HE, Poloni M, McNulty W, Elson D, Gassmann M, Arbeit JM, et al. Hypoxia-inducible factor-1alpha is a positive factor in solid tumor growth. Cancer Res. 2000;60:4010–4015. - PubMed
Publication types
MeSH terms
Substances
LinkOut - more resources
Full Text Sources
Other Literature Sources
Medical
Molecular Biology Databases
Research Materials
Miscellaneous


