Energetic role of the paddle motif in voltage gating of Shaker K(+) channels - PubMed (original) (raw)
Energetic role of the paddle motif in voltage gating of Shaker K(+) channels
Yanping Xu et al. Nat Struct Mol Biol. 2013 May.
Abstract
Voltage-gated ion channels underlie rapid electric signaling in excitable cells. Electrophysiological studies have established that the N-terminal half of the fourth transmembrane segment ((NT)S4) of these channels is the primary voltage sensor, whereas crystallographic studies have shown that (NT)S4 is not located within a proteinaceous pore. Rather, (NT)S4 and the C-terminal half of S3 ((CT)S3 or S3b) form a helix-turn-helix motif, termed the voltage-sensor paddle. This unexpected structural finding raises two fundamental questions: does the paddle motif also exist in voltage-gated channels in a biological membrane, and, if so, what is its function in voltage gating? Here, we provide evidence that the paddle motif exists in the open state of Drosophila Shaker voltage-gated K(+) channels expressed in Xenopus oocytes and that (CT)S3 acts as an extracellular hydrophobic 'stabilizer' for (NT)S4, thus biasing the gating chemical equilibrium toward the open state.
Figures
Figure 1
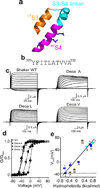
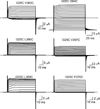
Simultaneous replacement of ten residues in CTS3 with a single residue type. (a) Ribbon representations of the paddle motif where CTS3, NTS4 and their linker are colored orange, magenta, and cyan, respectively, and the residues corresponding to Shaker’s Arg1–Arg4 are shown as sticks (PDB: 2R9R). (b) Shaker channel CTS3 sequence. (c) Current traces for wild-type (WT) and three representative mutant channels where we simultaneously replaced all ten residues in CTS3 with either Ala (Deca A), Leu (Deca L) or Val (Deca V). Currents are recorded as membrane voltage was stepped from the −80 mV holding potential to voltages up to 80 mV in 10 mV increments. Zero current levels are indicated by dotted lines. Currents of the three mutants were corrected for background currents with the P/4 protocol. (d) G-V curves of wild-type and three mutant channels. The curves are fits of a Boltzmann function, yielding that the midpoint (V1/2) = −37 ± 0.3 mV and the apparent valence (Z) = 4.1 ± 0.1 (mean ± s.e.m., n = 11) for the wild type; V1/2 = 0 ± 0.3 mV and Z = 4.1 ± 0.3 (n = 10) for Deca A; V1/2 = −36 ± 1.0 mV and Z = 3.7 ± 0.2 (n = 10) for Deca L; V1/2 = −11 ± 1.2 mV and Z = 2.1 ± 0.2 (n = 10) for Deca V. (e) V1/2 of eleven mutants plotted against hydrophobicity of the substituted residue. The data points for aliphatic residues and Gly are colored dark blue, Ser and Thr sky blue and the rest olive. Dotted line indicates the V1/2 value for wild-type channels whereas solid straight line is fit to all data points.
Figure 2
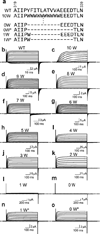
Deletion analysis of CTS3. (a) CTS3 and neighboring sequences of wild-type and mutant channels. Mutant channels containing 0–10 tryptophan residues in CTS3 are denoted as 0W–10W. Asterisks signify that the EEED sequence was also deleted. (b–o) Currents of wild-type and mutant channels, elicited by stepping membrane voltage from the −100 mV holding potential to between −100 mV and 80 mV (b) or 110 mV (c–o) in 10 mV increments. Currents in c were corrected for background currents obtained with 1 µM agitoxin-1 (AgTx1) present.
Figure 3
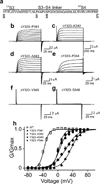
Stepwise deletions in CTS3 and the S3–S4 linker. (a) Sequence of CTS3 through NTS4. (b–g) Currents of mutant channels that lack the entire CTS3 and partial S3–S4 linker sequences as indicated. Currents were elicited by stepping membrane voltage from the −100 mV holding potential to between −80 mV and 80 mV in 10 mV increments. Current shown in b, d and e were corrected for background currents with the P/4 protocol. (h) G-V curves of the deletion mutants, along with that of wild-type (Fig. 1b), where the curves are fits of a Boltzmann function, yielding V1/2 = 6 ± 1.2 mV and Z = 2.5 ± 0.2 (mean ± s.e.m., n = 10) for ΔY323–P341; V1/2 = 35 ± 0.5 mV and Z = 2.0 ± 0.1 (n = 14) for ΔY323–K342; V1/2 = 3.0 ± 0.7 mV and Z = 3.5 ± 0.3 (n = 8) for ΔY323–A343; and V1/2 = 22 ± 0.7 mV and Z = 1.6 ± 0.1 (n = 6) for ΔY323–P344. We calculated conductance values for the G-V curve of ΔY323–K342 from the current and K+-driving force ratio, and used the tail current method for the other three mutants.
Figure 4
Deletion analysis of CTS3 through NTS4. (a–c) Currents of mutant channels elicited in the presence of 20 mM (a) or 100 mM (b and c) extracellular K+ by stepping membrane voltage from the −80 mV (a) or 0 mV (b and c) holding potential to between −70 mV (a) mV or −120 mV (b and c) and 80 mV in 10 mV increments. In the mutant channels, the sequences from I325 to V367 (a), F324 (b) or Y323 (c) were deleted and replaced by a glycine triplet. Currents shown were corrected for background currents obtained with 1 µM agitoxin-1 (AgTx1) present.
Figure 5
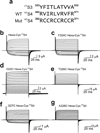
Cysteine point mutations of CTS3 in the presence of a hexa-cysteine mutation in NTS4. (a) Sequences of CTS3 and NTS4 without or with a hexa-cysteine mutation. (b–g) Current traces of mutant channels elicited by stepping from the −100 mV holding potential to between −80 mV and 80 mV in 10 mV increments. All six mutants contain a hexa-cysteine mutation as shown in a, without (b) or with (c–g) additional cysteine mutation in CTS3, as indicated. Currents shown in d were corrected for background currents obtained with 1 µM AgTx1 present.
Figure 6
Cysteine mutation of individual hydrophobic residues in NTS4 in the presence of I325C in CTS3. Current traces of mutant channels elicited by stepping from the −100 mV holding potential to between −80 mV and 80 mV in 10 mV increments. All six mutants contain the I325C mutation in CTS3 and an additional cysteine mutation in NTS4, as indicated. Currents of the I325C I364C double mutant were corrected for background currents obtained with 1 µM AgTx1 present.
Figure 7
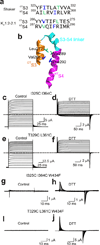
Cysteine pairs between CTS3 and NTS4 that lock the channels in the open state. (a) Sequences of CTS3 and NTS4 of Shaker and Kv1.2–2.1 channels. The residue pairs in the Shaker sequence, whose substitution by cysteine lock the channel in the open state, are colored lime and blue. Corresponding residues in the Kv1.2–2.1 sequence are similarly colored. (b) Structure of Kv1.2–2.1’s CTS3 through NTS4 (PDB: 2R9R). Colored sticks correspond to the colored residues in the Kv1.2–2.1 sequence in a. (c–f) Ionic currents of the I325C I364C (c and d) or T329C L361C (e and f) double mutant without (control) or with exposure to 1 mM DTT (d, a few minutes; f, overnight). Currents were elicited by stepping membrane voltage from −100 mV (c and e) or −120 mV (d and f) to 100 mV (c and e) or 50 mV (d and f) in 10 mV increments. Traces shown in c and e were corrected for background currents obtained with 1 µM AgTx1 present. (g–j) Gating currents of channels containing the W434F mutation and the I325C I364C (g and h) or T329C L361C (i and j) double mutation without (control) or with exposure to 1 mM DTT (h, a few minutes; j, overnight). Currents elicited by stepping membrane voltage from −140 mV to 0 mV in 10 mV increments. Bathing solutions contained 100 mM K+ (c–f) or 5 mM K+ plus 95 mM Na+ (g–j).
Figure 8
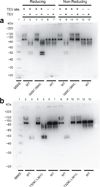
Biochemical examination of disulfide bond formation between cysteine pairs in the paddle motif. (a and b) Western blots of purified recombinant wild-type Shaker protein and I325C I364C (a) or (b) T329C L361C double-cysteine mutant proteins prepared under reducing or non-reducing conditions and with or without TEV digestion. All tested proteins contain an N-terminal Flag epitope with or without a TEV site in the S3–S4 linker. Molecular weight standards (MWS) run in the leftmost lane.
Figure 9
Partial structures of Kv1.2–2.1. (a) Space filling model of S3–S5 where hydrophobic, polar, negatively charged and positively charged residues are colored orange, magenta, ruby, and blue, respectively (PDB: 2R9R). S4 is delineated in turquoise. (b) Model of S1–S6, with S1–S4 from one subunit and S5 and S6 from the adjacent subunit. S3–S5 are positioned and colored as in a, whereas S1, S2 and S6 are shown as cyan, light blue, and lime ribbons, respectively. (c and d) Back views of a and b, respectively. The dotted lines approximate the membrane boundaries, extracellular (EC) and intracellular (IC) sides above and below, respectively.
Comment in
- The design principle of paddle motifs in voltage sensors.
Kalia J, Swartz KJ. Kalia J, et al. Nat Struct Mol Biol. 2013 May;20(5):534-5. doi: 10.1038/nsmb.2578. Nat Struct Mol Biol. 2013. PMID: 23649359 No abstract available.
Similar articles
- A shaker K+ channel with a miniature engineered voltage sensor.
Xu Y, Ramu Y, Lu Z. Xu Y, et al. Cell. 2010 Aug 20;142(4):580-9. doi: 10.1016/j.cell.2010.07.013. Epub 2010 Aug 5. Cell. 2010. PMID: 20691466 Free PMC article. - S3b amino acid residues do not shuttle across the bilayer in voltage-dependent Shaker K+ channels.
Gonzalez C, Morera FJ, Rosenmann E, Alvarez O, Latorre R. Gonzalez C, et al. Proc Natl Acad Sci U S A. 2005 Apr 5;102(14):5020-5. doi: 10.1073/pnas.0501051102. Epub 2005 Mar 17. Proc Natl Acad Sci U S A. 2005. PMID: 15774578 Free PMC article. - S4-S5 linker movement during activation and inactivation in voltage-gated K+ channels.
Kalstrup T, Blunck R. Kalstrup T, et al. Proc Natl Acad Sci U S A. 2018 Jul 17;115(29):E6751-E6759. doi: 10.1073/pnas.1719105115. Epub 2018 Jun 29. Proc Natl Acad Sci U S A. 2018. PMID: 29959207 Free PMC article. - Involvement of the S4-S5 linker and the C-linker domain regions to voltage-gating in plant Shaker channels: comparison with animal HCN and Kv channels.
Nieves-Cordones M, Gaillard I. Nieves-Cordones M, et al. Plant Signal Behav. 2014;9(10):e972892. doi: 10.4161/15592316.2014.972892. Plant Signal Behav. 2014. PMID: 25482770 Free PMC article. Review. - Structural organization of the voltage sensor in voltage-dependent potassium channels.
Papazian DM, Silverman WR, Lin MC, Tiwari-Woodruff SK, Tang CY. Papazian DM, et al. Novartis Found Symp. 2002;245:178-90; discussion 190-2, 261-4. Novartis Found Symp. 2002. PMID: 12027007 Review.
Cited by
- Tuning voltage-gated channel activity and cellular excitability with a sphingomyelinase.
Combs DJ, Shin HG, Xu Y, Ramu Y, Lu Z. Combs DJ, et al. J Gen Physiol. 2013 Oct;142(4):367-80. doi: 10.1085/jgp.201310986. Epub 2013 Sep 16. J Gen Physiol. 2013. PMID: 24043861 Free PMC article. - Gating modules of the AMPA receptor pore domain revealed by unnatural amino acid mutagenesis.
Poulsen MH, Poshtiban A, Klippenstein V, Ghisi V, Plested AJR. Poulsen MH, et al. Proc Natl Acad Sci U S A. 2019 Jul 2;116(27):13358-13367. doi: 10.1073/pnas.1818845116. Epub 2019 Jun 18. Proc Natl Acad Sci U S A. 2019. PMID: 31213549 Free PMC article. - Mapping temperature-dependent conformational change in the voltage-sensing domain of an engineered heat-activated K+ channel.
Chen H, Deng J, Cui Q, Chanda B, Henzler-Wildman K. Chen H, et al. Proc Natl Acad Sci U S A. 2021 Apr 6;118(14):e2017280118. doi: 10.1073/pnas.2017280118. Proc Natl Acad Sci U S A. 2021. PMID: 33782120 Free PMC article. - Mechanosensitive gating of Kv channels.
Morris CE, Prikryl EA, Joós B. Morris CE, et al. PLoS One. 2015 Feb 13;10(2):e0118335. doi: 10.1371/journal.pone.0118335. eCollection 2015. PLoS One. 2015. PMID: 25680191 Free PMC article. Review. - Coarse-grained simulations of the gating current in the voltage-activated Kv1.2 channel.
Kim I, Warshel A. Kim I, et al. Proc Natl Acad Sci U S A. 2014 Feb 11;111(6):2128-33. doi: 10.1073/pnas.1324014111. Epub 2014 Jan 24. Proc Natl Acad Sci U S A. 2014. PMID: 24464485 Free PMC article.
References
- Armstrong CM, Bezanilla F. Currents related to movement of the gating particles of the sodium channels. Nature. 1973;242:459–461. - PubMed
- Noda M, et al. Primary structure of Electrophorus electricus sodium channel deduced from cDNA sequence. Nature. 1984;312:121–127. - PubMed
- Catterall WA. Molecular properties of voltage-sensitive sodium channels. Annu. Rev. Biochem. 1986;55:953–985. - PubMed
- Yang N, George AL, Jr, Horn R. Molecular basis of charge movement in voltage-gated sodium channels. Neuron. 1996;16:113–122. - PubMed
- Larsson HP, Baker OS, Dhillon DS, Isacoff EY. Transmembrane movement of the shaker K+ channel S4. Neuron. 1996;16:387–397. - PubMed
Publication types
MeSH terms
Substances
LinkOut - more resources
Full Text Sources
Other Literature Sources
Molecular Biology Databases
Research Materials
