HIF1α and HIF2α independently activate SRC to promote melanoma metastases - PubMed (original) (raw)
. 2013 May;123(5):2078-93.
doi: 10.1172/JCI66715. Epub 2013 Apr 8.
Bhavani Krishnan, Sean T Bailey, Stergios J Moschos, Pei-Fen Kuan, Takeshi Shimamura, Lukas D Osborne, Marni B Siegel, Lyn M Duncan, E Tim O'Brien 3rd, Richard Superfine, C Ryan Miller, M Celeste Simon, Kwok-Kin Wong, William Y Kim
Affiliations
- PMID: 23563312
- PMCID: PMC3635738
- DOI: 10.1172/JCI66715
HIF1α and HIF2α independently activate SRC to promote melanoma metastases
Sara C Hanna et al. J Clin Invest. 2013 May.
Abstract
Malignant melanoma is characterized by a propensity for early lymphatic and hematogenous spread. The hypoxia-inducible factor (HIF) family of transcription factors is upregulated in melanoma by key oncogenic drivers. HIFs promote the activation of genes involved in cancer initiation, progression, and metastases. Hypoxia has been shown to enhance the invasiveness and metastatic potential of tumor cells by regulating the genes involved in the breakdown of the ECM as well as genes that control motility and adhesion of tumor cells. Using a Pten-deficient, Braf-mutant genetically engineered mouse model of melanoma, we demonstrated that inactivation of HIF1α or HIF2α abrogates metastasis without affecting primary tumor formation. HIF1α and HIF2α drive melanoma invasion and invadopodia formation through PDGFRα and focal adhesion kinase-mediated (FAK-mediated) activation of SRC and by coordinating ECM degradation via MT1-MMP and MMP2 expression. These results establish the importance of HIFs in melanoma progression and demonstrate that HIF1α and HIF2α activate independent transcriptional programs that promote metastasis by coordinately regulating cell invasion and ECM remodeling.
Figures
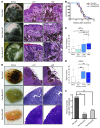
Figure 1. Inactivation of Hif1α or Hif2α does not affect initiation of the survival or growth of Pten;Braf melanomas, but abrogates lymph node metastases.
(A) Representative gross images as well as low- and high-power photomicrographs of H&E-stained Pten;Braf, Pten;Braf;Hif1, and Pten;Braf;Hif2 melanomas taken at gross, ×10, and ×20 magnification. (B) Kaplan-Meier survival curve of cohorts of mice of the indicated genotypes (Pten;Braf, n = 39; Pten;Braf;Hif1, n = 20; and Pten;Braf;Hif2, n = 28). P = 0.6585, log-rank test. (C and D) TMA analysis of HIF1α and HIF2α expression in melanocytic lesions. (E and F) Representative gross images, low- and high-power photomicrographs, and quantification of lymph node metastases from the indicated genotypes Pten;Braf (27/39), Pten;Braf;Hif1 (2/13), and Pten;Braf;Hif2 (4/15) taken at gross, ×10, and ×20 magnification. Error bars show SEM. ***P < 0.0005; **P < 0.005; *P < 0.05.
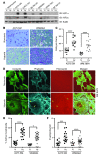
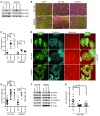
Figure 2. Hypoxia enhances melanoma cell invasion and invadopodia formation.
(A) The indicated cell lines were cultured in normoxia (N) (21% O2) or hypoxia (Hy) (1% O2) overnight. Whole-cell extracts were immunoblotted with the indicated antibodies. (B) Representative photomicrographs of A375 SM and WM2664 cells that have invaded through Matrigel chambers. Original magnification, ×10. (C) Quantification of A375 SM and WM2664 cells that have invaded through Matrigel chambers. (D) Representative immunofluorescence images of A375 SM cells plated on Alexa Fluor 568–conjugated fibronectin and stained with the indicated antibodies. Invadopodia were defined as colocalization of cortactin, F-actin (phalloidin), and degradation of Alexa Fluor 568 fibronectin and are indicated with yellow arrowheads. Original magnification, ×63. (E) Quantification of the percentage of cells with active invadopodia in A375 SM and WM2664 cells cultured overnight in normoxia or hypoxia. (F) Quantification of the number of invadopodia per cell in A375 SM and WM2664 cells cultured overnight in normoxia or hypoxia. Error bars show SEM. ****P < 0.0001; ***P < 0.0005; *P < 0.05.
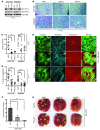
Figure 3. Knockdown of HIF1α or HIF2α reduces the hypoxia-induced invasion and invadopodia formation of melanoma cell lines.
(A) A375 SM and WM2664 cells were transfected with siRNAs against HIF1α, HIF2α, or a nonspecific sequence (NS). Whole-cell lysates were immunoblotted with the indicated antibodies. (B) Representative photomicrographs of A375 SM and WM2664 cells transfected with the indicated siRNAs, which have invaded through Matrigel chambers under hypoxia. Original magnification, ×10. (C) Quantification of A375 SM and WM2664 cells transfected with the indicated siRNAs, which have invaded through Matrigel chambers under hypoxia. (D) Representative immunofluorescence images of siRNA-transfected A375 SM cells plated on Alexa Fluor 568–conjugated fibronectin and stained with the indicated antibodies. Original magnification, ×63. Invadopodia were defined as colocalization of cortactin, F-actin (phalloidin), and degradation of Alexa Fluor 568 fibronectin and are indicated with yellow arrowheads. (E) Quantification of the percentage of cells with active invadopodia in siRNA-transfected A375 SM and WM2664 cells. (F) Quantification of the number of visible lung metastases found in mice tail vein injected with A375 SM cells. (G) Gross representative images of the lungs from tail-vein–injected mice. Yellow arrows indicate lung metastases. Error bars show SEM. ***P < 0.0005; **P < 0.005; *P < 0.05.
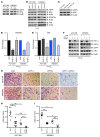
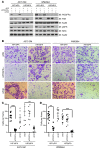
Figure 4. HIF1α and HIF2α upregulate PDGFRα and FAK and are necessary for hypoxia-induced SFK activation.
(A) A375 SM and WM2664 cells were cultured in normoxia (21% O2) or hypoxia (1% O2) overnight. Whole-cell extracts were immunoblotted with the indicated antibodies. (B) A375 SM and WM2664 cells were transfected with siRNAs against HIF1α, HIF2α, or a nonspecific sequence. Whole-cell lysates were immunoblotted with the indicated antibodies. (C) Tumor lysates from the indicated cohorts were immunoblotted for the indicated antibodies. (D and E) A375 SM and WM2664 cells were transfected with siRNAs against HIF1α, HIF2α, or a nonspecific sequence and cultured under hypoxia overnight. Total RNA was used to perform TaqMan quantitative real-time PCR for PDGFRA and FAK. (F) A375 SM and WM2664 cells were transfected with siRNAs against HIF1α, HIF2α, both HIF1α and HIF2α, or a nonspecific sequence. Whole-cell lysates were immunoblotted with the indicated antibodies. (G) Representative photomicrographs of A375 SM and WM2664 cells transfected with the indicated siRNAs, which have invaded through Matrigel chambers. Original magnification, ×10. (H and I) Quantification of A375 SM and WM2664 cells transfected with the indicated siRNAs, which have invaded through Matrigel chambers. Error bars show SEM. ***P < 0.0005; **P < 0.005; *P < 0.05.
Figure 5. Expression of stabilized HIF1α and HIF2α are sufficient to enhance normoxic melanoma cell invasion.
(A) A375 SM and WM2664 cells were infected with retrovirus to stably express EGFP or stabilized versions of HIF1α (HIF1dPA) or HIF2α (HIF2dPA). Whole-cell extracts were immunoblotted with the indicated antibodies. (B) Representative photomicrographs of A375 SM and WM2664 cells stably expressing EGFP, HIF1dPA, or HIF2dPA, which have invaded through Matrigel chambers. Original magnification, ×10. (C) Quantification of A375 SM and WM2664 cells stably expressing EGFP, HIF1dPA, or HIF2dPA, which have invaded through Matrigel chambers. (D) Representative immunofluorescence images of A375 SM cells stably expressing EGFP, HIF1dPA, or HIF2dPA and plated on Alexa Fluor 568–conjugated fibronectin and stained with the indicated antibodies. Original magnification, ×63. Invadopodia were defined as colocalization of cortactin, F-actin (phalloidin), and degradation of Alexa Fluor 568 fibronectin and are indicated with yellow arrowheads. (E) Quantification of the percentage of cells with active invadopodia in A375 SM and WM2664 cells stably expressing EGFP, HIF1dPA, or HIF2dPA. (F) Whole-cell extracts from A375 SM and WM2664 cells stably expressing EGFP, HIF1dPA, or HIF2dPA were immunoblotted with the indicated antibodies. (G) A375 SM cells stably expressing EGFP, HIF1dPA, or HIF2dPA were allowed to adhere to fibronectin-conjugated magnetic beads and subjected to repeated magnetic pulses; the resultant motion and recovery were quantified and used to calculate cell stiffness in Pascals (Pa). Error bars show SEM. ***P < 0.0005; **P < 0.005; *P < 0.05.
Figure 6. HIF1α and HIF2α-dependent invasion require PDGFRα and FAK, respectively.
(A) A375 SM and WM2664 cells stably expressing EGFP, HIF1dPA, or HIF2dPA were transfected with siRNAs against PDGFRα and FAK. Whole-cell extracts were immunoblotted with the indicated antibodies. (B) Representative photomicrographs of A375 SM and WM2664 cells stably expressing EGFP, HIF1dPA, or HIF2dPA and transfected with indicated siRNA oligos, which have invaded through Matrigel chambers. Original magnification, ×10 magnification. (C) Quantification of A375 SM cells stably expressing EGFP, HIF1dPA, or HIF2dPA and transfected with siRNA oligos against either PDGFRα or FAK, which have invaded through Matrigel chambers. (D) Quantification of WM2664 cells stably expressing EGFP, HIF1dPA, or HIF2dPA and transfected with siRNA oligos against either PDGFRα or FAK, which have invaded through Matrigel chambers. Error bars show SEM. ***P < 0.0005; **P < 0.005.
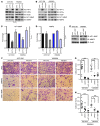
Figure 7. HIF1α and HIF2α regulate expression of MMPs implicated in invadopodia formation.
(A) A375 SM and WM2664 cells were transfected with siRNAs against HIF1α, HIF2α, or a nonspecific sequence. Whole-cell lysates were immunoblotted with the indicated antibodies. (B) A375 SM and WM2664 cells were infected with retrovirus to stably express EGFP or stabilized versions of HIF1α (HIF1dPA) or HIF2α (HIF2dPA). Whole-cell extracts were immunoblotted with the indicated antibodies. (C and D) A375 SM and WM2664 cells were transfected with siRNAs against HIF1α, HIF2α, or a nonspecific sequence. Total RNA was used to perform TaqMan quantitative real-time PCR for MT1-MMP and MMP2. (E) A375 SM cells stably expressing HIF1dPA and HIF2dPA were transfected with siRNAs against MT1-MMP, MMP2, or a nonspecific sequences. Whole-cell lysate was immunoblotted with the indicated antibodies. (F) Representative photomicrographs of A375 SM and WM2664 cells stably expressing EGFP, HIF1dPA, or HIF2dPA and transfected with siRNA oligos against either MT1-MMP or MMP2, which have invaded through Matrigel chambers. Original magnification, ×10. (G and H) Quantification of A375 SM and WM2664 cells stably expressing EGFP, HIF1dPA, or HIF2dPA and transfected with siRNA oligos against MT1-MMP or MMP2, which have invaded through Matrigel chambers. Error bars show SEM. ***P < 0.0005; **P < 0.005; *P < 0.05.
Figure 8. Knockdown of Hif1α and Hif2α reduces the hypoxia-induced invasion of cell lines derived from Pten;Braf melanomas.
(A) 2460 Pten;Braf melanoma cells were treated with the indicated doses of vemurafenib, PIK-90, or DMSO overnight. Whole-cell lysates were immunoblotted with the indicated antibodies. (B) Representative photomicrographs of 2130 and 2460 Pten;Braf melanoma cells, which have invaded through Matrigel chambers under hypoxia or normoxia. Original magnification, ×10. (C) Quantification of 2130 and 2460 Pten;Braf melanoma cells, which have invaded through Matrigel chambers. (D) 2130 and 2460 Pten;Braf melanoma cells were transfected with siRNAs against murine _Hif1_α or _Hif2_α and immunoblotted with the indicated antibodies. (E) Representative photomicrographs of 2130 and 2460 Pten;Braf melanoma cells that were transfected with siRNAs against murine _Hif1_α or _Hif2_α and allowed to invade through Matrigel chambers under hypoxia. Original magnification, ×10. (F) Quantification of 2130 and 2460 Pten;Braf melanoma cells that were transfected with siRNAs against murine _Hif1_α or _Hif2_α and allowed to invade through Matrigel chambers under hypoxia. Error bars show SEM. ***P < 0.0005;**P < 0.005; *P < 0.05.
Similar articles
- Identification of the hypoxia-inducible factor 2α nuclear interactome in melanoma cells reveals master proteins involved in melanoma development.
Steunou AL, Ducoux-Petit M, Lazar I, Monsarrat B, Erard M, Muller C, Clottes E, Burlet-Schiltz O, Nieto L. Steunou AL, et al. Mol Cell Proteomics. 2013 Mar;12(3):736-48. doi: 10.1074/mcp.M112.020727. Epub 2012 Dec 28. Mol Cell Proteomics. 2013. PMID: 23275444 Free PMC article. - A macrophage-dominant PI3K isoform controls hypoxia-induced HIF1α and HIF2α stability and tumor growth, angiogenesis, and metastasis.
Joshi S, Singh AR, Zulcic M, Durden DL. Joshi S, et al. Mol Cancer Res. 2014 Oct;12(10):1520-31. doi: 10.1158/1541-7786.MCR-13-0682. Epub 2014 Aug 7. Mol Cancer Res. 2014. PMID: 25103499 - Opposite prognostic roles of HIF1α and HIF2α expressions in bone metastatic clear cell renal cell cancer.
Szendrői A, Szász AM, Kardos M, Tőkés AM, Idan R, Szűcs M, Kulka J, Nyirády P, Szendrői M, Szállási Z, Győrffy B, Tímár J. Szendrői A, et al. Oncotarget. 2016 Jul 5;7(27):42086-42098. doi: 10.18632/oncotarget.9669. Oncotarget. 2016. PMID: 27244898 Free PMC article. - Cancer stem cells and hypoxia-inducible factors (Review).
Tong WW, Tong GH, Liu Y. Tong WW, et al. Int J Oncol. 2018 Aug;53(2):469-476. doi: 10.3892/ijo.2018.4417. Epub 2018 May 22. Int J Oncol. 2018. PMID: 29845228 Review. - Regulation of hypoxia-inducible gene expression after HIF activation.
Suzuki N, Gradin K, Poellinger L, Yamamoto M. Suzuki N, et al. Exp Cell Res. 2017 Jul 15;356(2):182-186. doi: 10.1016/j.yexcr.2017.03.013. Epub 2017 Mar 9. Exp Cell Res. 2017. PMID: 28286304 Review.
Cited by
- Coronin 1C inhibits melanoma metastasis through regulation of MT1-MMP-containing extracellular vesicle secretion.
Tagliatela AC, Hempstead SC, Hibshman PS, Hockenberry MA, Brighton HE, Pecot CV, Bear JE. Tagliatela AC, et al. Sci Rep. 2020 Jul 20;10(1):11958. doi: 10.1038/s41598-020-67465-w. Sci Rep. 2020. PMID: 32686704 Free PMC article. - Insights into the therapeutic potential of hypoxia-inducible factor-1α small interfering RNA in malignant melanoma delivered via folate-decorated cationic liposomes.
Chen Z, Zhang T, Wu B, Zhang X. Chen Z, et al. Int J Nanomedicine. 2016 Mar 11;11:991-1002. doi: 10.2147/IJN.S101872. eCollection 2016. Int J Nanomedicine. 2016. PMID: 27042054 Free PMC article. - Yes-associated protein (YAP) binds to HIF-1α and sustains HIF-1α protein stability to promote hepatocellular carcinoma cell glycolysis under hypoxic stress.
Zhang X, Li Y, Ma Y, Yang L, Wang T, Meng X, Zong Z, Sun X, Hua X, Li H. Zhang X, et al. J Exp Clin Cancer Res. 2018 Sep 4;37(1):216. doi: 10.1186/s13046-018-0892-2. J Exp Clin Cancer Res. 2018. PMID: 30180863 Free PMC article. - Computational models of melanoma.
Albrecht M, Lucarelli P, Kulms D, Sauter T. Albrecht M, et al. Theor Biol Med Model. 2020 May 14;17(1):8. doi: 10.1186/s12976-020-00126-7. Theor Biol Med Model. 2020. PMID: 32410672 Free PMC article. Review. - WISP-1 positively regulates angiogenesis by controlling VEGF-A expression in human osteosarcoma.
Tsai HC, Tzeng HE, Huang CY, Huang YL, Tsai CH, Wang SW, Wang PC, Chang AC, Fong YC, Tang CH. Tsai HC, et al. Cell Death Dis. 2017 Apr 13;8(4):e2750. doi: 10.1038/cddis.2016.421. Cell Death Dis. 2017. PMID: 28406476 Free PMC article.
References
Publication types
MeSH terms
Substances
Grants and funding
- P30 ES010126/ES/NIEHS NIH HHS/United States
- CA 166480/CA/NCI NIH HHS/United States
- P30-DK-034987/DK/NIDDK NIH HHS/United States
- R01 CA122794/CA/NCI NIH HHS/United States
- P30 DK034987/DK/NIDDK NIH HHS/United States
- R01 CA140594/CA/NCI NIH HHS/United States
- T32 GM007092/GM/NIGMS NIH HHS/United States
- U54 CA151652/CA/NCI NIH HHS/United States
- CA 122794/CA/NCI NIH HHS/United States
- CA 141576/CA/NCI NIH HHS/United States
- 3P30CA016086/CA/NCI NIH HHS/United States
- 3P30ES010126/ES/NIEHS NIH HHS/United States
- P50 CA093683/CA/NCI NIH HHS/United States
- R33 CA155618/CA/NCI NIH HHS/United States
- P30 CA016086/CA/NCI NIH HHS/United States
- CA 140594/CA/NCI NIH HHS/United States
- CA 120964/CA/NCI NIH HHS/United States
- P01 CA154303/CA/NCI NIH HHS/United States
- R01 CA142794/CA/NCI NIH HHS/United States
- CA 163896/CA/NCI NIH HHS/United States
- R01 CA166480/CA/NCI NIH HHS/United States
LinkOut - more resources
Full Text Sources
Other Literature Sources
Medical
Molecular Biology Databases
Research Materials
Miscellaneous
