Scaffold nucleoporins Nup188 and Nup192 share structural and functional properties with nuclear transport receptors - PubMed (original) (raw)
Scaffold nucleoporins Nup188 and Nup192 share structural and functional properties with nuclear transport receptors
Kasper R Andersen et al. Elife. 2013.
Abstract
Nucleocytoplasmic transport is mediated by nuclear pore complexes (NPCs) embedded in the nuclear envelope. About 30 different proteins (nucleoporins, nups) arrange around a central eightfold rotational axis to build the modular NPC. Nup188 and Nup192 are related and evolutionary conserved, large nucleoporins that are part of the NPC scaffold. Here we determine the structure of Nup188. The protein folds into an extended stack of helices where an N-terminal 130 kDa segment forms an intricate closed ring, while the C-terminal region is a more regular, superhelical structure. Overall, the structure has distant similarity with flexible S-shaped nuclear transport receptors (NTRs). Intriguingly, like NTRs, both Nup188 and Nup192 specifically bind FG-repeats and are able to translocate through NPCs by facilitated diffusion. This blurs the existing dogma of a clear distinction between stationary nups and soluble NTRs and suggests an evolutionary relationship between the NPC and the soluble nuclear transport machinery. DOI:http://dx.doi.org/10.7554/eLife.00745.001\.
Keywords: Myceliophthora thermophila; S. cerevisiae; macromolecular assemblages; nucleocytoplasmic transport.
Conflict of interest statement
KW: Reviewing editor, eLife.
The other authors declare that no competing interests exist.
Figures
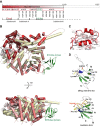
Figure 1.. Crystal structures of Nup188N.
(A) Schematic diagram of full-length Myceliophthora thermophila Nup188N with details about the subdomain arrangement. The crystallized fragment is boxed and gradient-colored in red with helical HEAT- and ARM-repeats indicated. (B) The crystal structure of Nup188N is shown in cartoon representation. The helices are gradient-colored as in (A). The inner helical ring is in pale-yellow to highlight the superhelical organization of the protein. The SH3-like domain insert is shown in green. (C) Close-up of the ring-closing latch. The clamping helices α11 and α12 (red) contact a substantial surface area formed by helices 44, 46, and 47. (D) The SH3-like domain of Nup188 compared to the canonical, peptide-bound SH3 domain of Sem-5 from C. elegans (PDB 1SEM). Conserved residues important for peptide interaction are labeled. Note that these residues are not conserved in the SH3-like domain of Nup188. In addition, the SH3-like domain is a circular permutation of the canonical SH3-domain. DOI:
http://dx.doi.org/10.7554/eLife.00745.003
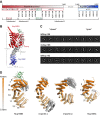
Figure 2.. Crystal structures of Nup188C.
(A) Schematic diagram of full-length Myceliophthora thermophila Nup188C with details about the subdomain arrangement. The crystallized fragments is boxed and gradient-colored in blue with helical HEAT- and ARM-repeats indicated. (B) Crystal structure of the C-terminal part of Nup188, gradient-colored as in (A), with the inner helices in pale-yellow. (C) Superposition of chains A (blue) and B (gray) of Nup188C shows the flexibility seen in the crystal, in which the outer helices of chain B move by 3–4 Å relative to the helices in chain A. DOI:
http://dx.doi.org/10.7554/eLife.00745.005
Figure 3.. Structural details of Nup188 and comparison to other proteins.
(A) Schematic diagram of full-length Myceliophthora thermophila Nup188 with details about the subdomain arrangement for the entire protein. (B) Full-length Nup188 gradient-colored in red-gray-blue. The modeled region and the overall dimensions are indicated. (C). Single-particle negative stain EM class averages of full-length _Mt_Nup188, _Sc_Nup188 and _Mt_Nup192. Classes are roughly grouped and are ordered from more ‘closed’ (left) to ‘open’ conformations (right). The three proteins are evidently structurally related. (D) Structural similarity between Nup188 and importin-α and -β. The aligned areas of Nup188N, Nup188C, importin-α (3L3Q) and importin-β (1QGR) are gradient-colored in orange from N to C terminus. Non-aligned helices are in gray and the repeat numbering is indicated. DOI:
http://dx.doi.org/10.7554/eLife.00745.006
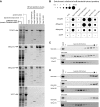
Figure 4.. Biochemical properties of Nup188 and Nup192.
(A and B) Binding of _Mt_Nup188 and _Mt_Nup192 to various FG-coated beads monitored by in vitro pulldown assays. (A) Standard volumes of the soluble protein mixtures (pulldown input), separate components of the mixtures (protein alone, bacterial extract alone) and the 1M NaCl pulldown eluates form various FG-coated beads (1M NaCl pulldown elates) were precipitated by methanol-chloroform and re-solubilized in a standard volume of SDS-sample buffer. The samples were separated by SDS-PAGE and the gels were stained with SYPRO-Ruby. (B) The diagram representing relative enrichments of _Sc_Kap95, Mt_Nup188, M_tNup192 and 3xGFP in various FG-pulldown eluates, as compared to bulk bacterial extract proteins. The enrichment values (ratios between the eluted and input protein amounts) were computed using protein band intensities from the SYPRO Ruby stained gels shown in (A). (C) _Hs_RanQ69L alone or an equimolar mixture of _Hs_RanQ69L with _Sc_Kap95 were subjected to gel filtration using a Superdex 200 column, and the eluted fractions were separated by SDS-PAGE. Ran was visualized by Western blotting against the ZZ-tag, and _Sc_Kap95 was visualized by SYPRO Ruby staining. (D) Superdex 200 elution profiles of ZZ-_Hs_RanQ69L (ZZ-tag Western blot) with or without the addition of _Mt_Nup188 or _M_tNup192 (SYPRO Ruby) analyzed as described in (C). DOI:
http://dx.doi.org/10.7554/eLife.00745.007
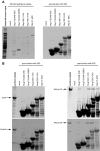
Figure 4—figure supplement 1.. Characterization of the FG-repeat interactions in pulldown assays.
(A) The specificity of the FG-pulldown assay conditions were examined by subjecting bacterial extract proteins alone to pulldown assays with various FG- coated beads. Bound proteins were eluted with 1M NaCl sufficient to disrupt the expected transient interactions (left panel), followed by SDS sample buffer (right panel). The input bacterial extract sample and 1M NaCl eluates were precipitated by methanol-chloroform and re-solubilized in SDS-sample buffer prior to separation by SDS-PAGE. The gels were stained with SYPRO Ruby. (B) Proteins resistant to 1M NaCl elution in the experiment described in Figure 4A were stripped-off by SDS-sample buffer and separated by SDS-PAGE followed by SYPRO Ruby gel staining. The ‘protein sample’ lanes are the same as ‘protein alone’ in Figure 4A, and are included as references for the protein amounts remaining after 1 M NaCl elution. DOI:
http://dx.doi.org/10.7554/eLife.00745.008
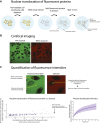
Figure 5.. Nuclear translocation of Nup188 and Nup192 in digitonin-permeabilized HeLa cells.
(A and B) The nuclear translocation of YFP-_Mt_Nup188 and YFP-_Mt_Nup192 (green) was monitored in digitonin-permeabilized HeLa cells in transport buffer alone (−cytosol), in transport buffer containing Xenopus cytosol and an energy regenerating mix (+cytosol), or in transport buffer after pre-treatment of nuclei with WGA (+WGA) (A). Similar assays were performed in transport buffer with or without the addition of unlabeled _Hs_Importin-β (B). 155kD TRITC-dextran (red) was used to check nuclear integrity. YFP-_Hs_Importin-β and 3xGFP were used as positive and negative controls for facilitated NPC translocation, respectively. (C and D) Quantitative analysis of the protein translocation experiments described in (A and B), respectively. The intranuclear fluorescence intensities of the proteins were quantified and normalized against the background (extranuclear) fluorescence. Bar graphs represent mean values ± standard deviations. Asterisks (*) indicate a significant difference in median value using the Mann-Whitney U test (p<0.01; >50 nuclei for each condition). DOI:
http://dx.doi.org/10.7554/eLife.00745.009
Figure 5—figure supplement 1.. Outline of the nuclear translocation assay.
(A) Illustration of the protocol used for the nuclear translocation assays. (B) An example of two-channel confocal images used to simultaneously monitor the nuclear translocation of fluorescent protein fusions (YFP channel) and 155 kDa TRITC-dextran (TRITC channel). (C) Schematic representation of the procedure used to quantify the nuclear translocation of fluorescent protein fusions into intact nuclei. Fluorescence intensities inside and outside the nuclei were quantified using custom written code in MATLAB. The normalized intranuclear fluorescence intensity for each nucleus was calculated by taking the ratio of the fluorescence inside to outside the nucleus. All nuclei whose normalized TRITC fluorescence exceeded 0.3 were considered ‘non-intact’ and omitted from the analysis. DOI:
http://dx.doi.org/10.7554/eLife.00745.010
Figure 6.. Kinetics of Nup188 and Nup192 nuclear translocation.
(A) The nuclear accumulation kinetics of the scaffold nucleoporins in transport buffer as compared to YFP-_Hs_Importin-β and 3xGFP. Nuclear translocation reactions were imaged immediately after the addition of the fluorescent proteins and TRITC-dextran. Non-intact nuclei permeable to TRITC-dextran were excluded from the analysis. The graph represents mean values ± standard deviations. (B) Quantitative analysis of the initial nuclear translocation rates (equal to the total protein translocation rate through NPCs) for the experiments described in (A). The nuclear accumulation dataset for each nucleus (>30 for each condition) was separately fitted to a single-exponential curve, and the derivative at time t = 0 representing the initial nuclear translocation rate were computed. Asterisks (*) denote a significant difference in median value from the 3xGFP rate using the Mann-Whitney U test (p<0.01). Box plots show the median, first and third quartiles, and non-outlier extrema. Values greater than six standard deviations from the mean are marked as outliers. DOI:
http://dx.doi.org/10.7554/eLife.00745.011
Figure 6—figure supplement 1.. Effect of RanGTP on the nuclear translocation kinetics of Nup188 and Nup192.
(A) Nuclear translocation kinetics of the scaffold nucleoporins in permeabilized HeLa cells pre-incubated with Ran and an energy-regenerating system were obtained as described in Figure 6A. The kinetic plots for _Mt_Nup188 and _Mt_Nup192 from Figure 6A obtained without a Ran pre-wash are shown as a reference. (B) Quantitative analysis of the initial nuclear translocation rates for the experiments described in (A). The analysis was performed as described in Figure 6B. The asterisk (*) denotes a significant difference in median values in YFP-_Mt_Nup188 translocation rates between the no Ran pre-wash and Ran pre-wash conditions using the Mann-Whitney U test (p<0.01). Box plots show the median, first and third quartiles, and non-outlier extrema. DOI:
http://dx.doi.org/10.7554/eLife.00745.012
Figure 6—figure supplement 2.. Nuclear accumulation of Nup188 and Nup192 upon 10-fold dilution.
YFP-_Mt_Nup188, YFP-_Mt_Nup192, YFP-_Hs_Importin-β and 3xGFP were allowed to translocate into the nuclei of permeabilized HeLa cells for 15 min, and then their nuclear fluorescence was followed after a 10-fold dilution with transport buffer as described in Figure 6A. Note that unlike YFP-_Hs_Importin-β and 3xGFP, YFP-_Mt_Nup188 and YFP-_Mt_Nup192 continue to accumulate even after the 10-fold dilution. DOI:
http://dx.doi.org/10.7554/eLife.00745.013
Similar articles
- Architecture of the linker-scaffold in the nuclear pore.
Petrovic S, Samanta D, Perriches T, Bley CJ, Thierbach K, Brown B, Nie S, Mobbs GW, Stevens TA, Liu X, Tomaleri GP, Schaus L, Hoelz A. Petrovic S, et al. Science. 2022 Jun 10;376(6598):eabm9798. doi: 10.1126/science.abm9798. Epub 2022 Jun 10. Science. 2022. PMID: 35679425 Free PMC article. - Analysis of the yeast nucleoporin Nup188 reveals a conserved S-like structure with similarity to karyopherins.
Flemming D, Devos DP, Schwarz J, Amlacher S, Lutzmann M, Hurt E. Flemming D, et al. J Struct Biol. 2012 Jan;177(1):99-105. doi: 10.1016/j.jsb.2011.11.008. Epub 2011 Nov 22. J Struct Biol. 2012. PMID: 22138091 - Evidence for an evolutionary relationship between the large adaptor nucleoporin Nup192 and karyopherins.
Stuwe T, Lin DH, Collins LN, Hurt E, Hoelz A. Stuwe T, et al. Proc Natl Acad Sci U S A. 2014 Feb 18;111(7):2530-5. doi: 10.1073/pnas.1311081111. Epub 2014 Feb 6. Proc Natl Acad Sci U S A. 2014. PMID: 24505056 Free PMC article. - Flexible gates: dynamic topologies and functions for FG nucleoporins in nucleocytoplasmic transport.
Terry LJ, Wente SR. Terry LJ, et al. Eukaryot Cell. 2009 Dec;8(12):1814-27. doi: 10.1128/EC.00225-09. Epub 2009 Oct 2. Eukaryot Cell. 2009. PMID: 19801417 Free PMC article. Review. - The selective permeability barrier in the nuclear pore complex.
Li C, Goryaynov A, Yang W. Li C, et al. Nucleus. 2016 Sep 2;7(5):430-446. doi: 10.1080/19491034.2016.1238997. Epub 2016 Sep 27. Nucleus. 2016. PMID: 27673359 Free PMC article. Review.
Cited by
- Pleiotropic requirements for human TDP-43 in the regulation of cell and organelle homeostasis.
Roczniak-Ferguson A, Ferguson SM. Roczniak-Ferguson A, et al. Life Sci Alliance. 2019 Sep 16;2(5):e201900358. doi: 10.26508/lsa.201900358. Print 2019 Oct. Life Sci Alliance. 2019. PMID: 31527135 Free PMC article. - The nuclear pore complex: understanding its function through structural insight.
Beck M, Hurt E. Beck M, et al. Nat Rev Mol Cell Biol. 2017 Feb;18(2):73-89. doi: 10.1038/nrm.2016.147. Epub 2016 Dec 21. Nat Rev Mol Cell Biol. 2017. PMID: 27999437 Review. - Architecture of the cytoplasmic face of the nuclear pore.
Bley CJ, Nie S, Mobbs GW, Petrovic S, Gres AT, Liu X, Mukherjee S, Harvey S, Huber FM, Lin DH, Brown B, Tang AW, Rundlet EJ, Correia AR, Chen S, Regmi SG, Stevens TA, Jette CA, Dasso M, Patke A, Palazzo AF, Kossiakoff AA, Hoelz A. Bley CJ, et al. Science. 2022 Jun 10;376(6598):eabm9129. doi: 10.1126/science.abm9129. Epub 2022 Jun 10. Science. 2022. PMID: 35679405 Free PMC article. - Stoichiometry and compositional plasticity of the yeast nuclear pore complex revealed by quantitative fluorescence microscopy.
Rajoo S, Vallotton P, Onischenko E, Weis K. Rajoo S, et al. Proc Natl Acad Sci U S A. 2018 Apr 24;115(17):E3969-E3977. doi: 10.1073/pnas.1719398115. Epub 2018 Apr 9. Proc Natl Acad Sci U S A. 2018. PMID: 29632211 Free PMC article. - The Nuclear Pore Complex as a Flexible and Dynamic Gate.
Knockenhauer KE, Schwartz TU. Knockenhauer KE, et al. Cell. 2016 Mar 10;164(6):1162-1171. doi: 10.1016/j.cell.2016.01.034. Cell. 2016. PMID: 26967283 Free PMC article. Review.
References
Publication types
MeSH terms
Substances
Grants and funding
- R01 GM077537/GM/NIGMS NIH HHS/United States
- T32 GM008295/GM/NIGMS NIH HHS/United States
- U54 CA143836/CA/NCI NIH HHS/United States
- U54CA143836/CA/NCI NIH HHS/United States
- R01GM058065/GM/NIGMS NIH HHS/United States
- R01GM077537/GM/NIGMS NIH HHS/United States
- P41 RR015301/RR/NCRR NIH HHS/United States
- R01 GM058065/GM/NIGMS NIH HHS/United States
LinkOut - more resources
Full Text Sources
Other Literature Sources
Molecular Biology Databases
