USP18 inhibits NF-κB and NFAT activation during Th17 differentiation by deubiquitinating the TAK1-TAB1 complex - PubMed (original) (raw)
USP18 inhibits NF-κB and NFAT activation during Th17 differentiation by deubiquitinating the TAK1-TAB1 complex
Xikui Liu et al. J Exp Med. 2013.
Abstract
Reversible ubiquitin modification of cell signaling molecules has emerged as a critical mechanism by which cells respond to extracellular stimuli. Although ubiquitination of TGF-β-activated kinase 1 (TAK1) is critical for NF-κB activation in T cells, the regulation of its deubiquitination is unclear. We show that USP18, which was previously reported to be important in regulating type I interferon signaling in innate immunity, regulates T cell activation and T helper 17 (Th17) cell differentiation by deubiquitinating the TAK1-TAB1 complex. USP18-deficient T cells are defective in Th17 differentiation and Usp18(-/-) mice are resistant to experimental autoimmune encephalomyelitis (EAE). In response to T cell receptor engagement, USP18-deficient T cells exhibit hyperactivation of NF-κB and NFAT and produce increased levels of IL-2 compared with the wild-type controls. Importantly, USP18 is associated with and deubiquitinates the TAK1-TAB1 complex, thereby restricting expression of IL-2. Our findings thus demonstrate a previously uncharacterized negative regulation of TAK1 activity during Th17 differentiation, suggesting that USP18 may be targeted to treat autoimmune diseases.
Figures
Figure 1.
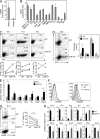
USP18KO cells defects in Th17 generation in vitro. (A) Naive CD4+ T cells were sorted by flow cytometry (gated on CD4+CD25−CD44lowCD62Lhigh) and stimulated with anti-CD3 and APC from WT or mice lacking B7.1, B7.2, and B7h to generate effector or tolerant T cells. After 5 d of culture, cells were washed and stimulated with anti-CD3 for 5 h, followed by real-time PCR analysis. (B) CD4+ and CD8+ T cells, memory (gated on CD4+CD25−CD44lowCD62Lhigh), nT reg cells (CD4+CD25+CD44−CD62L−), and B220+ B cells were sorted by flow cytometry from splenocytes. BMDCs and BMDMs were differentiated from BM progenitor cells with GM-CSF or M-CSF. Th0, Th1, Th2, iT reg, and Th17 cells were prepared by culturing naive cells in these polarizing conditions for 5 d, followed by stimulation with anti-CD3 for 24 h, followed by real-time analysis or by PMA and ionomycin for 5 h, followed by intracellular cytokine staining (not depicted) to examine the differentiation efficiency. (C) WT and USP18KO (KO) naive CD4+ T cells were cultured under different polarizing conditions for 4 d. Cells were washed and stimulated with PMA plus ionomycin in the presence of Golgi stop for 5 h, followed by intracellular staining of the indicated antibodies. (D–F) Naive CD4+ T cells from WT or USP18KO (KO) mice were purified and stimulated with anti-CD3/CD28 for 4 d. Cells were washed and stimulated with PMA plus ionomycin for 5 h, followed by intracellular cytokine staining (left plots), with anti-CD3 for 24 h for ELISA (right graph; D), or with anti-CD3 for 4 h for real-time PCR analysis (E), or stained with anti-IFNGR1 and -IFNGR2 (F). (G) Naive CD4+ T cells from WT or USP18KO (KO) mice were purified and cultured under Th17 polarizing conditions (anti-CD3/CD28, TGF-β, and IL-6) for 4 d. Cells were stimulated with PMA and ionomycin for 5 h followed by flow cytometry analysis. (H) Naive CD4+ T cells from WT or USP18KO (KO) mice were differentiated under Th17 condition for 48 h. Cells were harvested and real-time PCR analysis was performed to determine the mRNA levels of the indicated cytokines. The level of the lower sample for each gene was set at 1 for comparison. Data are representative from two (A and B) or at least three independent experiments (C–H). Bar graphs show mean ± SD, n = 3. *, P < 0.05; **, P < 0.01 (unpaired Student’s t test).
Figure 2.
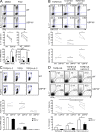
Blockage of IL-2 partially restores Th17 generation defects of USP18KO cells. Naive CD4+ T cells from WT or USP18KO (KO) mice were sorted by flow cytometry and differentiated into Th17 or iT reg cells under various conditions. (A) Cells were cultured with TGF-β and IL-6 in the presence or absence of the AHR agonist FICZ for 4 d, followed either by PMA/ion stimulation and intracellular staining analysis or by anti-CD3 stimulation and real-time PCR analysis. (B) Cells were cultured with the indicated cytokines for 4 d, followed by PMA/ion stimulation and intracellular staining analysis. (C) Cells were cultured with TGF-β alone or TGF-β with IL-2 or anti–IL-2 for 4 d, followed either by PMA/ion stimulation and intracellular staining analysis or by anti-CD3 stimulation and real-time PCR analysis. (D) Cells were cultured with TGF-β plus IL-6 in the presence of anti–IFN-γ or anti–IL-2 for 4 d, followed either by PMA/ion stimulation and intracellular staining analysis or by anti-CD3 stimulation and ELISA analysis. Staining data shown are representatives of three or four independent experiments (paired Student’s t test). Bar graphs show mean ± SD, n = 3. *, P < 0.05; **, P < 0.01 (unpaired Student’s t test).
Figure 3.
USP18KO T cells are hyperactive and defect in Th17 generation after KLH immunization. WT and USP18KO (KO) mice were immunized with KLH in CFA subcutaneously. 7 d later, the mice were killed and splenocytes were restimulated with KLH. Cytokines and proliferation were measured at 72 h with [3H]thymidine added at the last 7 h of culture. The data are representative of two individual experiments (n = 5). Graphs show mean ± SD, n = 5. *, P < 0.05; **, P < 0.01 (unpaired Student’s t test).
Figure 4.
USP18KO mice are resistant to EAE induction. WT and USP18KO (KO) mice were induced EAE through immunization with MOG emulsified in CFA. (A) The mice were monitored daily for EAE syndrome. (B) CNS infiltrates from EAE mice were isolated on day 12 after the second immunization and stained for various surface markers (CD4, CD8, CD11b, B220, or CD11c) and the absolute numbers of different types of cells were calculated. (C) CNS infiltrates were stimulated with PMA/ion plus golgi stop for 6 h, followed by surface staining for CD4 and intracellular staining for IL-17, IFN-γ, GM-CSF, or Foxp3, and the numbers of different cell populations were calculated. (D) Brain or spinal cord from EAE mice were sectioned and stained with luxol fast blue (LFB) or hematoxylin and eosin (H&E). Bars, 200 µM. (E) Cells from draining lymph nodes of the EAE mice were stimulated with 50 µg/ml MOG for 20 h and treated with golgi stop for 6 h, followed by surface (CD4) and intracellular (IL-17, IFN-γ, GM-CSF, and Foxp3) staining. The absolute numbers of different cell populations were calculated. (F) Splenocytes from EAE mice were stimulated with 50 µg/ml MOG for 20 h and treated with golgi stop for 6 h, followed by surface (CD4) and intracellular (IL-17, IFN-γ, GM-CSF, and Foxp3) staining. Splenocytes from the EAE mice were stimulated with the indicated concentrations of MOG peptide, and cytokine expression levels in the supernatants were measured by ELISA at 72 h after culture. Data shown are representative of at least three independent experiments. Graphs show mean ± SD, n = 5. *, P < 0.05; **, P < 0.01 (unpaired Student’s t test).
Figure 5.
USP18 regulates Th17 differentiation and EAE development in a T cell–intrinsic manner. (A) CD4+ T cells from WT or USP18 KO (KO) mice were transferred into Rag−/− mice followed by EAE induction and the mice were monitored daily for EAE syndrome. (B) CNS infiltrates were stimulated with PMA/ion plus golgi stop for 6 h, followed by surface staining for CD4 and intracellular staining for IL-17 and IFN-γ, and the numbers of different cell populations were calculated. (C) Splenocytes from the EAE mice were stimulated with MOG peptide and cytokine expression levels in the supernatants were measured by ELISA at day 3 of culture. Data shown are a representative of three individual experiments. Graphs show mean ± SD, n = 5. *, P < 0.05; **, P < 0.01 (unpaired Student’s t test).
Figure 6.
USP18 regulates IL-2 expression in naive and Th17-polarizing cells. Naive CD4+ T cells were isolated from WT and USP18KO mice. (A) Cells were stimulated with plate-bound anti-CD3/CD28 for 24 h, and IL-2 protein levels in the culture supernatants were measured by ELISA. (B) Cells were stimulated with 2 µg/ml of plate-bound anti-CS3/CD28 and harvested at the indicated time points. Il2 mRNA was measured by real-time PCR analysis. (C) Cells were stimulated by plate-bound 4 µg/ml anti-CD3 and anti-CD28 with or without anti–IL-2 for 24 h before cells were harvested and lysed. The lysates were analyzed by immunoblot with the indicated antibodies. (D) Cells were polarized under Th17 conditions (TGF-β plus IL-6). On day 3, cells were washed and stimulated with plate-bound anti-CD3 for 4 h before real-time PCR was performed. (E) Cells were stained with 2.5 µM CFSE and cultured under the indicated Th17 polarizing conditions for 3 d. Cells were harvested and stimulated with PMA/ion for 5 h, followed by intracellular staining analysis. The percentages of low CFSE cells were statistically analyzed (paired Student’s t test). Data shown are representatives of at least three individual experiments. Graphs show mean ± SD, n = 3. *, P < 0.05; **, P < 0.01 (unpaired Student’s t test).
Figure 7.
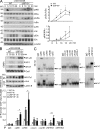
USP18 deficiency results in hyperactivation of NF-κB, JNK, and NFAT after TCR stimulation. Naive CD4+ T cells were isolated from WT or USP18KO (KO) mice and rested in complete medium for overnight at 4°C. Cells were warmed at 37°C for 2 h, followed by various experiments. (A) Cells were stimulated with cross-linked anti-CD3/CD28 for the indicated time points followed by immunoblot assays with antibodies against the indicated proteins. The expression intensities of pIKK, IKKα, pIκBα, and IκBα were quantified and the ratios of pIKK/IKKα and pIκBα/IκBα were calculated. (B) Cells were stimulated with cross-linked anti-CD3/CD28 for the indicated time points. Nuclear extracts were subjected to wither EMSA or Western blot to determine the activity of NF-κB, AP-1, and NFAT. Oct-1 and Lamin B were included as loading controls, respectively. (C) USP18KO CD4+ T cells were stimulated with cross-linked anti-CD3/CD28 for 30 min or 4 h. Nuclear extracts were incubated with antibodies against NF-κB, AP-1, or NFAT followed by supershift assays. Stars indicate shifted probes and arrowheads indicate unshifted probes. (D) Cells were left untreated or stimulated with cross-linked anti-CD3/CD28 for 4 h, followed by ChIP assay with the indicated antibodies and real-time PCR analysis. Data shown are representatives of three (A) and two (B–D) independent experiments. Graphs show mean ± SD, n = 5. *, P < 0.05; **, P < 0.01 (unpaired Student’s t test).
Figure 8.
USP18 interacts with the TAK1–TAB complex. (A) TAK1 was isolated by immunoprecipitation from cells stimulated with anti-CD3/CD28 for the indicated time points, followed by kinase assay using recombinant MKK6 as a substrate. The intensities of the indicated proteins were quantified and the ratio of pMEKK6/TAK1 was calculated. (B) 293T cells were transfected with the indicated plasmids. 24 h later, cells were lysed and immunoprecipitation was performed with anti-Flag. The immunoprecipitants were analyzed by immunoblot with the indicated antibodies. The expression levels of TAK1 in the lysates were analyzed by immunoblot with anti-HA. (C) Jurkat T cells were stimulated with PMA and ionomycin for the indicated time points, followed by immunoprecipitation by control IgG (Ig) or anti-USP18 (αUSP18). The immunoprecipitants were analyzed by immunoblot with antibodies against the indicated proteins. The expression levels of CARMA1, TAK1, TAB1, TAB2, and Actin were analyzed by immunoblot with antibodies against the indicated proteins. Data shown are representatives of three (A and B) and two (C) independent experiments. Graphs show mean ± SD, n = 3. *, P < 0.05; **, P < 0.01 (unpaired Student’s t test).
Figure 9.
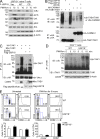
USP18 catalyzes deubiquitination of TAK1. (A) Naive CD4+ T cells from USP18KO were sorted and transfected with empty vector (Vec), Flag-tagged USP18 (WT), or USP18(C61S) (CS). The transfected cells were sorted and stimulated with PMA and ionomycin (PMA/ion) for 10 min, followed by immunoblot analysis with antibodies against the indicated proteins. (B) 293T cells were transfected with USP18 together with HA-tagged TAK1 and TAB1, or CARMA1. TAK1 complex and CARMA1 were isolated by immunoprecipitation with anti-HA, followed by immunoblot analysis with anti-ubiquitin (αUb). The expression levels of TAK1, TAB1, and CARMA1 in lysates were analyzed by immunoblot with anti-HA. (C) 293T cells were transfected with HA-TAK1 with or without Myc-TAB1. The HA–TAK1 complex was immunoprecipitated with anti-HA. Flag-USP18 was purified by immunoprecipitation with anti-Flag agarose followed by elution with Flag peptide from 293T cells transfected with Flag-USP18. The immunoprecipitants were incubated with or with out Flag-USP18 protein followed by immunoblot with anti-HA or anti-ubiquitin (αUb). (D) WT and USP18KO (KO) CD4+ T cells were stimulated with PMA/ion for the indicated time points. The cells were lysed and cell lysates were immunoprecipitated with anti-TAK1. The immunoprecipitants were analyzed with anti-ubiquitin or anti-TAK1. The expression levels of β-actin were analyzed by immunoblot. (E) Splenocytes from WT and USP18KO (KO) mice left untreated or stimulated with PMA and ionomycin for 5 h were stained with fluorescence-labeled anti-CD4, CD44, CD69, and CD62L, followed by flow cytometry analysis. The flow blots show one representative of WT and KO mice, respectively. Graphs show mean ± SD, n = 4. Data shown are representatives of three (A–C) and two (D and E) independent experiments.
Similar articles
- Dual-specificity phosphatase 14 (DUSP14/MKP6) negatively regulates TCR signaling by inhibiting TAB1 activation.
Yang CY, Li JP, Chiu LL, Lan JL, Chen DY, Chuang HC, Huang CY, Tan TH. Yang CY, et al. J Immunol. 2014 Feb 15;192(4):1547-57. doi: 10.4049/jimmunol.1300989. Epub 2014 Jan 8. J Immunol. 2014. PMID: 24403530 - USP18 negatively regulates NF-κB signaling by targeting TAK1 and NEMO for deubiquitination through distinct mechanisms.
Yang Z, Xian H, Hu J, Tian S, Qin Y, Wang RF, Cui J. Yang Z, et al. Sci Rep. 2015 Aug 4;5:12738. doi: 10.1038/srep12738. Sci Rep. 2015. PMID: 26240016 Free PMC article. - Regulation of TAK-TAB Complex Activation through Ubiquitylation.
Zhang J, Cao L, Lyu L, Qi W, Yang W, Ren R, Kao C, Zhang Y, Zhang C, Zhang M. Zhang J, et al. Front Biosci (Landmark Ed). 2024 Apr 29;29(5):169. doi: 10.31083/j.fbl2905169. Front Biosci (Landmark Ed). 2024. PMID: 38812304 Review. - Post-Translational Modifications of the TAK1-TAB Complex.
Hirata Y, Takahashi M, Morishita T, Noguchi T, Matsuzawa A. Hirata Y, et al. Int J Mol Sci. 2017 Jan 19;18(1):205. doi: 10.3390/ijms18010205. Int J Mol Sci. 2017. PMID: 28106845 Free PMC article. Review.
Cited by
- Suppression of USP18 Potentiates the Anti-HBV Activity of Interferon Alpha in HepG2.2.15 Cells via JAK/STAT Signaling.
Li L, Lei QS, Zhang SJ, Kong LN, Qin B. Li L, et al. PLoS One. 2016 May 26;11(5):e0156496. doi: 10.1371/journal.pone.0156496. eCollection 2016. PLoS One. 2016. PMID: 27227879 Free PMC article. - USP18-deficiency in cervical carcinoma is crucial for the malignant behavior of tumor cells in an ERK signal-dependent manner.
Pan A, Li Y, Guan J, Zhang P, Zhang C, Han Y, Zhang T, Cheng Y, Sun L, Lu S, Weng J, Ren Q, Fan S, Wang W, Wang J. Pan A, et al. Oncol Lett. 2021 May;21(5):421. doi: 10.3892/ol.2021.12682. Epub 2021 Mar 29. Oncol Lett. 2021. PMID: 33850562 Free PMC article. - NF-κB Activation in T Helper 17 Cell Differentiation.
Park SH, Cho G, Park SG. Park SH, et al. Immune Netw. 2014 Feb;14(1):14-20. doi: 10.4110/in.2014.14.1.14. Epub 2014 Feb 21. Immune Netw. 2014. PMID: 24605076 Free PMC article. - TRAF5-mediated Lys-63-linked Polyubiquitination Plays an Essential Role in Positive Regulation of RORγt in Promoting IL-17A Expression.
Wang X, Yang J, Han L, Zhao K, Wu Q, Bao L, Li Z, Lv L, Li B. Wang X, et al. J Biol Chem. 2015 Nov 27;290(48):29086-94. doi: 10.1074/jbc.M115.664573. Epub 2015 Oct 9. J Biol Chem. 2015. PMID: 26453305 Free PMC article. - Ubiquitin-specific protease: an emerging key player in cardiomyopathy.
Li D, Ma Q. Li D, et al. Cell Commun Signal. 2025 Mar 18;23(1):143. doi: 10.1186/s12964-025-02123-0. Cell Commun Signal. 2025. PMID: 40102846 Free PMC article. Review.
References
Publication types
MeSH terms
Substances
Grants and funding
- AI050848/AI/NIAID NIH HHS/United States
- P30 CA016672/CA/NCI NIH HHS/United States
- R56 AI050761/AI/NIAID NIH HHS/United States
- AI50761/AI/NIAID NIH HHS/United States
- R56 AI050848/AI/NIAID NIH HHS/United States
- R56 GM065899/GM/NIGMS NIH HHS/United States
- R01 AR050772/AR/NIAMS NIH HHS/United States
- R01 AI050848/AI/NIAID NIH HHS/United States
- R01 AI050761/AI/NIAID NIH HHS/United States
- GM065899/GM/NIGMS NIH HHS/United States
- R01 GM065899/GM/NIGMS NIH HHS/United States
- AR050772/AR/NIAMS NIH HHS/United States
LinkOut - more resources
Full Text Sources
Other Literature Sources
Molecular Biology Databases
Miscellaneous


