The exomes of the NCI-60 panel: a genomic resource for cancer biology and systems pharmacology - PubMed (original) (raw)
. 2013 Jul 15;73(14):4372-82.
doi: 10.1158/0008-5472.CAN-12-3342. Epub 2013 Jul 15.
Eric C Polley, Sean R Davis, Yuelin J Zhu, Sven Bilke, Robert L Walker, Marbin Pineda, Yevgeniy Gindin, Yuan Jiang, William C Reinhold, Susan L Holbeck, Richard M Simon, James H Doroshow, Yves Pommier, Paul S Meltzer
Affiliations
- PMID: 23856246
- PMCID: PMC4893961
- DOI: 10.1158/0008-5472.CAN-12-3342
The exomes of the NCI-60 panel: a genomic resource for cancer biology and systems pharmacology
Ogan D Abaan et al. Cancer Res. 2013.
Abstract
The NCI-60 cell lines are the most frequently studied human tumor cell lines in cancer research. This panel has generated the most extensive cancer pharmacology database worldwide. In addition, these cell lines have been intensely investigated, providing a unique platform for hypothesis-driven research focused on enhancing our understanding of tumor biology. Here, we report a comprehensive analysis of coding variants in the NCI-60 panel of cell lines identified by whole exome sequencing, providing a list of possible cancer specific variants for the community. Furthermore, we identify pharmacogenomic correlations between specific variants in genes such as TP53, BRAF, ERBBs, and ATAD5 and anticancer agents such as nutlin, vemurafenib, erlotinib, and bleomycin showing one of many ways the data could be used to validate and generate novel hypotheses for further investigation. As new cancer genes are identified through large-scale sequencing studies, the data presented here for the NCI-60 will be an invaluable resource for identifying cell lines with mutations in such genes for hypothesis-driven research. To enhance the utility of the data for the greater research community, the genomic variants are freely available in different formats and from multiple sources including the CellMiner and Ingenuity websites.
©2013 AACR.
Conflict of interest statement
Conflict-of-interest: Authors declare no competing financial interests.
Figures
Figure 1. Results of WES variant calling
(A) Variant counts for each cell line from each tumor type are plotted for Type 1 and Type 2 fraction as green squares and red diamonds, respectively. Within each tumor type, the variant counts are sorted from lowest to highest, and a box blot is superimposed to demonstrate subgroup mean and spread. Microsatellite unstable cell lines are marked with a red asterisk. (B) Base transition-to-transversion (ti/tv) ratio is plotted for each tumor type in the NCI-60 panel for Type 2 variants that may likely be tumor specific. The y-axis represents the fraction of base conversions from a C:G or a T:A base pair to any other possible base pair change, which cumulatively equals 1. See also Figure S1 for additional details.
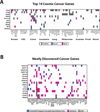
Figure 2. Mutation spectrum for the Top 10 most frequently mutated genes and novel cancer related genes in the NCI-60
(A) The Top 10 Cosmic Census Cancer genes (sorted by the number of occurrences in the NCI-60 panel) were scored for the presence of mutations in each cell line. Gray marks variants annotated in the COSMIC v59 database. Blue marks variants that are not in the COSMIC database but identified in the current study and predicted to be of deleterious in nature (either sift score < 0.05 or polyphen2 score > 0.85). Magenta marks cases where a cell lines harbors at least one COSMIC annotated and at least one novel variant in a particular gene (a gray and a blue mark). (B) New cancer genes identified in recent large-scale sequencing studies such as: SETD2 (38), LRP1B (39, 40), PBRM1 (41), SPTA1 (42), DNMT3A (43), ARID1A (44), GRIN2A (45), TRRAP (45), STAG2 (46), EPHA3/5/7 (39), POLE (21), and SYNE1 (47). Blue boxes represent likely loss-of-function mutations (e.g. nonsense, splice site, initiation loss, and frame shift insertions or deletions) while magenta indicates missense mutations. Cases with co-occurrence of both types are labeled in gray.
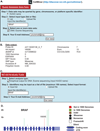
Figure 3. Snapshot from the Cell-miner Website
Figure 3: Snapshot from the Cell-miner Website. (A) To access tabular data, first click on the “Query Genomic Data Sets” tab. Specify data you want by: i) identifying the query type in Step 1 (HUGO name is required); ii) choosing whether you wish to type in your identifier, or upload your identifier(s) as a file in Step 2; iii) identifying the data set being queried in Step 3 (in this case exome sequencing); iv) entering your E-mail address in Step 6; and clicking “Get data”. (B) The tabular data sent to you will include a full set of the data for all 60 cell lines (only one cell line is included for reasons of space). Within the output, i) The probe ID denotes the chromosome number, start location, and the nucleotide change, ii) AA is amino acid, iii) dbSNP id iv) allele frequency in 1000-genomes, v) allele frequency in ESP5400, vi) SIFT score, vii) NCBI accession number, viii) Polyphen2 score. (C) To access graphical data, first click on the “NCI-60 Analysis Tools” tab. Choose the graphical output tool by, i) clicking “Graphical output for DNA:Exome sequencing” in Step 1; ii) choosing whether you wish to type in a your identifier, or upload your identifier(s) as a file in Step 2; iii) identifying the gene being queried, also in Step 2; iv) entering your E-mail address in Step 3; and clicking “Get data”. (D) The graphical data will be sent as an html, with accompanying pngs. The summary of all variants in BRAF is shown (individual cell lines are also included). The number of variants at each location are depicted by the vertical green, red, or brown lines.
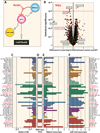
Figure 4. Correlation of TP53 wild-type cells with nutlin-3 and other p53 pathway modulators
(A) Schematic representation of the p53-MDM2 feedback loop with p53 acting as a positive transcription factor for MDM2 and microRNA-34a while nutlin-3 acts as an MDM2 antagonist (48), blocking MDM2-mediated p53 degradation and killing of wild-type p53 cell lines. (B) The volcano plots show the difference in mean log GI50 between the cell lines containing a type 2 variant in TP53 versus those cell lines not containing a variant along the x-axis and the −log10 p-value on the y-axis. Each red point represents one of the 15,989 compounds tested from the NCI screening data plus 310 approved and investigational drugs (green points). A magenta guideline is given at significant p-value 10−4. The NSC numbers or names for the statistically significant and for comparison some non-significant compounds are annotated on the plot. _TP53_-reactivating compounds from literature and in red. (C) Antiproliferative activity of nutlin-3 across the NCI-60 cell lines, where the bar graph is color coded by tissues of origins. (D) The TP53 wild-type cells are marked with horizontal bars and red thick-marks. (E) MDM2 expression is highest in the TP53 wild-type cells and those targeted by nutlin-3 (note mirror image profiles). (F) The expression profile of microRNA 34a, an established p53 target. See also Figure S6 for additional correlations.
Figure 5. Correlation between MAP kinase pathway mutations and drug response to compounds that target this pathway in the NCI-60 panel
(A) Receiver operating curves (ROC) for cross-validated drug predictors for melanoma cells. Cross-validated ROC curves are shown for each cell line. The inset reports the area under the ROC curve (AUC) for each cell line and the number of inactive drugs (n1) and active drugs (n2). (B) Same volcano plot as in Figure 4B, for BRAF variants. A magenta guideline is given at significant p-value 10−4. The NSC numbers or names for the statistically significant and for comparison some nonsignificant compounds are annotated on the plot. Drug response for (C) the BRAF V600E inhibitor vemurafenib, (D) the MEK inhibitor selumetinib and (E) the MEK/ERK inhibitor hypothemycin. Cell lines with mutations are labeled in red for the gene(s) indicated to the right. (F) Heat map showing correlations between mutations in key signaling intermediates (PTEN, PIK3R1, PIK3CA, ERBB2, BRAF and NRAS) versus drugs that target these pathways; MAPK pathway inhibitors (blue), PI3K pathway inhibitors (green), EGFR/ERBB inhibitors (magenta). Values for each drug represent the mean GI50 for each cell line with the particular gene mutations, including previously published deletions and small mutations (49). The number of cell lines with the particular mutation is given in parentheses.
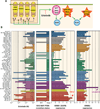
Figure 6. Correlation between erlotinib response and EGFR pathway gene expression and RAS-RAF-PTEN mutations in the NCI-60 panel
(A) Schematic representation of the EGFR pathway with its four components: ERBB1 (EGFR), ERBB2, ERBB3 and ERBB4. Dimerization complexes are indicated as nodes on the double-ended arrows according the Kohn’s MIM nomenclature convention (50). Activations are shown as green arrows. Activating mutations of RAS or RAF directly activate MEK and render cells resistant to erlotinib (33). Similarly, inactivation of PTEN confers resistance by direct activation of PI3 kinase. (B) Left: antiproliferative activity of erlotinib across the NCI-60. The cell lines are color-coded by tissues of origins. Center left: The RAS-RAF-PTEN wild-type (WT) cells are marked as full horizontal bars. Mutant cells (Mut) are shown as short bars. Center right: ERBB1 expression is highest in many of the cells targeted by erlotinib (note mirror image profiles). Far right: ERBB2 expression profile. The cell lines identified by arrows have focal amplification for ERBB1 (RE:SN12C) and ERBB2 (OV:SKOV3) (unpublished data).
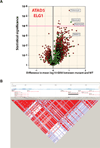
Figure 7. ATAD5 locus as a response-modifier for DNA-damaging agents
(A) Same volcano plot as in Figure 4B, for ATAD5 delCAATGG (rs72427574). A magenta guideline is given at significant p-value 10−4. The names for the statistically significant compounds are annotated on the plot. (B) Linkage disequilibrium (LD) plot characterizing haplotype blocks in the ATAD5 locus. The black bar marks the ATAD5 gene location. The haplotype blocks were created using HaploView program (51), version 4.2
Similar articles
- NCI-60 whole exome sequencing and pharmacological CellMiner analyses.
Reinhold WC, Varma S, Sousa F, Sunshine M, Abaan OD, Davis SR, Reinhold SW, Kohn KW, Morris J, Meltzer PS, Doroshow JH, Pommier Y. Reinhold WC, et al. PLoS One. 2014 Jul 17;9(7):e101670. doi: 10.1371/journal.pone.0101670. eCollection 2014. PLoS One. 2014. PMID: 25032700 Free PMC article. - RNA Sequencing of the NCI-60: Integration into CellMiner and CellMiner CDB.
Reinhold WC, Varma S, Sunshine M, Elloumi F, Ofori-Atta K, Lee S, Trepel JB, Meltzer PS, Doroshow JH, Pommier Y. Reinhold WC, et al. Cancer Res. 2019 Jul 1;79(13):3514-3524. doi: 10.1158/0008-5472.CAN-18-2047. Epub 2019 May 21. Cancer Res. 2019. PMID: 31113817 Free PMC article. - Using CellMiner 1.6 for Systems Pharmacology and Genomic Analysis of the NCI-60.
Reinhold WC, Sunshine M, Varma S, Doroshow JH, Pommier Y. Reinhold WC, et al. Clin Cancer Res. 2015 Sep 1;21(17):3841-52. doi: 10.1158/1078-0432.CCR-15-0335. Epub 2015 Jun 5. Clin Cancer Res. 2015. PMID: 26048278 Free PMC article. Review. - Pan-cancer pharmacogenetics: targeted sequencing panels or exome sequencing?
Tilleman L, Heindryckx B, Deforce D, Van Nieuwerburgh F. Tilleman L, et al. Pharmacogenomics. 2020 Oct;21(15):1073-1084. doi: 10.2217/pgs-2020-0035. Epub 2020 Oct 6. Pharmacogenomics. 2020. PMID: 33019866 - In vitro human cell line models to predict clinical response to anticancer drugs.
Niu N, Wang L. Niu N, et al. Pharmacogenomics. 2015;16(3):273-85. doi: 10.2217/pgs.14.170. Pharmacogenomics. 2015. PMID: 25712190 Free PMC article. Review.
Cited by
- Integrative pan cancer analysis reveals epigenomic variation in cancer type and cell specific chromatin domains.
Gopi LK, Kidder BL. Gopi LK, et al. Nat Commun. 2021 Mar 3;12(1):1419. doi: 10.1038/s41467-021-21707-1. Nat Commun. 2021. PMID: 33658503 Free PMC article. - Benzylamine and Thenylamine Derived Drugs Induce Apoptosis and Reduce Proliferation, Migration and Metastasis Formation in Melanoma Cells.
Mojena M, Povo-Retana A, González-Ramos S, Fernández-García V, Regadera J, Zazpe A, Artaiz I, Martín-Sanz P, Ledo F, Boscá L. Mojena M, et al. Front Oncol. 2018 Aug 23;8:328. doi: 10.3389/fonc.2018.00328. eCollection 2018. Front Oncol. 2018. PMID: 30191142 Free PMC article. - Cancer Genetic Network Inference Using Gaussian Graphical Models.
Zhao H, Duan ZH. Zhao H, et al. Bioinform Biol Insights. 2019 Apr 8;13:1177932219839402. doi: 10.1177/1177932219839402. eCollection 2019. Bioinform Biol Insights. 2019. PMID: 31007526 Free PMC article. - Mutation Screening of 1,237 Cancer Genes across Six Model Cell Lines of Basal-Like Breast Cancer.
Olsson E, Winter C, George A, Chen Y, Törngren T, Bendahl PO, Borg Å, Gruvberger-Saal SK, Saal LH. Olsson E, et al. PLoS One. 2015 Dec 15;10(12):e0144528. doi: 10.1371/journal.pone.0144528. eCollection 2015. PLoS One. 2015. PMID: 26670335 Free PMC article. - Pools and Pols: Mechanism of a mutator phenotype.
Sohl CD, Ray S, Sweasy JB. Sohl CD, et al. Proc Natl Acad Sci U S A. 2015 May 12;112(19):5864-5. doi: 10.1073/pnas.1505169112. Epub 2015 Apr 30. Proc Natl Acad Sci U S A. 2015. PMID: 25931524 Free PMC article. No abstract available.
References
- Shoemaker RH. The NCI60 human tumour cell line anticancer drug screen. Nat Rev Cancer. 2006;6:813–823. - PubMed
- Weinstein JN. Drug discovery: Cell lines battle cancer. Nature. 2012;483:544–545. - PubMed
- Scherf U, Ross DT, Waltham M, Smith LH, Lee JK, Tanabe L, et al. A gene expression database for the molecular pharmacology of cancer. Nat Genet. 2000;24:236–244. - PubMed
- Szakacs G, Annereau JP, Lababidi S, Shankavaram U, Arciello A, Bussey KJ, et al. Predicting drug sensitivity and resistance: profiling ABC transporter genes in cancer cells. Cancer Cell. 2004;6:129–137. - PubMed
Publication types
MeSH terms
Substances
Grants and funding
- UC2 HL103010/HL/NHLBI NIH HHS/United States
- RC2 HL102926/HL/NHLBI NIH HHS/United States
- HL-102924/HL/NHLBI NIH HHS/United States
- RC2 HL102924/HL/NHLBI NIH HHS/United States
- Z99 CA999999/ImNIH/Intramural NIH HHS/United States
- RC2 HL103010/HL/NHLBI NIH HHS/United States
- HL-102923/HL/NHLBI NIH HHS/United States
- RC2 HL102923/HL/NHLBI NIH HHS/United States
- UC2 HL102926/HL/NHLBI NIH HHS/United States
- UC2 HL102923/HL/NHLBI NIH HHS/United States
- UC2 HL102924/HL/NHLBI NIH HHS/United States
- RC2 HL102925/HL/NHLBI NIH HHS/United States
- UC2 HL102925/HL/NHLBI NIH HHS/United States
LinkOut - more resources
Full Text Sources
Other Literature Sources
Research Materials
Miscellaneous

