Probiotic bacteria reduce salmonella typhimurium intestinal colonization by competing for iron - PubMed (original) (raw)
Probiotic bacteria reduce salmonella typhimurium intestinal colonization by competing for iron
Elisa Deriu et al. Cell Host Microbe. 2013.
Abstract
Host inflammation alters the availability of nutrients such as iron to limit microbial growth. However, Salmonella enterica serovar Typhimurium thrives in the inflamed gut by scavenging for iron with siderophores. By administering Escherichia coli strain Nissle 1917, which assimilates iron by similar mechanisms, we show that this nonpathogenic bacterium can outcompete and reduce S. Typhimurium colonization in mouse models of acute colitis and chronic persistent infection. This probiotic activity depends on E. coli Nissle iron acquisition, given that mutants deficient in iron uptake colonize the intestine but do not reduce S. Typhimurium colonization. Additionally, the ability of E. coli Nissle to overcome iron restriction by the host protein lipocalin 2, which counteracts some siderophores, is essential, given that S. Typhimurium is unaffected by E. coli Nissle in lipocalin 2-deficient mice. Thus, iron availability impacts S. Typhimurium growth, and E. coli Nissle reduces S. Typhimurium intestinal colonization by competing for this limiting nutrient.
Copyright © 2013 Elsevier Inc. All rights reserved.
Figures
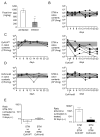
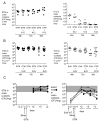
Figure 1. Probiotic E. coli Nissle 1917 reduces S. Typhimurium fecal shedding
(A) The concentration of iron in fecal samples collected from mock-infected (n = 4) or S. Typhimurium-infected (n = 4) C57BL/6 mice four days post-infection. Bars represent geometric means ± standard deviation. (B–E) 129X1/SvJ mice were infected with S. Typhimurium and either untreated (B) or treated with one dose of E. coli Nissle wild-type (C) or tonB mutant (D) three days after infection. S. Typhimurium (black circles), E. coli Nissle wild-type or tonB mutant (white circles) were enumerated in the colonic contents. (E) Ratio of colony forming units (CFU) recovered from fecal samples of mice infected with S. Typhimurium that were untreated compared with mice treated with one dose of either E. coli Nissle wild-type or tonB mutant three days after infection. Ratios 2 days after infection (i.e., 1 day before treatment) and 22 days after infection are shown. Bars represent geometric means ± standard deviation. Data are representative of n=2 experiments. STM=S. Typhimurium; EcN=E. coli Nissle. Significant difference is indicated by ** (P value ≤ 0.01). (See also Figure S1 and Table S1).
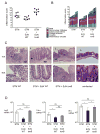
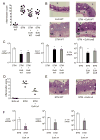
Figure 2. Intestinal host response in mice with persistent S. Typhimurium infection
129X1/SvJ mice were infected with S. Typhimurium and were either left untreated or were treated with one dose of E. coli Nissle wild-type or tonB mutant three days after infection. Cecal samples were collected at 6 or 22 days after infection. (A) Blinded histopathology scores of cecal samples at 22 days after infection. The score of individual mice (circles) and the geometric mean for each group (bars) are indicated. (B) A detailed scoring for the animals shown in (A) is provided. Each stacked column represents an individual mouse. (C) H&E stained sections from representative animals for each group. Although E. coli Nissle wild-type had no effect on inflammatory cell infiltration, mucosal integrity (assessed by cryptitis and surface erosions) was modestly improved. (D) Transcript levels of Lcn_2, Tnf-α_ and Inf-γ were determined in the ceca of 129X1/SvJ mice infected with S. Typhimurium (white bars), infected with S. Typhimurium and treated with either one dose of E. coli Nissle wild-type (black bars) or tonB mutant (gray bars) 3 days after infection. Samples were collected 6 days after infection. Data are expressed as fold-increase over mock-infected mice. Bars represent the geometric means ± standard deviation. STM=S. Typhimurium; EcN=E. coli Nissle; L; lumen, M, mucosa, SM; submucosa. Significant difference is indicated by * (P value ≤ 0.05) or ** (P value ≤ 0.01).
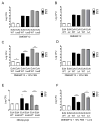
Figure 3. Growth of E. coli Nissle 1917 strains in iron-rich and iron-limited media
Growth of E. coli Nissle wild-type and the mutants in iron uptake tonB or iroN fuyA iutA chuA (Δ4) was determined. (A,C,E) Growth of E. coli Nissle wild-type and the tonB mutant in DMEM/F12 (A) or DMEM/F12 supplemented with 10% fetal bovine serum (C) or nutrient broth (NB) supplemented with Dipyridyl (E). (B,D,F) Growth of E. coli Nissle wild-type and the Δ4 mutant in DMEM/F12 (B) or DMEM/F12 supplemented with 10% fetal bovine serum with the absence (D) or presence (F) of 1μg/ml lipocalin-2 (Lcn2). Bacteria were enumerated at 2h, 5h, and 8h after inoculation. Bars represent the geometric means ± standard deviation of at least three experiments. STM=S. Typhimurium; EcN=E. coli Nissle. Significant differences are indicated by * (P value ≤ 0.05) or ** (P value ≤ 0.01). (See also Figure S2 and Table S2)
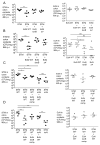
Figure 4. E. coli Nissle 1917 requires iron uptake systems to reduce S. Typhimurium intestinal colonization
(A,B) C57BL/6 mice were infected with S. Typhimurium alone or co-administered with either wild-type E. coli Nissle, the tonB mutant or the iroN fuyA iutA chuA mutant (Δ4). (C,D) C57BL/6 mice were infected with S. Typhimurium alone (wild-type or iroN mutant) or co-administered with either wild-type E. coli Nissle, the tonB mutant or the tonB mutant complemented in trans when indicated. CFU in colonic contents were enumerated at 48h (A,C) and 96h (B,D) after infection. S. Typhimurium (black circles) and E. coli Nissle (white circles) counts are shown. Representative experiments of n=2 are shown. STM=S. Typhimurium; EcN=E. coli Nissle. Significant difference is indicated by * (P value ≤ 0.05) or ** (P value ≤ 0.01). (See also Figure S3)
Figure 5. E. coli Nissle 1917 ameliorates intestinal inflammation during acute S. Typhimurium infection
(A) Blinded histopathology scores of cecal samples 4 days after infection of C57BL/6 mice administered wild-type E. coli Nissle, S. Typhimurium, or a mixture of S. Typhimurium and E. coli Nissle wild-type or tonB mutant. Scores of individual mice (circles) and geometric means for each group (bars) are indicated. (B) H&E stained sections from representative animals for each group. E. coli Nissle wild-type or tonB co-administration with S. Typhimurium reduced the density of inflammatory infiltrates (black asterisks) and the degree of crypt injury (white asterisks), compared to S. Typhimurium infection alone. (C) Transcript levels of Lcn_2, Cxcl-1_ and Il-17a were determined in the ceca of C57BL/6 mice infected with S. Typhimurium (white bars), a mixture of S. Typhimurium and wild-type E. coli Nissle (black bars), or a mixture of S. Typhimurium and E. coli Nissle tonB (gray bars). Data are expressed as fold-increase over mock-infected mice. Bars represent the geometric means ± standard deviation. (D) Blinded histopathology scores of cecal samples 4 days after infection of mice administered E. coli Nissle iroN fuyA iutA chuA (Δ4), S. Typhimurium, or a mixture of S. Typhimurium and E. coli Nissle Δ4. Scores of individual mice (circles) and geometric means for each group (bars) are indicated. (E) H&E stained sections from representative animals from each group. E. coli Nissle Δ4 co-administration with S. Typhimurium greatly reduced chronic inflammatory infiltrates (black asterisks) and the degree of crypt injury (white asterisks), compared to S. Typhimurium infection alone. (F) Transcript levels of Lcn_2, Cxcl-1_ and Il-17a were determined in the ceca of mice infected with S. Typhimurium (white bars) or a mixture of S. Typhimurium and E. coli Nissle Δ4 (gray bars). Data are expressed as fold-increase over mock-infected mice. Bars represent geometric means ± standard deviation. STM=S. Typhimurium; EcN=E. coli Nissle. L; lumen, M, mucosa, SM; submucosa. Significant difference is indicated by * (P value ≤ 0.05) or ** (P value ≤ 0.01). (See also Figure S4 and Table S3).
Figure 6. E. coli Nissle 1917 reduction of S. Typhimurium intestinal colonization requires functional lipocalin-2 and is independent of the time of administration
(A) C57BL/6 mice were infected with S. Typhimurium alone or co-administered with commensal E. coli K-12. CFU in colonic contents were enumerated at 48h, 72h and 96h post-infection. STM (black circles) and E. coli K-12 (white circles) counts are shown. (B) C57BL/6 Lcn2−/− mice were infected with S. Typhimurium alone or co-administered with wild-type E. coli Nissle. CFU in colonic contents were enumerated at 48h, 72h and 96h post-infection. S. Typhimurium (black circles) and E. coli Nissle (white circles) counts are shown. (C) C57BL/6 mice were administered a single dose of E. coli Nissle wild-type or mock, three days before being infected with S. Typhimurium. Streptomycin treatment was performed one day prior to S. Typhimurium infection. CFU in colonic contents were enumerated at 2, 3 and 4 days post-infection. S. Typhimurium (black circles) and E. coli Nissle (white circles) counts are shown. K12=E. coli K12; STM=S. Typhimurium; EcN=E. coli Nissle. (See also Figure S5).
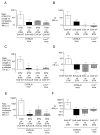
Figure 7. Ratios of S. Typhimurium and E. coli Nissle in the acute colitis model
Ratio of the CFU recovered from the fecal samples of mice infected with S. Typhimurium that were untreated in comparison with mice that were administered one dose of either E. coli Nissle wild-type, the tonB mutant, or the iroN fuyA iutA chuA (Δ4) mutant at the time of infection. (A, C, E) Ratio of S. Typhimurium CFU at 48 hours (A), 72 hours (C), 96 hours (E) post infection. (B, D, F) Competitive index (CI) in the indicated mixed infection was calculated by dividing the output ratio (E. coli Nissle CFU / S. Typhimurium CFU in the colonic contents of mice at the indicated time points by the input ratio (E. coli Nissle CFU / S. Typhimurium CFU). CI of the indicated E. coli Nissle strain versus S. Typhimurium at 48 hours (B), 72 hours (D), 96 hours (F) post infection. Bars represent geometric means ± standard deviation. Significant difference is indicated by * (P value ≤ 0.05) or ** (P value ≤ 0.01).
Comment in
- Intestinal irony: how probiotic bacteria outcompete bad bugs.
Weiss G. Weiss G. Cell Host Microbe. 2013 Jul 17;14(1):3-4. doi: 10.1016/j.chom.2013.07.003. Cell Host Microbe. 2013. PMID: 23870306
Similar articles
- Intestinal irony: how probiotic bacteria outcompete bad bugs.
Weiss G. Weiss G. Cell Host Microbe. 2013 Jul 17;14(1):3-4. doi: 10.1016/j.chom.2013.07.003. Cell Host Microbe. 2013. PMID: 23870306 - Iron acquisition pathways and colonization of the inflamed intestine by Salmonella enterica serovar Typhimurium.
Costa LF, Mol JP, Silva AP, Macêdo AA, Silva TM, Alves GE, Winter S, Winter MG, Velazquez EM, Byndloss MX, Bäumler AJ, Tsolis RM, Paixão TA, Santos RL. Costa LF, et al. Int J Med Microbiol. 2016 Dec;306(8):604-610. doi: 10.1016/j.ijmm.2016.10.004. Epub 2016 Oct 13. Int J Med Microbiol. 2016. PMID: 27760693 Free PMC article. - Probiotic/prebiotic correction for adverse effects of iron fortification on intestinal resistance to Salmonella infection in weaning mice.
Lin F , Wu H , Zeng M , Yu G , Dong S , Yang H . Lin F , et al. Food Funct. 2018 Feb 21;9(2):1070-1078. doi: 10.1039/c7fo00990a. Food Funct. 2018. PMID: 29355277 - The Pyromaniac Inside You: Salmonella Metabolism in the Host Gut.
Rivera-Chávez F, Bäumler AJ. Rivera-Chávez F, et al. Annu Rev Microbiol. 2015;69:31-48. doi: 10.1146/annurev-micro-091014-104108. Epub 2015 May 15. Annu Rev Microbiol. 2015. PMID: 26002180 Review. - The ins and outs of bacterial iron metabolism.
Frawley ER, Fang FC. Frawley ER, et al. Mol Microbiol. 2014 Aug;93(4):609-16. doi: 10.1111/mmi.12709. Epub 2014 Jul 22. Mol Microbiol. 2014. PMID: 25040830 Free PMC article. Review.
Cited by
- Modulation of gut microbiome in response to the combination of Escherichia coli Nissle 1917 and sugars: a pilot study using host-free system reflecting impact on interpersonal microbiome.
Heer K, Kaur M, Sidhu D, Dey P, Raychaudhuri S. Heer K, et al. Front Nutr. 2024 Oct 22;11:1452784. doi: 10.3389/fnut.2024.1452784. eCollection 2024. Front Nutr. 2024. PMID: 39502876 Free PMC article. - Iron Regulatory Proteins Mediate Host Resistance to Salmonella Infection.
Nairz M, Ferring-Appel D, Casarrubea D, Sonnweber T, Viatte L, Schroll A, Haschka D, Fang FC, Hentze MW, Weiss G, Galy B. Nairz M, et al. Cell Host Microbe. 2015 Aug 12;18(2):254-61. doi: 10.1016/j.chom.2015.06.017. Epub 2015 Jul 16. Cell Host Microbe. 2015. PMID: 26190773 Free PMC article. - Candida species-specific colonization in the healthy and impaired human gastrointestinal tract as simulated using the Mucosal Ileum-SHIME® model.
Marsaux B, Moens F, Vandevijver G, Marzorati M, van de Wiele T. Marsaux B, et al. FEMS Microbiol Ecol. 2024 Aug 13;100(9):fiae113. doi: 10.1093/femsec/fiae113. FEMS Microbiol Ecol. 2024. PMID: 39169462 Free PMC article. - Introduction of Plasmid to the Murine Gut via Consumption of an Escherichia coli Carrier and Examining the Impact of Bacterial Dosing and Antibiotics on Persistence.
Kydd L, Alalhareth F, Mendez A, Hohn M, Radunskaya A, Kojouharov H, Jaworski J. Kydd L, et al. Regen Eng Transl Med. 2022;8(3):489-497. doi: 10.1007/s40883-022-00248-z. Epub 2022 Apr 14. Regen Eng Transl Med. 2022. PMID: 36274752 Free PMC article. - Iron Supplementation Influence on the Gut Microbiota and Probiotic Intake Effect in Iron Deficiency-A Literature-Based Review.
Rusu IG, Suharoschi R, Vodnar DC, Pop CR, Socaci SA, Vulturar R, Istrati M, Moroșan I, Fărcaș AC, Kerezsi AD, Mureșan CI, Pop OL. Rusu IG, et al. Nutrients. 2020 Jul 4;12(7):1993. doi: 10.3390/nu12071993. Nutrients. 2020. PMID: 32635533 Free PMC article. Review.
References
- Andrews NC, Schmidt PJ. Iron homeostasis. Annu Rev Physiol. 2007;69:69–85. - PubMed
- Balakrishnan M, Floch MH. Prebiotics, probiotics and digestive health. Curr Opin Clin Nutr Metab Care. 2012;15:580–585. - PubMed
- Barthel M, Hapfelmeier S, Quintanilla-Martinez L, Kremer M, Rohde M, Hogardt M, Pfeffer K, Russmann H, Hardt WD. Pretreatment of mice with streptomycin provides a Salmonella enterica serovar Typhimurium colitis model that allows analysis of both pathogen and host. Infect Immun. 2003;71:2839–2858. - PMC - PubMed
Publication types
MeSH terms
Substances
Grants and funding
- R01 AI077629/AI/NIAID NIH HHS/United States
- T32 AI060573/AI/NIAID NIH HHS/United States
- T32 AI60573/AI/NIAID NIH HHS/United States
- R01 AI083663/AI/NIAID NIH HHS/United States
- U54AI065359/AI/NIAID NIH HHS/United States
- AI083663/AI/NIAID NIH HHS/United States
- AI77629/AI/NIAID NIH HHS/United States
- ImNIH/Intramural NIH HHS/United States
LinkOut - more resources
Full Text Sources
Other Literature Sources
Medical
