A dramatic increase of C1q protein in the CNS during normal aging - PubMed (original) (raw)
. 2013 Aug 14;33(33):13460-74.
doi: 10.1523/JNEUROSCI.1333-13.2013.
Daniel V Madison, José María Mateos, Deborah A Fraser, Emilie A Lovelett, Laurence Coutellier, Leo Kim, Hui-Hsin Tsai, Eric J Huang, David H Rowitch, Dominic S Berns, Andrea J Tenner, Mehrdad Shamloo, Ben A Barres
Affiliations
- PMID: 23946404
- PMCID: PMC3742932
- DOI: 10.1523/JNEUROSCI.1333-13.2013
A dramatic increase of C1q protein in the CNS during normal aging
Alexander H Stephan et al. J Neurosci. 2013.
Abstract
The decline of cognitive function has emerged as one of the greatest health threats of old age. Age-related cognitive decline is caused by an impacted neuronal circuitry, yet the molecular mechanisms responsible are unknown. C1q, the initiating protein of the classical complement cascade and powerful effector of the peripheral immune response, mediates synapse elimination in the developing CNS. Here we show that C1q protein levels dramatically increase in the normal aging mouse and human brain, by as much as 300-fold. This increase was predominantly localized in close proximity to synapses and occurred earliest and most dramatically in certain regions of the brain, including some but not all regions known to be selectively vulnerable in neurodegenerative diseases, i.e., the hippocampus, substantia nigra, and piriform cortex. C1q-deficient mice exhibited enhanced synaptic plasticity in the adult and reorganization of the circuitry in the aging hippocampal dentate gyrus. Moreover, aged C1q-deficient mice exhibited significantly less cognitive and memory decline in certain hippocampus-dependent behavior tests compared with their wild-type littermates. Unlike in the developing CNS, the complement cascade effector C3 was only present at very low levels in the adult and aging brain. In addition, the aging-dependent effect of C1q on the hippocampal circuitry was independent of C3 and unaccompanied by detectable synapse loss, providing evidence for a novel, complement- and synapse elimination-independent role for C1q in CNS aging.
Figures
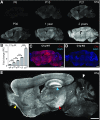
Figure 1.
C1q immunoreactivity dramatically increases with aging in the murine brain. A, Time course immunohistochemistry of perfused mouse brain slices with our new rabbit anti-mouse C1q monoclonal antibody revealed that C1q immunoreactivity dramatically increased with age throughout the brain. B, Quantification of C1q immunoreactivity in brain slices from early postnatal to old aged mice confirmed that C1q immunoreactivity dramatically increases with aging in the murine brain. C1q signals, normalized to P6 levels (n = 3 brains per age; statistical significance: P15 vs P6: p = 0.019; P30 vs P15: p = 0.0013; 12 months vs P30: p < 0.0001; 24 vs 12 months: p < 0.0001). C, D, All C1q signals in the wild-type adult brain (C) were specific (images from sections of 1-year-old brains); no signals were detected in C1q-deficient littermate control tissue (D). E, C1q-specific signals in the adult and aged brain (representative image of a brain slice from a perfused 2-year-old mouse shown) were detected throughout the brain neuropil, except in the molecular layer of the Cerebellum (white arrowhead). C1q-positive signals were particularly strong in the hippocampus (blue arrowhead), the piriform cortex (yellow arrowhead), and the substantia nigra (red arrowhead). In addition, locally increased C1q-immunoreactivity was detected in patches (C1q-positive patches) in many regions of the mouse brain neuropil (arrows; for more detail see Fig. 3). Scale bars: A, C, D, E, 1 mm; **p < 0.01, ***p < 0.001. Values and error bars represent mean ± SEM.
Figure 2.
C1q protein levels dramatically increase with aging in the murine brain. A, Western blot analysis of perfused, whole-brain homogenates using a commercially available anti-mouse C1q polyclonal antibody confirmed that C1q protein dramatically increased with aging in the murine brain, when compared with β-tubulin (βTub) loading controls. C1q signals detected were specific (KO, C1q-deficient brain homogenate). B, Quantification of Western blot signals, normalized to β-Tub loading controls, confirmed that C1q protein dramatically increased with age (C1q levels, normalized to P6 levels, n = 3 animals/age; statistical significance: P12 vs P6: p = 0.019; P20 vs P12: p = 0.0005; P35 vs P20: p = 0.019; 3.5 months vs P35: p = 0.043; 12 vs 3.5 months: p = 0.012; 18 vs 12 months: p = 0.0017; 24 vs 18 months: p = 0.104). C, Serum components IgG and IgM were only detected in nonperfused (n.p.) but not in perfused (perf) brains at all ages. D, C1q immunoreactivity did not increase with age in mouse serum (equal protein concentration loaded). E, Western blot analysis of perfused, whole-brain homogenates revealed that C3 immunoreactivity did not increase with age, compared with the β-Tub loading controls. C3 signals were specific (C3KO, C3-deficient brain homogenate). F, Quantification of Western blot-derived C3 signals, normalized to β-Tub loading controls, confirmed that C3 protein decreased from early postnatal ages to approximately 1 month of age and after (C3 levels, normalized to P6 levels, n = 3 animals/age; statistical significance: P12 vs P6: p = 0.029; P20 vs P12: p = 0.434; P35 vs P20: p = 0.003; 3.5 months vs P35: p = 0.07; 12 vs 3.5 months: p = 0.18; 18 vs 12 months: p = 0.50; 24 vs 18 months: p = 0.88.). G, Schematic overview of the known classical complement (C3)-dependent and nonclassical (C3-independent) functions of C1q (Ricklin et al., 2010; Veerhuis et al., 2011; Nayak et al., 2012; Stephan et al., 2012). m, Month; ns, not significant; *p < 0.05, **p < 0.01, ***p < 0.001. Values and error bars represent mean ± SEM.
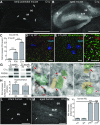
Figure 3.
Characterization of C1q-positive patches in the mouse brain. A, Representative immunohistochemistry image of an adult mouse brain slice (perfused animal), stained with our new rabbit anti-mouse C1q monoclonal antibody. C1q-positive patches appeared throughout the brain (arrows; 12 months old). B, Higher-magnification images depicting the variability in appearance of these C1q-positive patches (arrows). C, D, C1q signals including the C1q-positive patches were exclusively detected in wild-type tissue (C) and, thus, specific; no signals were detected in C1q-deficient littermate control tissue (D; 9 months old**). E, F, Confocal microscopy coexpression analyses for C1q and the excitatory synaptic protein VGluT1 (E) or the inhibitory synaptic protein VGAT (F**) revealed that the overall synaptic pattern or density was not altered in C1q-positive patches. Whereas C1q-immunoreactivity was increased in patch areas (hatched lines) over areas outside the patches, both VGlut1 and VGAT immunoreactivity appeared unchanged inside or outside the C1q-positive patches. G, H, Quantification of antibody-immunoreactivity confirmed that C1q-immunoreactivity was increased in C1q-positive patches, compared with outside-patch signal intensities (3-month-old, p < 0.0001; 24-month-old, p < 0.0001; n = 3 animals per age). In contrast to C1q, VGluT1 and VGAT immunoreactivities were similar inside or outside C1q-positive patch areas at both ages analyzed [3-month-old: VGluT1 (p = 0.68), VGAT (p = 0.25); 24-month-old: VGluT1 (p = 0.25), VGAT (p = 0.07); n = 3 animals per age]. ***p < 0.001. Values and error bars represent mean ± SEM. Scale bars: A, 1 mm; B–D, 100 μm; E, F, 50 μm.
Figure 4.
C1q immunoreactivity was detected at all developmental stages in microglia throughout the CNS. A, B, Colocalization immunohistochemistry analysis (our new rabbit anti-mouse C1q monoclonal antibody) confirmed that C1q immunoreactivity in the perfused P6 mouse brain was virtually exclusively detected in microglia, visualized by GFP immunoreactivity in slices from Cx3CR1-GFP+/− mice (image representative for all brain regions; image location: midbrain; boxed area in A is shown as magnified image in B). C, D, In contrast, C1q immunoreactivity in the perfused 9-month-old mouse brain was substantially increased in all microglia and additionally detected at high levels in the neuropil throughout the brain (Cx3CR1-GFP signals; image representative for all brain regions; image location: midbrain; boxed area in C, is shown as magnified image in D. Please note that A, B were taken with increased image exposure times compared with C, D). Scale bars: A, 50 μm; B, D, 20 μm; C, 100 μm.
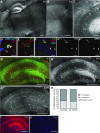
Figure 5.
C1q immunoreactivity in inhibitory neurons. A, B, In lightly fixed tissue, our new rabbit anti-mouse C1q monoclonal antibody enabled the additional detection of C1q signals in larger cell bodies (neurons, E–G), in distinct areas of the brain. These C1q-positive neurons were detected from ∼1 month of age on and aging-independent thereafter (6-month-old shown). C1q-positive neurons were detected in the hippocampus, thalamus, striatum, and midbrain. The exact distribution of C1q-positive neurons visible varied slightly dependent on the location of the slices within the brain. A, Detection of C1q-positive neurons in the hippocampus, thalamus, and midbrain (substantia nigra area). B, Detection of C1q-positive neurons in the thalamus and striatum (mainly globus pallidus). C, In the adult murine hippocampus, C1q immunoreactivity was detected in the neuropil and in both neurons (arrowhead) and microglia (arrow). D, Confocal microscopy colocalization with GFP-immunoreactivity (Cx3CR1-GFP+/− mice) confirmed that C1q was detected in microglia cell bodies (arrowhead) and processes (arrow). E, Confocal microscopy colocalization with NeuN-immunoreactivity confirmed that C1q was also localized to the cytoplasm of some neurons. F, Confocal microscopy colocalization with GABA-immunoreactivity confirmed that C1q was localized to inhibitory neurons (arrow) but that C1q was not detected in all GABA-positive neurons (arrowheads). G, C1q-positive neurons represent a subset of inhibitory neurons. Neuronal C1q signals exclusively colocalize (arrow) with many but not all GABA-positive neurons in the murine hippocampus (arrowheads: GABA+/C1q− neurons). H, Quantification of C1q-GABA-positive neurons in the murine hippocampus confirmed that C1q-positive neurons represent a subset of inhibitory neurons. At both 3 and 24 months of age all C1q-positive neurons were GABAergic (n = 3 animals/age). I, J, C1q signals, including signals in neurons, are specific in the wild-type adult hippocampus (I), no signals were detected in the C1q-deficient littermate control (J). Scale bars: A, B, G, I, J, 500 μm; C, 100 μm; D, E, 10 μm; F, 20 μm.
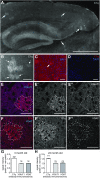
Figure 6.
C1q immunoreactivity dramatically increases with age in hippocampal synaptic layers and at synapses. A, B, Immunohistochemistry analysis confirmed comparably low levels of C1q immunoreactivity (arrows) in the hippocampus of P6 mice (A) but dramatically increased levels in all synaptic layers of the 24-month-old murine hippocampus (B): stratum oriens (SO), stratum radiatum (SR), stratum lacunosum moleculare (SLM), dentate gyrus ML. Very strong C1q immunoreactivity was also detected in the neuropil surrounding the CA2 cell bodies (arrowhead). C, Quantification of C1q immunoreactivity in the ML from early postnatal to old aged mice confirmed that C1q immunoreactivity dramatically increases with aging in the murine ML. C1q signals, normalized to P6 levels (n = 3 brains per age; statistical significance: P30 vs P6: p < 0.001; 22 months vs P30: p < 0.0001). D, E, Anti-C1q immunohistochemistry signals (rabbit anti-mouse C1q monoclonal antibody) visualized by confocal microscopy were specific. C1q immunoreactivity was only detected in the adult wild-type dentate gyrus molecular layer (D) but not in the corresponding tissue from C1q-deficient littermate mice (E). F, High resolution confocal microscopy revealed that C1q immunoreactivity in the ML was detected in close proximity to synaptic terminals (synaptophysin immunoreactivity, arrows). G, Subcellular fractionation of murine hippocampus homogenate revealed that C1q (detected with a polyclonal anti-C1q antibody) was enriched in the crude synaptosomal fractions (P2) from both adult and aged mice, similar to the synaptic protein PSD95, compared with the supernatant fraction (S2; representative images; GAPDH loading control). H, Quantification of the hippocampal subcellular fractionation analysis confirmed that C1q was enriched in the crude synaptosomal fraction (P2) from both 3-month-old (p = 0.0091) and 22-month-old (p = 0.0055) mice (n = 4 animals/age), compared with the counter-fraction S2. I–K, Single-section cryo-immuno electron microscopy confirmed that C1q immunoreactivity (12 nm gold particles) was detected in close proximity to the extracellular side of presynaptic- (pseudo-colored in green) or postsynaptic- (pseudo-colored in brown) elements (red arrows) and associated with unidentifiable structures (red arrowheads). This single-section image analysis did not allow clear identification of all elements visible in each section. It was therefore impossible to classify C1q immunoreactivity associated with unidentified elements as synaptic or nonsynaptic. K, Dual-immunogold analysis in the dentate gyrus molecular layer of aged mice. C1q immunoreactivity (12 nm gold particles, arrows) was detected in close proximity to both presynaptic (green) and postsynaptic (brown) elements. In contrast, synaptophysin immunoreactivity (6 nm gold particles, white arrowheads) was detected inside clearly identifiable presynaptic terminals as well as associated with unidentifiable structures, likely reflecting presynaptic terminals. L, M, C1q immunoreactivity dramatically increased with age in synaptic layers of the human hippocampus. L, C1q immunoreactivity in the human infant (2-month-old) was restricted to blood vessels (arrows), indicating serum-derived C1q in this nonperfused tissue, whereas it was particularly enriched in the SLM and ML of aged human donors (M; 75 years old). N, Quantification of C1q immunoreactivity in the ML from available infant and old aged human donor tissue confirmed that C1q immunoreactivity dramatically increased with aging in the human ML. C1q signals, normalized to 1 month levels (n = 4 slices per donor; statistical significance: 1 vs 2 months: p < 0.79; 1 month vs 75 years: p < 0.0001; 1 month vs 77 years: p < 0.0001). **p < 0.01, ***p < 0.001. Values and error bars represent mean ± SEM. Scale bars: A, B, L, M, 500 μm; D–F, 5 μm; I–K, 200 nm.
Figure 7.
C1q-deficiency impacts the neuronal circuitry in the dentate gyrus of adult and aging mice. A, Representative example of a Golgi-stained dentate gyrus granule cell neuron and the approximate dendritic segment (boxed area) used for the dendritic spine quantification analysis from an 18-month-old mouse. A representative higher-magnification image of a tertiary dentate gyrus granule cell dendrite segment in the outer molecular layer, used for quantification, is shown in A′. B, Tertiary dentate gyrus granule cell dendrites in the outer molecular layer of the dentate gyrus from 18 months old C1q wild-type (WT) and C1q-deficient (KO) littermate mice were identified and traced in Neurolucida (MBF Bioscience) and dendritic spines were manually identified, counted and quantified as number of spines per μm dendrite length. No significant differences in total spine number per μm dendrite length were detected (p = 0.47; n = 4 animals/genotype). C, Schematic drawing of the stimulation and recording positions within the dentate gyrus ML. PP, Peforant path; GC, granule cell layer; MF, mossy fibers; SC, Schaffer collaterals. D–F, I/O curves showing the relationship between the presynaptic compound action potential (fiber volley) and the fEPSP in the ML were not significantly different in juvenile (D; P14–P17, p = 0.896), adult (E; 3 months, p = 0.284) or aged (F; 17-month-old, p = 0.494) C1q-deficient (KO) mice, compared with their wild-type (WT) littermates. G, I/O curves showing the relationship between stimulus strength and the fiber volley were not statistically different between juvenile WT and KO mice (p = 0.86) but significantly smaller in the adult KO (H; p = 0.05) and in the aged KO (I; p = 0.0486), when compared with their respective WT littermates. Juvenile: n = 6 WT, n = 6 C1q KO littermates; adult: n = 10 WT, n = 12 C1q KO littermates; aged: n = 13 WT, n = 11 C1q KO littermates. Values and error bars represent mean ± SEM.
Figure 8.
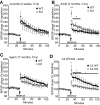
C1q-deficiency enhances activity-dependent synaptic potentiation in the adult, whereas C3-deficiency reduces activity-dependent synaptic potentiation. A–C, Analysis of synaptic potentiation in the ML of juvenile (A; P14–P17), adult (B; 3-month-old) and aged (C; 17-month-old) C1q-deficient (KO) versusWT littermate mice. A, No difference between KO and WT were detected in juvenile mice as synaptic potentiation after tetanic stimulation (p = 0.867) was similar between KO and WT mice. B, Adult KO mice showed enhancements in both PTP and subsequent potentiation when compared with the WT (PTP, p = 0.008; potentiation after PTP decay, 5–10 min after tetanus, p = 0.049; potentiation was significantly different for the time-span from 3 to 20 min post-tetanus, indicated by the bar in the graph, p = 0.049). C, No difference between KO and WT were detected in aged mice as synaptic potentiation after tetanic stimulation (PTP, p = 0.671, and later potentiation, p = 0.205) were similar between KO and WT mice. D, Adult C3-deficient mice (C3 KO) showed an opposing effect to the adult C1q KO (B), with reduced PTP and subsequent potentiation when compared with the C3 wild-type littermates (C3 WT; PTP, p = 0.038; potentiation after PTP decay, 5–10 min after tetanus, p = 0.027; potentiation was significantly different for the entire post-tetanus time-span (p = 0.044), including the time-span from 3 to 20 min post-tetanus (p = 0.029). Each data point presented represents 1 min averages of four individual fEPSPs taken at 15 s intervals. We did not detect any significant differences between baseline fEPSPs recorded before the tetanic stimulation. Juvenile C1q: n = 6 WT, n = 6 C1q KO littermates; adult C1q: n = 10 WT, n = 12 C1q KO littermates; aged C1q: n = 13 WT, n = 11 C1q KO littermates; adult C3: n = 14 WT, n = 13 C1q KO littermates. Values and error bars represent mean ± SEM. *p < 0.05, **p < 0.01.
Figure 9.
C1q-deficiency reduces cognitive decline during normal aging. A, MWM analysis, including reversal learning (days 8, 9, 10; total escape latency per day shown) revealed enhanced cognitive flexibility in aged C1q-deficient (KO) mice. A, 3-month-old (adult) KO, their WT littermates, and 3-month-old control mice performed all parts of the experiment without significant differences. **A**′, Learning of the hidden platform location (days 1–7) was nearly identical between 17-month-old (aged) KO mice, their WT littermates and 3-month-old control mice. Only on day 7, the 3-month-old control performed significantly better than the aged WT (p < 0.01). However, no significant difference in learning was detected between 3-month-old controls and aged KO mice (_p_ > 0.05). On the first day of the reversal learning task (day 8), 3-month-old controls found the new location of the hidden platform faster than both aged KO and WT mice (WT vs 3-month-old control: p < 0.05; KO vs 3-month-old control: _p_ < 0.05). However, aged KO mice performed at the two subsequent reversal learning days as fast as the 3-month-old controls (day 9: _p_ > 0.05; day 10: p > 0.05). This was in strong contrast to the aged WT mice which showed reduced reversal learning at both days, consistent with an age-related decline in cognitive flexibility (day 9: WT vs KO: p < 0.05; WT vs 3-month-old control: _p_ < 0.05; day 10: WT vs KO: _p_ > 0.05; WT vs Bio Ctrl: p < 0.05). There were no significant differences between the cohorts at all ages during visible platform learning (day 11), indicating that all animals were able to see. **_B_**, Y-maze analysis revealed intact spatial working memory in aged KO mice. KO mice performed spontaneous alternations in the Y-maze task at all ages significantly above chance (50%) and equally well as the 3-month-old controls (KO: 3 months of age, _p_ = 0.0059; corresponding 3-month-old control, _p_ = 0.0188; KO: 17 months of age, _p_ = 0.0009; corresponding 3-month-old control, _p_ = 0.0072). In contrast, although young adult WT mice were able to learn the task (_p_ = 0.0004), a large proportion of aged WT mice did not perform above chance levels (circled subjects), particularly indicating the subjects with age-related decrease in spatial working memory (17-month-old WT, whole group mean: _p_ = 0.1158). **_C_**, Open field analysis confirmed that KO mice have activity levels identical to the WT at both 3 (adult) and 17 months (aged) of age. As to be expected, the 3-month-old control mice traveled slightly longer distance than the aged KO and WT mice (significant difference between C1qWT/KO and the 3-month-old controls at 5 min: _p_ < 0.05, and 7 min: _p_ < 0.01; no significant difference at all other time points (_p_ > 0.05)). Three-month-old: n = 13 WT, n = 13 KO littermates; 17-month-old: n = 11 WT, n = 9 KO littermates; 3-month-old control: n = 10; *p < 0.05, **p < 0.01, ***p <0.001. Values and error bars represent mean ± SEM.
Similar articles
- Complement C3-Deficient Mice Fail to Display Age-Related Hippocampal Decline.
Shi Q, Colodner KJ, Matousek SB, Merry K, Hong S, Kenison JE, Frost JL, Le KX, Li S, Dodart JC, Caldarone BJ, Stevens B, Lemere CA. Shi Q, et al. J Neurosci. 2015 Sep 23;35(38):13029-42. doi: 10.1523/JNEUROSCI.1698-15.2015. J Neurosci. 2015. PMID: 26400934 Free PMC article. - The classical complement cascade mediates CNS synapse elimination.
Stevens B, Allen NJ, Vazquez LE, Howell GR, Christopherson KS, Nouri N, Micheva KD, Mehalow AK, Huberman AD, Stafford B, Sher A, Litke AM, Lambris JD, Smith SJ, John SW, Barres BA. Stevens B, et al. Cell. 2007 Dec 14;131(6):1164-78. doi: 10.1016/j.cell.2007.10.036. Cell. 2007. PMID: 18083105 - Classical complement cascade initiating C1q protein within neurons in the aged rhesus macaque dorsolateral prefrontal cortex.
Datta D, Leslie SN, Morozov YM, Duque A, Rakic P, van Dyck CH, Nairn AC, Arnsten AFT. Datta D, et al. J Neuroinflammation. 2020 Jan 6;17(1):8. doi: 10.1186/s12974-019-1683-1. J Neuroinflammation. 2020. PMID: 31906973 Free PMC article. - Synapse organization and modulation via C1q family proteins and their receptors in the central nervous system.
Matsuda K. Matsuda K. Neurosci Res. 2017 Mar;116:46-53. doi: 10.1016/j.neures.2016.11.004. Epub 2016 Nov 12. Neurosci Res. 2017. PMID: 27845167 Review. - Complement in Human Brain Health: Potential of Dietary Food in Relation to Neurodegenerative Diseases.
Xing Y, Zhang D, Fang L, Wang J, Liu C, Wu D, Liu X, Wang X, Min W. Xing Y, et al. Foods. 2023 Sep 26;12(19):3580. doi: 10.3390/foods12193580. Foods. 2023. PMID: 37835232 Free PMC article. Review.
Cited by
- Loss of C1q alters the auditory brainstem response.
Chokr SM, Bui-Tran A, Cramer KS. Chokr SM, et al. Front Cell Neurosci. 2024 Oct 2;18:1464670. doi: 10.3389/fncel.2024.1464670. eCollection 2024. Front Cell Neurosci. 2024. PMID: 39416682 Free PMC article. - Dysregulated C1q and CD47 in the aging monkey brain: association with myelin damage, microglia reactivity, and cognitive decline.
DeVries SA, Dimovasili C, Medalla M, Moore TL, Rosene DL. DeVries SA, et al. Front Immunol. 2024 Sep 27;15:1426975. doi: 10.3389/fimmu.2024.1426975. eCollection 2024. Front Immunol. 2024. PMID: 39399501 Free PMC article. - A microglial compliment: controlling neuronal function from within.
Hasavci D, Blank T. Hasavci D, et al. Signal Transduct Target Ther. 2024 Oct 7;9(1):267. doi: 10.1038/s41392-024-01989-9. Signal Transduct Target Ther. 2024. PMID: 39370427 Free PMC article. No abstract available. - Aging Microglia and Their Impact in the Nervous System.
von Bernhardi R, Eugenín J. von Bernhardi R, et al. Adv Neurobiol. 2024;37:379-395. doi: 10.1007/978-3-031-55529-9_21. Adv Neurobiol. 2024. PMID: 39207703 Review. - Organelle phenotyping and multi-dimensional microscopy identify C1q as a novel regulator of microglial function.
Sakthivel PS, Scipioni L, Karam J, Keulen Z, Blurton-Jones M, Gratton E, Anderson AJ. Sakthivel PS, et al. J Neurochem. 2024 Sep;168(9):3095-3107. doi: 10.1111/jnc.16173. Epub 2024 Jul 17. J Neurochem. 2024. PMID: 39018376
References
- Benoit ME, Hernandez MX, Dinh ML, Benavente F, Vasquez O, Tenner AJ. C1q-induced LRP1B and GPR6 proteins expressed early in Alzheimer disease mouse models, are essential for the C1q-mediated protection against amyloid-beta neurotoxicity. J Biol Chem. 2013;288:654–665. doi: 10.1074/jbc.M112.400168. - DOI - PMC - PubMed
Publication types
MeSH terms
Substances
Grants and funding
- NS069375/NS/NINDS NIH HHS/United States
- P30 NS069375/NS/NINDS NIH HHS/United States
- MH65541/MH/NIMH NIH HHS/United States
- R01 NS059893/NS/NINDS NIH HHS/United States
- R01 DA15403/DA/NIDA NIH HHS/United States
- NS059893/NS/NINDS NIH HHS/United States
- OD010927/OD/NIH HHS/United States
- P01 AG000538/AG/NIA NIH HHS/United States
- T32 MH020016/MH/NIMH NIH HHS/United States
- HHMI/Howard Hughes Medical Institute/United States
- R01 AI041090/AI/NIAID NIH HHS/United States
- R01 MH065541/MH/NIMH NIH HHS/United States
- AG00538/AG/NIA NIH HHS/United States
- K26 OD010927/OD/NIH HHS/United States
- R01 DA015403/DA/NIDA NIH HHS/United States
- AI41090/AI/NIAID NIH HHS/United States
LinkOut - more resources
Full Text Sources
Other Literature Sources
Medical
Molecular Biology Databases
Research Materials
Miscellaneous
