Stress-induced recruitment of bone marrow-derived monocytes to the brain promotes anxiety-like behavior - PubMed (original) (raw)
Stress-induced recruitment of bone marrow-derived monocytes to the brain promotes anxiety-like behavior
Eric S Wohleb et al. J Neurosci. 2013.
Abstract
Social stress is associated with altered immunity and higher incidence of anxiety-related disorders. Repeated social defeat (RSD) is a murine stressor that primes peripheral myeloid cells, activates microglia, and induces anxiety-like behavior. Here we show that RSD-induced anxiety-like behavior corresponded with an exposure-dependent increase in circulating monocytes (CD11b(+)/SSC(lo)/Ly6C(hi)) and brain macrophages (CD11b(+)/SSC(lo)/CD45(hi)). Moreover, RSD-induced anxiety-like behavior corresponded with brain region-dependent cytokine and chemokine responses involved with myeloid cell recruitment. Next, LysM-GFP(+) and GFP(+) bone marrow (BM)-chimeric mice were used to determine the neuroanatomical distribution of peripheral myeloid cells recruited to the brain during RSD. LysM-GFP(+) mice showed that RSD increased recruitment of GFP(+) macrophages to the brain and increased their presence within the perivascular space (PVS). In addition, RSD promoted recruitment of GFP(+) macrophages into the PVS and parenchyma of the prefrontal cortex, amygdala, and hippocampus of GFP(+) BM-chimeric mice. Furthermore, mice deficient in chemokine receptors associated with monocyte trafficking [chemokine receptor-2 knockout (CCR2(KO)) or fractalkine receptor knockout (CX3CR1(KO))] failed to recruit macrophages to the brain and did not develop anxiety-like behavior following RSD. Last, RSD-induced macrophage trafficking was prevented in BM-chimeric mice generated with CCR2(KO) or CX3CR1(KO) donor cells. These findings indicate that monocyte recruitment to the brain in response to social stress represents a novel cellular mechanism that contributes to the development of anxiety.
Figures
Figure 1.
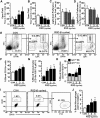
RSD-induced anxiety-like behavior was paralleled by an increased percentage of circulating monocytes (CD11b+/SSClo/Ly6Chi) and macrophages (CD11b+/CD45hi) in the brain. Male C57BL/6 mice were subjected to one, three, or six cycles of social defeat (RSD) or left undisturbed as controls (CON). Anxiety-like behavior was determined 14 h after the final cycle of RSD (n = 6–9, 3 independent experiments). A, B, Time to enter the center of the open field (A) and total time spent in the open field (B). C, Time to enter the dark zone. D, Total time spent in the light zone. Following behavioral testing, blood and enriched brain CD11b+ cells were collected (n = 6–9, 3 independent experiments). E, Representative flow bivariate dot plots of SSC/CD11b and SSC/Ly6C labeling in the blood. Myeloid subsets were gated into Ly6C− monocyte (m: CD11b+/SSClo/Ly6C−), granulocyte (G: CD11b+/SSChi/Ly6Cint), and Ly6Chi monocyte (M: CD11b+/SSClo/Ly6Chi) subsets. F–H, The percentage of blood myeloid cells (F, CD11b+), granulocytes (G, G), and monocytes (H, m: Ly6C− or M: Ly6Chi). I, Representative flow bivariate dot plots of CD11b/CD45 labeling in Percoll-isolated microglia/macrophages and side scatter/forward scatter (SSC/FSC) properties are shown in RSD mice. J, The percentage of brain macrophages (CD11b+/CD45hi) are shown. Bars represent the mean ± SEM. Means with asterisk are significantly different from CON (p < 0.05) and means with number sign (#) tended to be different from CON (p < 0.06–0.10).
Figure 2.
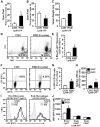
RSD-induced anxiety was associated with increased recruitment of LysM-GFP+ monocytes from circulation into the brain. LysM-GFP+ mice were subjected to six cycles of social defeat (RSD) or left undisturbed as controls (CON). Anxiety-like behavior was tested 14 h after RSD. Following behavioral testing, blood and enriched brain CD11b+ cells were collected (n = 6–8, 2 independent experiments). A, Time to enter the center of the open field. B, Time spent in the open field. C, Average spleen weight. D, Representative flow bivariate dot plots of SSC/Ly6C on CD11b+ cells. E, The percentage of CD11b+/SSClo/Ly6Chi monocytes in the blood. F, Representative bivariate dot plots of GFP/CD11b labeling of Percoll-isolated microglia/macrophages. G, The percentage of GFP+/CD11b+ cells in the brain. H, The number of GFP+/CD11b+ cells that were CD45hi or CD45lo. I, Representative histograms of GFP expression in blood monocytes (CD11b+/Ly6Chi) and brain macrophages (CD11b+/CD45hi). J, Relative MFI of GFP+/CD11b+ cells in the blood or brain. Bars represent the mean ± SEM. Means with asterisk are significantly different from CON (p < 0.05).
Figure 3.
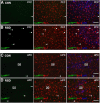
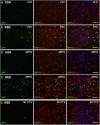
LysM-GFP+ macrophages were present in the PVS of the brain following RSD. LysM-GFP+ mice were subjected to six cycles of social defeat (RSD) or left undisturbed as controls (CON). Brains were collected 14 h after RSD for histology (n = 4–6, 2 independent experiments). A, B, Representative images of LysMGFP (green), merged LysMGFP/Iba-1 (red), and merged LysMGFP/Iba-1/Ly6C (blue) in the PFC of CON and RSD mice. C, D, Representative images of LysMGFP (green), merged LysMGFP/Iba-1 (red), and merged LysMGFP/Iba-1/Ly6C (blue) immunofluorescence in the HPC of CON and RSD mice. White arrowheads point to perivascular LysM-GFP+ macrophages. Scale bars, 100 μm.
Figure 4.
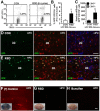
Peripheral GFP+/CD11b+ macrophages were recruited into the brain of GFP+ BM-chimeric mice after RSD. GFP+ BM-chimeric mice were subjected to six cycles of social defeat (RSD) or left undisturbed as controls (CON). Brains were collected 14 h after RSD and enriched CD11b+ cells were assessed with flow cytometry (n = 4–5). A, Representative flow bivariate dot plots of GFP/CD11b labeling of Percoll-isolated microglia/macrophages. B, The percentage of GFP+/CD11b+ cells in the brain. C, The number of GFP+/CD11b+ cells that were CD45lo or CD45hi. Bars represent the mean ± SEM. Means with asterisk (*) are significantly different from CON (p < 0.05). Another group of mice were perfused and brains were collected for histology (n = 4–6, 2 independent experiments). D, E, Representative images of GFP (green), merged GFP/Iba-1 (red), and merged GFP/Iba-1/Ly6C (blue) immunofluorescence in the HPC of CON and RSD mice. F–H, In separate studies, mice that received intraocular injury [(+) Control], RSD, or busulfan treatment were retro-orbitally injected with Evans blue dye (1% solution in 100 μl). Mice were perfused and brains were collected for histology 2 h after Evans blue dye injection. Representative images of the whole brain (inset) and in the HPC of (+) Control (F), RSD (G), and busulfan-treated (H) mice. Scale bars, 100 μm.
Figure 5.
RSD promoted infiltration of peripheral macrophages (ramified GFP+/Iba-1+) into the parenchyma of brain regions associated with fear and anxiety. GFP+ BM-chimeric mice were subjected to six cycles of social defeat (RSD) or left undisturbed as controls (CON). The neuroanatomical distribution of GFP+ cells was determined 14 h after the final cycle of RSD (n = 3–4). A, B, Representative images of GFP (green), merged GFP/Iba-1 (red), and merged GFP/Iba-1/Ly6C (blue) immunofluorescence in the PFC of CON and RSD mice. C, D, Representative images of GFP (green), merged GFP/Iba-1 (red), and merged GFP/Iba-1/Ly6C (blue) immunofluorescence in the AMYG of CON and RSD mice. E, Representative images of GFP (green), merged GFP/Iba-1 (red), and merged GFP/Iba-1/Ly6C (blue) immunofluorescence in the M1 CTX of RSD mice. Scale bars, 100 μm.
Figure 6.
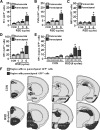
Recruitment of ramified GFP+ macrophages in the brain required repeated cycles of RSD. GFP+ BM-chimeric mice were subjected to one, three, or six cycles of social defeat (RSD) or left undisturbed as controls (CON). The neuroanatomical distribution of GFP+ cells was determined 14 h after the final cycle of RSD (n = 3–7, 3 independent experiments). A–D, Quantification of the total number of perivascular and parenchymal GFP+ cells in the PFC (A), PVN (B), AMYG (C), and HPC (D). E, Region-specific quantification of the HPC (CA1, CA2, CA3, and DG) is shown. Bars represent the mean ± SEM. Means with asterisk (*) are significantly different from CON (p < 0.05) and means with number sign (#) tend to be different from CON (p = 0.06–0.10). F, Representative illustration of GFP+ cell distribution throughout the brain following RSD. Areas in dark gray indicate significant distribution of ramified GFP+ macrophages. OB, Olfactory bulb; NAc, nucleus accumbens; V, dorsal lateral ventricle; Pir, piriform cortex.
Figure 7.
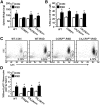
RSD increased the proportion of circulating CD11b+/SSClo/Ly6Chi monocytes independent of CCR2 and CX3CR1 expression. In two separate experiments, WT and CCR2KO or CX3CR1HET and CX3CR1KO C57BL/6 mice were subjected to six cycles of social defeat (RSD) or left undisturbed as controls (CON). Spleens and blood were collected 14 h after the final cycle of RSD (n = 3–8, 3 independent experiments). A, Average spleen weight. B, The percentage of myeloid cells (CD11b+) in the blood. C, Representative flow bivariate dot plots of Ly6C/CD11b labeling. D, The percentage of blood monocytes (CD11b+/Ly6Chi). Bars represent the mean ± SEM. Means with asterisk (*) are significantly different from genotype CON (p < 0.05).
Figure 8.
RSD-induced macrophage recruitment to the brain and anxiety-like behavior required expression of CCR2 and CX3CR1. WT and CCR2KO or CX3CR1HET and CX3CR1KO C57BL/6 mice were subjected to six cycles of social defeat (RSD) or left undisturbed as controls (CON). Anxiety-like behavior was determined 14 h after RSD. Following behavioral testing, brains were collected for Percoll isolation of brain CD11b+ cells (n = 7–12, 4 independent experiments). A, Time to enter the open field. B, Total time spent in the open field. C, Representative flow bivariate dot plots of CD11b/CD45 labeling of Percoll-isolated microglia/macrophages. D, The percentage of brain macrophages. Bars represent the mean ± SEM. Means with asterisk (*) are significantly different from genotype CON (p < 0.05).
Figure 9.
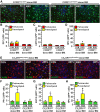
Expression of CCR2 and CX3CR1 on peripheral myeloid cells was required for RSD-induced macrophage infiltration into the brain parenchyma. WT recipient mice received either CCR2HET(+/RFP), CCR2KO(RFP/RFP), CX3CR1HET(+/GFP), or CX3CR1KO(GFP/GFP) BM-derived donor cells. BM-chimeric mice were subjected to six cycles of social defeat (RSD) or left undisturbed as controls (CON). The neuroanatomical distribution of GFP+ cells was determined 14 h after the final cycle of RSD (n = 3–6, 2 independent experiments). A, Representative merged images of Iba-1 (green)/CCR2 (red)/Ly6C (blue) immunofluorescence in the PFC of CON or RSD mice that received CCR2HET and CCR2KO donor BM. B–D, Quantification of the total number of perivascular and parenchymal cells in the PFC (B), AMYG (C), and HPC (D). E, Representative merged images of CX3CR1 (green)/Iba-1 (red)/Ly6C (blue) immunofluorescence in the AMYG of CON or RSD mice that received CX3CR1HET or CX3CR1KO donor BM. F–H, Quantification of the total number of perivascular and parenchymal GFP+ cells in the PFC (F), AMYG (G), and HPC (H). Bars represent the mean ± SEM. Means with asterisk (*) are significantly different from CON (p < 0.05) and means with number sign (#) tend to be different from CON (p = 0.06).
Similar articles
- Spatio-temporal profile, phenotypic diversity, and fate of recruited monocytes into the post-ischemic brain.
Garcia-Bonilla L, Faraco G, Moore J, Murphy M, Racchumi G, Srinivasan J, Brea D, Iadecola C, Anrather J. Garcia-Bonilla L, et al. J Neuroinflammation. 2016 Nov 4;13(1):285. doi: 10.1186/s12974-016-0750-0. J Neuroinflammation. 2016. PMID: 27814740 Free PMC article. - β-Adrenergic receptor antagonism prevents anxiety-like behavior and microglial reactivity induced by repeated social defeat.
Wohleb ES, Hanke ML, Corona AW, Powell ND, Stiner LM, Bailey MT, Nelson RJ, Godbout JP, Sheridan JF. Wohleb ES, et al. J Neurosci. 2011 Apr 27;31(17):6277-88. doi: 10.1523/JNEUROSCI.0450-11.2011. J Neurosci. 2011. PMID: 21525267 Free PMC article. - Knockdown of interleukin-1 receptor type-1 on endothelial cells attenuated stress-induced neuroinflammation and prevented anxiety-like behavior.
Wohleb ES, Patterson JM, Sharma V, Quan N, Godbout JP, Sheridan JF. Wohleb ES, et al. J Neurosci. 2014 Feb 12;34(7):2583-91. doi: 10.1523/JNEUROSCI.3723-13.2014. J Neurosci. 2014. PMID: 24523548 Free PMC article. - Peripheral and central effects of repeated social defeat stress: monocyte trafficking, microglial activation, and anxiety.
Reader BF, Jarrett BL, McKim DB, Wohleb ES, Godbout JP, Sheridan JF. Reader BF, et al. Neuroscience. 2015 Mar 19;289:429-42. doi: 10.1016/j.neuroscience.2015.01.001. Epub 2015 Jan 14. Neuroscience. 2015. PMID: 25596319 Free PMC article. Review. - Cellular players that shape evolving pathology and neurodegeneration following traumatic brain injury.
Puntambekar SS, Saber M, Lamb BT, Kokiko-Cochran ON. Puntambekar SS, et al. Brain Behav Immun. 2018 Jul;71:9-17. doi: 10.1016/j.bbi.2018.03.033. Epub 2018 Mar 27. Brain Behav Immun. 2018. PMID: 29601944 Review.
Cited by
- Novel microglial transcriptional signatures promote social and cognitive deficits following repeated social defeat.
Goodman EJ, DiSabato DJ, Sheridan JF, Godbout JP. Goodman EJ, et al. Commun Biol. 2024 Sep 28;7(1):1199. doi: 10.1038/s42003-024-06898-9. Commun Biol. 2024. PMID: 39341879 Free PMC article. - Glycolytic metabolism: Food for immune cells, fuel for depression?
Bekhbat M. Bekhbat M. Brain Behav Immun Health. 2024 Aug 14;40:100843. doi: 10.1016/j.bbih.2024.100843. eCollection 2024 Oct. Brain Behav Immun Health. 2024. PMID: 39263313 Free PMC article. - Adult Neurogenesis, Learning and Memory.
Šimončičová E, Henderson Pekarik K, Vecchiarelli HA, Lauro C, Maggi L, Tremblay MÈ. Šimončičová E, et al. Adv Neurobiol. 2024;37:221-242. doi: 10.1007/978-3-031-55529-9_13. Adv Neurobiol. 2024. PMID: 39207695 Review. - The Antidepressant- and Anxiolytic-Like Effects of the Phosphodiesterase Type-5 Inhibitor Tadalafil are Associated with the Modulation of the Gut-Brain Axis During CNS Autoimmunity.
Duarte-Silva E, Oriá AC, Mendonça IP, Paiva IHR, Leuthier Dos Santos K, Sales AJ, de Souza JRB, Maes M, Meuth SG, Peixoto CA. Duarte-Silva E, et al. J Neuroimmune Pharmacol. 2024 Aug 19;19(1):45. doi: 10.1007/s11481-024-10148-4. J Neuroimmune Pharmacol. 2024. PMID: 39158758 - Repetitive Administration of Low-Dose Lipopolysaccharide Improves Repeated Social Defeat Stress-Induced Behavioral Abnormalities and Aberrant Immune Response.
Charoensaensuk V, Yeh WL, Huang BR, Hsu TC, Xie SY, Chen CW, Wang YW, Yang LY, Tsai CF, Lu DY. Charoensaensuk V, et al. J Neuroimmune Pharmacol. 2024 Jul 27;19(1):38. doi: 10.1007/s11481-024-10141-x. J Neuroimmune Pharmacol. 2024. PMID: 39066908
References
- Beumer W, Gibney SM, Drexhage RC, Pont-Lezica L, Doorduin J, Klein HC, Steiner J, Connor TJ, Harkin A, Versnel MA, Drexhage HA. The immune theory of psychiatric diseases: a key role for activated microglia and circulating monocytes. J Leukoc Biol. 2012;92:959–975. doi: 10.1189/jlb.0212100. - DOI - PubMed
Publication types
MeSH terms
Substances
Grants and funding
- R01-MH093473/MH/NIMH NIH HHS/United States
- R01 AG033028/AG/NIA NIH HHS/United States
- R01 MH097243/MH/NIMH NIH HHS/United States
- R01 MH093473/MH/NIMH NIH HHS/United States
- R01-AG033028/AG/NIA NIH HHS/United States
- F31-MH09547301/MH/NIMH NIH HHS/United States
LinkOut - more resources
Full Text Sources
Other Literature Sources
Medical
Research Materials
Miscellaneous
