PtdIns(3)P-bound UVRAG coordinates Golgi-ER retrograde and Atg9 transport by differential interactions with the ER tether and the beclin 1 complex - PubMed (original) (raw)
. 2013 Oct;15(10):1206-1219.
doi: 10.1038/ncb2848. Epub 2013 Sep 22.
Duojiao Ni # 1, Binyun Ma # 1, Joo-Hyung Lee 1, Tian Zhang 1, Irene Ghozalli 1, Sara Dolatshahi Pirooz 1, Zhen Zhao 1, Nagakumar Bharatham 2, Baihong Li 2, Soohwan Oh 1, Wen-Hwa Lee 3, Yoshinori Takahashi 4, Hong-Gang Wang 4, Arlet Minassian 1, Pinghui Feng 1, Vojo Deretic 5, Rainer Pepperkok 6, Mitsuo Tagaya 7, Ho Sup Yoon 2 8, Chengyu Liang 1
Affiliations
- PMID: 24056303
- PMCID: PMC3805255
- DOI: 10.1038/ncb2848
PtdIns(3)P-bound UVRAG coordinates Golgi-ER retrograde and Atg9 transport by differential interactions with the ER tether and the beclin 1 complex
Shanshan He et al. Nat Cell Biol. 2013 Oct.
Abstract
Endoplasmic reticulum (ER)-Golgi membrane transport and autophagy are intersecting trafficking pathways that are tightly regulated and crucial for homeostasis, development and disease. Here, we identify UVRAG, a beclin-1-binding autophagic factor, as a phosphatidylinositol-3-phosphate (PtdIns(3)P)-binding protein that depends on PtdIns(3)P for its ER localization. We further show that UVRAG interacts with RINT-1, and acts as an integral component of the RINT-1-containing ER tethering complex, which couples phosphoinositide metabolism to COPI-vesicle tethering. Displacement or knockdown of UVRAG profoundly disrupted COPI cargo transfer to the ER and Golgi integrity. Intriguingly, autophagy caused the dissociation of UVRAG from the ER tether, which in turn worked in concert with the Bif-1-beclin-1-PI(3)KC3 complex to mobilize Atg9 translocation for autophagosome formation. These findings identify a regulatory mechanism that coordinates Golgi-ER retrograde and autophagy-related vesicular trafficking events through physical and functional interactions between UVRAG, phosphoinositide and their regulatory factors, thereby ensuring spatiotemporal fidelity of membrane trafficking and maintenance of organelle homeostasis.
Figures
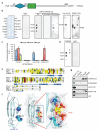
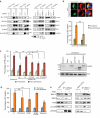
Figure 1
UVRAG interacts with phosphoinositides. (a) Schematic representation of full-length UVRAG with the boundary of the C2 domain indicated above the diagram. C2, the phosphoinositide-binding domain; CC, the coiled-coil domain. (b) The affinity of the UVRAG-C2 domain for phospholipids was assessed using a protein-lipid overlay assay. The left panel indicates the identity of lipid species on PIP strips. Bacterial purified GST-fusion of UVRAG-C2 (WT), but not GST, binds PI(3)P, PI(4)P, and PI(5)P. The K78A/R82A mutant of C2 is defective for phospholipid-binding, whereas the K87A/N88A mutant is partially impaired. Binding of the FYVE and PH domains of Hrs and FAPP1, respectively, to PI(3)P and PI(4)P served as quality controls (right). (c) The relative affinity of the GST-fusion proteins for phosphoinositides was quantified by densitometric analysis of the GST immunoblots in (b) from five independent experiments (n = 5). Error bars represent standard deviation (SD). A.U., artificial unit. (d) Binding of full-length UVRAG (untagged) to lipid blots. The same PIP strips (b) were used and immunoblotted with antibodies to IgG (right) and UVRAG (left). (e) Multiple sequence alignment of the C2B domain from synaptotagmin-1 (Syt-1), and the C2 domains from phospholipase C beta (PLC-β) and protein kinase C-alpha (PKC-α), and UVRAG, using the ClustalW alignment program. Identical residues are highlighted in red, conserved and similar residues are highlighted in yellow and green, respectively. The two functionally critical residues, K78 and R82, are indicated by an asterisk. The secondary structure of the UVRAG-C2 domain is depicted below the alignment. The sequences of PLC-β, Syt-1, and PKC-α were obtained from Swiss-Prot with accession numbers Q00722, P21707, and P05696, respectively. (f) Homology model of UVRAG-C2 with conserved PI(3)P-interacting residues highlighted with spheres. The crystal structures of PKC-α, PLC-β, and Syt-1 C2B were used as templates to develop a homology model of the UVRAG-C2 domain. Binding orientation of PI(3)P with the UVRAG-C2 domain was developed by molecular docking method and PI(3)P is highlighted with yellow sticks. Close view of the interaction pattern demonstrates that PI(3)P forms hydrogen-bond interactions with the K78 and R82 residue side chains. These two residues are depicted by sticks with dots and hydrogen bonds illustrated with dotted lines. (g) Pull-down of UVRAG-C2 domain GST-fusion proteins by liposomes bearing the indicated phosphoinositides. GST-Hrs- FYVE and GST-FAPP1-PH are also shown.
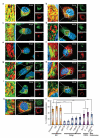
Figure 2
UVRAG localizes at the ER. (a–k) Confocal analyses of the subcellular colocalization of endogenous UVRAG with ER markers, including endogenous Calnexin (red, a), endogenous PDI (red, b), and overexpressed DSred-ER (red, c); with Golgi markers, including endogenous GM130 and p115 (red, d–e, _cis_-Golgi), overexpressed GFP-Man II (green, f, _medial_-Golgi), endogenous TGN46 (red, g, _trans_-Golgi), and overexpressed PI(4)P probe, GFP-FAPP1-PH (green, h); with endogenous coatomer proteins, including Sec31 (red, i, COPII-related) and β'-COP (red, j, COPI-related); and with the endosome marker GFP-p40phox(PX) (green, k) in HeLa cells. Insets show high magnification of the selected areas. Scale bars, 10 μm. (l) Confocal microscopic quantification of colocalization of UVRAG with indicated markers (data are mean ± SD, n = 150 cells obtained by gathering data of three independent experiments); **, p < 0.01; ***, p < 0.001.
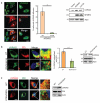
Figure 3
UVRAG association with the ER is PI(3)P-dependent. (a) UVRAG is released from the ER membrane in cells overexpressing MTMR3. HeLa cells transfected with MTMR3-mStrawberry or the catalytically inactive mutant MTMR3-C413S were stained with anti-UVRAG antibody and processed for confocal microscopy. Asterisks indicate MTMR3-transfected cells (left). Scale bars, 10 μm. The percentage of transfected cells with diffused staining of UVRAG was quantified (middle). Data are mean ± SD; n = 240 cells collected from four independent experiments; ** p < 0.01. Western blot analysis shows the levels of endogenous UVRAG in the presence or absence of MTMRS (right). See Supplementary Fig. S9 for uncropped data. (b) Wortmannin treatment releases UVRAG from the ER. HeLa cells were treated with 100 nM wortmannin for 1 hr, and processed for confocal microscopy using anti-UVRAG and anti-PDI antibodies. Insets highlight the relative localization of UVRAG at the ER. Scale bars, 10 μm. Confocal co-localization is indicated (middle panel). Data are mean ± SD; n = 75 cells for each group from three independent experiments; *** p < 0.001. Endogenous UVRAG and PDI expression before and after wortmannin treatment were confirmed by immunoblotting (right panel). See Supplementary Fig. S9 for uncropped data. (c) Mutation of the C2 domain leaves UVRAG unable to associate with the ER. HeLa cells expressing Flag-UVRAG (wt) or its K78A/R82A mutant were fixed and processed for confocal microscopy for colocalization with the ER marker PDI. Insets highlight the relative distribution of UVRAG at the ER. UVRAG and endogenous PDI expression were confirmed by immunoblotting. See Supplementary Fig. S9 for uncropped data. Scale bars, 10 μm.
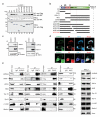
Figure 4
UVRAG interacts with the ER tethering complex. (a) UVRAG C-terminal 270-442 region interacts with RINT-1. Cells (293T) were co-transfected with HA-RINT-1, together with Flag-UVRAG or its mutant derivatives, and whole cell lysates (WCLs) were immunoprecipitated (IP) with anti-Flag, followed by immunoblotting (IB) with an anti-HA antibody. (b) Schematic representation of UVRAG (WT) and its deletion mutants, and summary of their interactions with RINT-1. Interaction was determined by coimmunoprecipitation of Flag-UVRAG with HA-RINT-1 from 293T cell lysates. +, strong binding; −, no binding. (c) Interaction between endogenous UVRAG and RINT-1. WCLs of 293T cells were used for IP with control serum (control) or an anti-UVRAG (left) or anti-RINT-1 antibody (right), followed by immunoblotting with the indicated antibodies. The bottom panel shows endogenous protein expression. (d) ER localization of RINT-1, ZW10 and UVRAG. HeLa cells were stained with anti-UVRAG (green), anti-PDI (ER marker, red), and anti-ZW10 or anti-RINT-1 (blue), followed by confocal microscopy. Insets highlight UVRAG co-localization with RINT-1 and ZW10 at the ER. Scale bars, 10 μm. (e) Interaction between endogenous UVRAG and the RINT-1-ZW10-NAG tethering complex proteins. WCLs of 293T cells were used for IP with control serum (IgG) or an anti-UVRAG (1st panel), anti-RINT-1 (2nd panel), anti-ZW10 (3rd panel), and anti-NAG (4th panel), followed by immunoblotting with the indicated antibodies. 10% of the whole-cell lysates were used as input. Syn18, syntaxin 18; Syn6, syntaxin 6. See Supplementary Fig. S9 for uncropped data.
Figure 5
UVRAG interaction with the ER tether and PI(3)P is required for COPI-dependent retrograde transport to the ER. (a) UVRAG knockdown impairs the interaction of the RINT-1-ZW10 complex with COPI in an autophagy-independent manner. Cells (293T) were transfected with control shRNA, UVRAG shRNA, or Atg16L1 shRNA for 72 hr. WCLs were used for IP with anti-RINT-1 (1st and 3rd panels), anti-ZW10 (2nd panel), or anti-UVRAG (4th panel), followed by immunoblotting with the indicated antibodies. Input represents 10% whole-cell lystates. Note that β'-COP interaction was suppressed by UVRAG knockdown but unaffected by Atg16L1 knockdown. See Supplementary Fig. S9 for uncropped data. (b) Retrograde transport of ts045-VSVG-KDELR-YFP from Golgi to the ER is inhibited by UVRAG knockdown. HeLa cells serially transfected with _UVRAG_- or _control_-shRNA, then with VSVG-KDELR-YFP expression vector, were incubated at 32°C (permissive condition) overnight. Upon shifting to 40°C (non-permissive condition), the ER-like distribution pattern of VSVG-KDELR-YFP was registered. Representative confocal images of the distribution pattern of VSVG-KDELR at 40°C and its co-localization with PDI were shown (upper panel). Data are mean ± SD, n = 100 cells obtained from three independent experiments; ** p < 0.01. Scale bars, 10 μm. (c) UVRAG interaction with PI(3)P and RINT-1 are both required for COPI-dependent retrograde transport, as shown by the redistribution of VSVG-KDELR from the Golgi to the ER. HeLa cells were transfected with control shRNA or UVRAG shRNA. The UVRAG-depleted cells were then complemented with empty vector, Flag-UVRAG, UVRAGΔ270-442, UVRAGK78A/R82A, or UVRAGΔC2, along with the transfection of VSVG-KDELR-YFP. The ER pattern for the chimeric KDELR was quantified. Data are the mean ± SD; n = 200 cells obtained from three independent experiments; * p < 0.05; ** p < 0.01. Endogenous and reconstituted UVRAG expression was confirmed by immunoblotting (right panel). (d) PI(3)P depletion inhibits Golgi-to-ER retrograde transport of VSVG-KDELR. HeLa cells were transfected with empty vector, wild-type, the C413S mutant of MTMR3, or treated with wortmannin or rapamycin, and then the ER pattern of VSVG-KDELR was quantified. Data are the mean ± SD; n = 100 cells for each group obtained from three independent experiments; ** p < 0.01. (e) Interaction between endogenous UVRAG and the ER tethering complex under wortmannin treatment. WCLs of 293T cells treated with wortmannin were used for IP with anti-UVRAG or anti-RINT-1 antibody, followed by immunoblotting with the indicated antibodies. The panel of input shows endogenous protein expression. See Supplementary Fig. S9 for uncropped data.
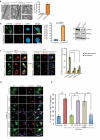
Figure 6
UVRAG and its interaction with RINT-1 and PI(3)P are required for _cis_-Golgi maintenance. (a) Golgi morphology upon UVRAG depletion. HeLa cells were transfected with _control_-or _UVRAG_-specific shRNA for 72 hr and subjected to electron microscopy (EM) analysis. Compared to control cells (left), the Golgi structure was swollen and fragmented in cells lacking UVRAG. The level of Golgi fragmentation was quantified (right). Data represents mean ± SD; n = 50 cells obtained by gathering data of two independent experiments; * p < 0.05. Scale bars, 500 nm. (b) Depletion of UVRAG leads to _cis_-Golgi dispersion. HeLa cells were transfected with _control_- or _UVRAG_-specific shRNA expressing GFP as an expression marker and then stained for GM130 (red; highlighted in arrows). Nuclei were stained with DAPI (blue). The dispersed distribution of GM130 in shRNA-transfected cells was quantified (middle). Data are the mean ± SD; n = 500 cells obtained from five independent experiments; p = 0.0001. The expression of UVRAG and GM130 in treated cells is also shown (right). Scale bars, 10 μm. (c) The effect of UVRAG on membrane trafficking from the ER to Golgi. HeLa cells serially transfected with _UVRAG_-, _RINT-1_-, or _Control_-shRNA, then with VSVG-GFP expression vector, were incubated at 40°C (non-permissive condition) overnight. The cells were then shifted to 32°C (permissive condition) for 30 min to allow cargo transit from the ER to the Golgi. Before and after the temperature shift, the cells were fixed and labeled with anti-PDI and anti-GM130 antibodies to define the ER and Golgi region, respectively. Representative confocal microscopy images of the distribution pattern of the retrograde cargo at 40°C and 32°C are shown (left). The Golgi-like distribution pattern of VSVG-GFP was registered (right). Data are mean ± SD; n = 100 cells from three independent experiments; ** p < 0.01. Scale bars, 10 μm. (d–e) UVRAG interaction with PI(3)P and RINT-1 are required for Golgi integrity. HeLa cells were transfected with control shRNA (1st row) or UVRAG shRNA (2nd to 6th rows). The UVRAG-depleted cells, as indicated by GFP expression, were then transfected with empty vector (2nd row), Flag-UVRAG (3rd row), UVRAGΔ270-442 mutant (4th row), UVRAGK78A/R82A mutant (5th row), or UVRAGΔCCD mutant (6th row), followed by confocal microscopy using anti-GM130 (red) for _cis_-Golgi staining, anti-Flag (purple) for the ectopically expressed UVRAG protein expression, and DAPI for nuclei (blue). Asterisks indicate shRNA-transfected cells and arrows denote the cells reconstituted with UVRAG (wt or mutant) expression. The dispersed distribution of GM130 was quantified (e), and data represent the mean ± SD; n = 200 cells from four independent experiments; * p < 0.05; ** p < 0.01.
Figure 7
UVRAG dissociates from the RINT-1-complex, and interacts with the Beclin1-complex during autophagy. (a–b) Differential interaction of UVRAG with the RINT-1-ZW10-NAG tethering complex and the Beclin1-Bif-1-PI(3)KC3 autophagy complex after treatment with rapamycin (a) and HBSS (b). Cells (293T) treated with rapamycin (50 nM) in (a) or with HBSS in (b) were subjected to IP with anti-UVRAG (1st panel), anti-RINT-1 (2nd panel), or anti-PI(3)KC3 (3rd panel), followed by immunoblotting with the indicated antibodies. Input (10%) shows endogenous protein expression. See Supplementary Fig. S9 for uncropped data. (c) Gel filtration analysis of UVRAG complex formation under normal conditions and after rapamycin-induced autophagy (50 nM). Affinity-purified UVRAG complexes from HCT116 cells stably expressing Flag-UVRAG were fractionated by Superose-6 gel filtration column and the eluates were analyzed by Western blotting for UVRAG, RINT-1, ZW10, Beclin1, PI3KC3, and Bif-1 proteins. Whole cell lysates (2.5%) were used as the input (lane-1). The elution profile of each protein was quantitated by densitometry analysis and normalized. Relative densitometry units were plotted against fraction number. Black arrows indicate the positions of the molecular weight size markers (kDa). Red arrows indicate the peak shift of the UVRAG eluates.
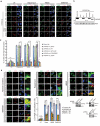
Figure 8
The role of Beclin1, RINT-1, and PI(3)P in UVRAG-mediated Atg9 trafficking during autophagy. (a–c) UVRAG interaction with Beclin1 and PI(3)P, but not with RINT-1, is required for autophagy-induced Atg9 dispersal. HeLa cells were stably transfected with control shRNA (1st row) or UVRAG shRNA (2nd–6th rows). The UVRAG-depleted cells were then transfected with empty vector (2nd row), Flag-UVRAG (3rd row), UVRAGΔ270–442 mutant (4th row), UVRAGK78A/R82A mutant (5th row), or UVRAGΔCCD mutant (6th row), and incubated in complete medium (untreated, UT, 1st panel), starvation medium (HBSS 2 hr, 3rd panel), or treated with rapamycin (50 nM 2 hr, 2nd panel) or SMER28 (50 μM, 2 hr, 4th panel). The distribution pattern of endogenous Atg9 (green) in the UVRAG (wt or mutant)-transduced cells (red) was analyzed by confocal microscopy (a). Asterisks denote condensed (non-dispersed) Atg9 in _UVRAG_-depleted HeLa cells and arrows denote the cells complemented with the wild-type or mutant UVRAG. The percentage of cells with Atg9 translocation was quantified in (c) and the expression of UVRAG and actin were immunoblotted and shown in (b). Data represent the mean ± SD; n = 300 cells from three independent experiments; n.s., not significant; **, p < 0.01; ***, p < 0.001. Scale bars, 10 μm. (d) Effect of knockdown of UVRAG, Beclin1, and RINT-1 on the translocation of Atg9 to the LC3-labelled autophagsomes during autophagy. _Control_-, _UVRAG_-, _Beclin1_-, or _RINT-1_-knockdown HeLa cells were incubated in complete medium (normal condition), starvation medium (HBSS, 2 hr), or treated with rapamycin (100 nM, 2 hr) or SMER28 (50 μM, 2 hr). The cells were then stained for endogenous Atg9 (green) and LC3 (red) followed by confocal microscopy analysis. The percentage of Atg9-vesicles colocalized with LC3+-autophagic puncta was quantified (bottom middle). Endogenous UVRAG, Beclin1, and RINT-1 protein expression are shown (bottom right). Data represents mean ± SD; n = 200 cells obtained from three independent experiments. n.s. not significant; * p < 0.05; ** p < 0.01; *** p < 0.001. Scale bars, 10 μm.
Similar articles
- The intersection of Golgi-ER retrograde and autophagic trafficking.
He S, O'Connell D, Zhang X, Yang Y, Liang C. He S, et al. Autophagy. 2014 Jan;10(1):180-1. doi: 10.4161/auto.26917. Epub 2013 Nov 15. Autophagy. 2014. PMID: 24246972 Free PMC article. - Beclin 1 forms two distinct phosphatidylinositol 3-kinase complexes with mammalian Atg14 and UVRAG.
Itakura E, Kishi C, Inoue K, Mizushima N. Itakura E, et al. Mol Biol Cell. 2008 Dec;19(12):5360-72. doi: 10.1091/mbc.e08-01-0080. Epub 2008 Oct 8. Mol Biol Cell. 2008. PMID: 18843052 Free PMC article. - Impaired autophagy and APP processing in Alzheimer's disease: The potential role of Beclin 1 interactome.
Salminen A, Kaarniranta K, Kauppinen A, Ojala J, Haapasalo A, Soininen H, Hiltunen M. Salminen A, et al. Prog Neurobiol. 2013 Jul-Aug;106-107:33-54. doi: 10.1016/j.pneurobio.2013.06.002. Epub 2013 Jul 1. Prog Neurobiol. 2013. PMID: 23827971 Review. - Bif-1 interacts with Beclin 1 through UVRAG and regulates autophagy and tumorigenesis.
Takahashi Y, Coppola D, Matsushita N, Cualing HD, Sun M, Sato Y, Liang C, Jung JU, Cheng JQ, Mulé JJ, Pledger WJ, Wang HG. Takahashi Y, et al. Nat Cell Biol. 2007 Oct;9(10):1142-51. doi: 10.1038/ncb1634. Epub 2007 Sep 23. Nat Cell Biol. 2007. PMID: 17891140 Free PMC article. - The Golgi as an Assembly Line to the Autophagosome.
De Tito S, Hervás JH, van Vliet AR, Tooze SA. De Tito S, et al. Trends Biochem Sci. 2020 Jun;45(6):484-496. doi: 10.1016/j.tibs.2020.03.010. Epub 2020 Apr 16. Trends Biochem Sci. 2020. PMID: 32307224 Review.
Cited by
- Autophagy: An Essential Degradation Program for Cellular Homeostasis and Life.
Chun Y, Kim J. Chun Y, et al. Cells. 2018 Dec 19;7(12):278. doi: 10.3390/cells7120278. Cells. 2018. PMID: 30572663 Free PMC article. Review. - Beclin 1 is required for neuron viability and regulates endosome pathways via the UVRAG-VPS34 complex.
McKnight NC, Zhong Y, Wold MS, Gong S, Phillips GR, Dou Z, Zhao Y, Heintz N, Zong WX, Yue Z. McKnight NC, et al. PLoS Genet. 2014 Oct 2;10(10):e1004626. doi: 10.1371/journal.pgen.1004626. eCollection 2014 Oct. PLoS Genet. 2014. PMID: 25275521 Free PMC article. - Bcl-xL Affects Group A Streptococcus-Induced Autophagy Directly, by Inhibiting Fusion between Autophagosomes and Lysosomes, and Indirectly, by Inhibiting Bacterial Internalization via Interaction with Beclin 1-UVRAG.
Nakajima S, Aikawa C, Nozawa T, Minowa-Nozawa A, Toh H, Nakagawa I. Nakajima S, et al. PLoS One. 2017 Jan 13;12(1):e0170138. doi: 10.1371/journal.pone.0170138. eCollection 2017. PLoS One. 2017. PMID: 28085926 Free PMC article. - Cryo-EM structure and biochemical analysis reveal the basis of the functional difference between human PI3KC3-C1 and -C2.
Ma M, Liu JJ, Li Y, Huang Y, Ta N, Chen Y, Fu H, Ye MD, Ding Y, Huang W, Wang J, Dong MQ, Yu L, Wang HW. Ma M, et al. Cell Res. 2017 Aug;27(8):989-1001. doi: 10.1038/cr.2017.94. Epub 2017 Jul 21. Cell Res. 2017. PMID: 28731030 Free PMC article. - A strategy to identify a ketoreductase that preferentially synthesizes pharmaceutically relevant (S)-alcohols using whole-cell biotransformation.
Haq SF, Shanbhag AP, Karthikeyan S, Hassan I, Thanukrishnan K, Ashok A, Sukumaran S, Ramaswamy S, Bharatham N, Datta S, Samant S, Katagihallimath N. Haq SF, et al. Microb Cell Fact. 2018 Dec 3;17(1):192. doi: 10.1186/s12934-018-1036-2. Microb Cell Fact. 2018. PMID: 30509260 Free PMC article.
References
- Jean S, Kiger AA. Coordination between RAB GTPase and phosphoinositide regulation and functions. Nat Rev Mol Cell Biol. 2012;13:463–70. - PubMed
- Burman C, Ktistakis NT. Regulation of autophagy by phosphatidylinositol 3-phosphate. FEBS Lett. 2010;584:1302–12. - PubMed
- Amoasii L, et al. Myotubularin and PtdIns3P remodel the sarcoplasmic reticulum in muscle in vivo. Journal of Cell Science. 2013 - PubMed
Publication types
MeSH terms
Substances
Grants and funding
- R21 AI083841/AI/NIAID NIH HHS/United States
- R01 CA140964/CA/NCI NIH HHS/United States
- U19 AI083025/AI/NIAID NIH HHS/United States
- R21 CA161436/CA/NCI NIH HHS/United States
- R01 DE021445/DE/NIDCR NIH HHS/United States
- U19AI083025/AI/NIAID NIH HHS/United States
LinkOut - more resources
Full Text Sources
Other Literature Sources
Molecular Biology Databases
Research Materials
Miscellaneous
