Pint lincRNA connects the p53 pathway with epigenetic silencing by the Polycomb repressive complex 2 - PubMed (original) (raw)
doi: 10.1186/gb-2013-14-9-r104.
Francesco P Marchese, Alejandro Athie, Yolanda Sánchez, Jovanna González, Victor Segura, Lulu Huang, Isabel Moreno, Alfons Navarro, Mariano Monzó, Jesús García-Foncillas, John L Rinn, Shuling Guo, Maite Huarte
- PMID: 24070194
- PMCID: PMC4053822
- DOI: 10.1186/gb-2013-14-9-r104
Pint lincRNA connects the p53 pathway with epigenetic silencing by the Polycomb repressive complex 2
Oskar Marín-Béjar et al. Genome Biol. 2013.
Abstract
Background: The p53 transcription factor is located at the core of a complex wiring of signaling pathways that are critical for the preservation of cellular homeostasis. Only recently it has become clear that p53 regulates the expression of several long intergenic noncoding RNAs (lincRNAs). However, relatively little is known about the role that lincRNAs play in this pathway.
Results: Here we characterize a lincRNA named Pint (p53 induced noncoding transcript). We show that Pint is aubiquitously expressed lincRNA that is finely regulated by p53. In mouse cells, Pint promotes cell proliferation and survival by regulating the expression of genes of the TGF-b, MAPK and p53 pathways. Pint is a nuclear lincRNA that directly interacts with the Polycomb repressive complex 2 (PRC2), and is required for PRC2 targeting of specific genes for H3K27 tri-methylation and repression. Furthermore, Pint functional activity is highly dependent on PRC2 expression. We have also identified Pint human ortholog (PINT), which presents suggestive analogies with the murine lincRNA. PINT is similarly regulated by p53, and its expression significantly correlates with the same cellular pathways as the mouse ortholog, including the p53 pathway. Interestingly, PINT is downregulated in colon primary tumors, while its overexpression inhibits the proliferation of tumor cells, suggesting a possible role as tumor suppressor.
Conclusions: Our results reveal a p53 autoregulatory negative mechanism where a lincRNA connects p53 activation with epigenetic silencing by PRC2. Additionally, we show analogies and differences between the murine and human orthologs, identifying a novel tumor suppressor candidate lincRNA.
Figures
Figure 1
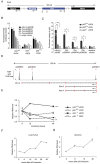
Pint is a p53-regulated long intergenic non-coding RNA (lincRNA). (A) Schematic representation of the Pint genomic locus. Asterisks represent p53 response elements (p53REs). (B) Relative firefly luciferase expression driven by genomic sequences containing p53REs in p53-restored p53LSL/LSL (p53+/+) or p53LSL/LSL (p53-/-) cells treated with doxorubicin. Values were normalized by Renilla levels and are the mean ± standard deviation (SD) of three biological replicates. Asterisks represent significant differences determined by _t_-test relative to the same plasmid transfected in doxorubicin (DOX)-treated p53-/-. (C) Effect on Pint p53RE-1, p53RE-2, and p53RE-3, Cdkn1a p53RE, or an irrelevant region (control) of p53 chromatin immunoprecipitation (ChIP) enrichment in p53-restored p53LSL/LSL (p53+/+) or p53LSL/LSL (p53-/-) cells treated with doxorubicin (+DOX) or left untreated (-DOX). Enrichment values are relative to input and the mean ± SD of three biological replicates. Asterisks represent statistical significant differences from the control as determined by _t_-test (*P<0.05, **P<0.01). (D) (Top) p53 ChIP sequencing (ChIP-seq) peaks from mouse embryonic fibroblasts (MEFs) treated with doxorubicin [21]. Positions of p53REs are indicated by red asterisks. (Bottom) Pint variants identified by 5' and 3' rapid amplification of cDNA ends (RACE) cloning. (E) Pint levels detected by quantitative real time RT-qPCR in p53-restored p53LSL/LSL (p53+/+) or p53LSL/LSL (p53-/-) cells treated with 150 nM doxorubicin (+DOX) or left untreated (-DOX) for the indicated time (values represent the mean ± SD of three biological replicates, and asterisks represent significant differences of Pint level at 48 hours relative to the doxorubicin-treated p53-/- cells). (F,G) Pint levels at different times after p53 restoration in (F) lung tumor (G) and sarcoma cell lines. Values are the mean ± SD of four replicates.
Figure 2
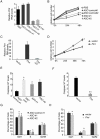
PINT modulates cell proliferation and apoptosis. (A) Inhibition of Pint. Pint levels were detected by quantitative real time (RT-qPCR) in p53-restored doxorubicin-treated p53LSL/LSL MEFs 36 hours after transfection with two _Pint_-specific anti-sense oligonucleotides (ASOs) (ASO1 and ASO2), two control ASOs (control ASO -1 and -2), or a blank (PBS) control, and 12 hours of doxorubicin treatment. Values normalized to Gapdh and are the mean ± SD of three replicates. (B) Pint positively regulates cell proliferation. Relative number of p53-restored p53LSL/LSL mouse embryonic fibroblasts (MEFs) transfected with ASOs for Pint inhibition, and treated with doxorubicin from 24 h post-transfection. Cell numbers are determined by MTS assay. Values are mean ± SD of three replicates. (C) Overexpression of Pint. Pint levels where measured like in (A) in p53-restored doxorubicin-treated p53LSL/LSL MEFs 36 hours after transfection and 12 hours of doxorubicin treatment with Pint A isoform expressing plasmid or an empty plasmid as control. (D) Pint positively regulates cell proliferation. Cells were transfected as in (C) and treated with doxorubicin from 24 hours post-transfection. (E,F). Negative effect of Pint on apoptosis induction. Apoptosis levels were determined by quantification of caspase 3/7 levels after (E) inhibition or (F) overexpression of Pint in p53-restored p53LSL/LSL MEFs treated with doxorubicin. Values are the mean ± SD of three replicates. (G,H). Effect of Pint on cell cycle regulation. Relative cell numbers in each cell cycle phase were determined by fluorescence-activated cell sorting (FACS) of bromodeoxyuridine (BrdU) incorporation and propidium iodide (PI) staining of p53-restored p53LSL/LSL MEFs treated as in (A) or (C). Percentages of cells in each phase are represented and values are the mean ± SD of three replicates.
Figure 3
PINT regulates the expression of genes involved in cell proliferation and survival, including genes of the p53 pathway. (A) (Left) Significant KEGG (Kyoto Encyclopedia of Genes and Genomes) pathways enriched in the 947 genes regulated by Pint. Center: Venn diagram representing the number of genes affected by Pint (947), and p53 knockdown in p53-restored doxorubicin-treated p53LSL/LSL mouse embryonic fibroblasts (MEFs) (B > 3). P-value represents the probability associated with the overlap between both gene sets (86 genes). (Right) Significant biologic functions of genes co-regulated by Pint and p53. The red line represents P = 0.05. (B) Predicted p53 regulatory network based on the fold change of genes affected by Pint depletion (ingenuity pathway analysis). (C) Relative Pint RNA levels after Pint or p53 depletion. Values are normalized to Gapdh and are the mean ± SD of four replicates. (D) Genes commonly affected by Pint and p53 depletion (B > 3). Colors represent transcripts above (blue) or below (red) the global median, scaled to twofold activation or repression, respectively.
Figure 4
Pint is a nuclear long intergenic non-coding RNA (lincRNA) that interacts with PRC2. (A) Pint subcellular localization. Percentage of total RNA found in the nuclear and cytoplasmic fractions of p53-restored doxorubicin-treated p53LSL/LSL mouse embryonic fibroblasts (MEFs) determined by quantitative real time(RT-qPCR). (B) Single-molecule visualization of Pint. RNA fluorescent in situ hybridization (FISH) of Pint in 3T3 cells untreated (-DOX) or treated (+DOX) with doxorubicin. (C) Quantification of the relative subcellular distribution of Pint FISH foci. (D) Physical association between Pint and PRC2 after chemical crosslinking of cells. Suz12 or Wdr5 were immunoprecipitated from nuclear extracts of formaldehyde-crosslinked p53-restored doxorubicin-treated p53LSL/LSL MEFs, and associated RNAs were detected by RT-qPCR. The relative enrichment was calculated as the amount of RNA associated with Suz12 or Wdr5 IP relative to the IgG control. Gapdh mRNA was used as control RNA. (E) In vitro interaction of Pint with Polycomb repressive complex 2 (PRC2). Protein associated with biotinylated Pint or the anti-sense (control) RNA incubated with nuclear extracts. The bottom band shows the crossreaction of the antibody with a non-specific binding protein. (F) Direct binding of PRC2 and Pint. Protein bound to Pint or anti-sense (control) RNA when incubated with purified PRC2.
Figure 5
PINT is required for Polycomb repressive complex 2 (PRC2) targeting of specific genes for repression. (A) Representation of the number of genes that are regulated by Pint in p53-p53LSL/LSL mouse embryonic fibroblasts (MEFs) (B > 3) (left) and/or reported as bound by Suz12 [31]. The _P_-value represents the probability associated with the overlap between both gene sets. (B) Mean H3K27me3 ChIP-seq signal around the transcription start site (TSS) of genes regulated by Pint but not bound by Suz12 (blue)l genes bound by Suz12 but not regulated by Pint (red)l and genes regulated by Pint and bound by Suz12 (green) in mouse embryonic stem cells (mESCs) [9]. (C) The most significant functions of genes regulated by Pint and bound by Suz12. (D,E) Relative (D) Suz12 or (E) H3K27me3 enrichment in promoter regions of H3K27me3-regulated genes [32] in doxorubicin (DOX)-treated p53-reconstituted p53LSL/LSL MEFs treated with Pint antisense oligonucleotides (ASOs) or control ASOs determined by chromatin immunoprecipitation-quantitative PCR (ChIP-qPCR). Enrichment values are relative to IgG and the ASO control, and are the mean ± SD of three replicates. For each gene, asterisks indicate the significant difference between ASO Pint and ASO control: *P < 0.05; **P < 0.001**(F)** Relative cell numbers of control short hairpin RNA (shRNA) stable 3T3 MEFs transfected with the indicated ASOs or plasmids. (G) Relative cell numbers of Ezh2 shRNA stable 3T3 MEFs treated as in (F). Values are the mean ± SD of three replicates. *P < 0.05; **P < 0.001 relative to the control transfection.
Figure 6
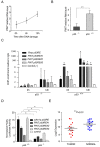
Human PINT is a p53-regulated long intergenic non-coding RNA (lincRNA) downregulated in colorectal cancer. (A) PINT is induced by 5-fluoracil (5-FU)-induced DNA damage. Relative PINT expression levels in HCT116 cells treated with 5-FU for the indicated times. (B) PINT is regulated by p53. Relative PINT levels in p53+/+ or p53-/- matched HCT116 cells treated with 5-FU for 12 hours. Values are the mean ± SD of three replicates normalized to GAPDH. Asterisks represent significant difference between conditions. (C) p53 binds to p53 response elements (p53REs) in the PINT locus upon 5FU-induced DNA damage. Relative chromatin immunoprecipitation (ChIP) enrichment of p53 to the indicated regions in p53+/+ or p53-/- matched HCT116 cells after the indicated times of treatment with 5-FU. Binding to the PERP promoter was included as a positive control and binding to an irrelevant genomic region as the negative control. Enrichment values are relative to IgG and to the negative control for each treatment condition. The mean ± SD of three biologic replicates of a representative experiment is shown, and the significant differences relative to the control are indicated with asterisks. (D) p53 drives the transcription of PINT. Relative firefly luciferase expression driven by the indicated genomic sequences with p53REs in p53+/+ or p53-/- matched HCT116 cells after treatment with 5-FU. Values were normalized to Renilla levels and are the mean ± SD of three replicates.(E) PINT is downregulated in colorectal tumors. PINT relative expression levels in colorectal cancer samples and normal peripheral tissue.
Figure 7
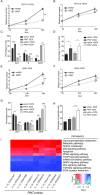
Human PINT inhibits tumor cell growth. (A.B). Relative number of _PINT_-overexpressing HCT116 cells (PINT) or control cells (vector) that were (A) left untreated or (B) treated with 500 nM doxorubicin (DOX), as determined by MTS assay. (C) Relative number of cells of HCT116 stable cell lines in each phase of the cell cycle. Cells were treated as for (A) and (B) for 12 hours, and cell cycle phases were determined by fluorescence-activated cell sorting (FACS) of bromodeoxyuridine (BrdU) incorporation and propidium iodide (PI) staining. (D) Percentage of apoptotic cells in HCT116 stable cell lines treated as in (C), determined by quantification of annexin V-positive cells. (E,F). Relative number of _PINT_-overexpressing A549 cells (PINT) or control cells (vector) that were (E) left untreated or were treated with 500 nM doxorubicin (F), as determined by MTS assay. (G) Relative number of A549 stable cell lines in each phase of the cell cycle determined as in (C). (H) Relative number of cells of A549 stable cell lines undergoing apoptosis, determined as in (D). (I) Correlation of PINT with KEGG (Kyoto Encyclopedia of Genes and Genomes) pathways. Significant correlation coefficients between the indicated cellular pathways and PINT microarray probes.
Similar articles
- PINTing for p53.
Shiekhattar R. Shiekhattar R. Genome Biol. 2013;14(9):132. doi: 10.1186/gb-2013-14-9-132. Genome Biol. 2013. PMID: 24079657 Free PMC article. - P53-regulated long non-coding RNA TUG1 affects cell proliferation in human non-small cell lung cancer, partly through epigenetically regulating HOXB7 expression.
Zhang EB, Yin DD, Sun M, Kong R, Liu XH, You LH, Han L, Xia R, Wang KM, Yang JS, De W, Shu YQ, Wang ZX. Zhang EB, et al. Cell Death Dis. 2014 May 22;5(5):e1243. doi: 10.1038/cddis.2014.201. Cell Death Dis. 2014. PMID: 24853421 Free PMC article. - The intronic long noncoding RNA ANRASSF1 recruits PRC2 to the RASSF1A promoter, reducing the expression of RASSF1A and increasing cell proliferation.
Beckedorff FC, Ayupe AC, Crocci-Souza R, Amaral MS, Nakaya HI, Soltys DT, Menck CF, Reis EM, Verjovski-Almeida S. Beckedorff FC, et al. PLoS Genet. 2013;9(8):e1003705. doi: 10.1371/journal.pgen.1003705. Epub 2013 Aug 22. PLoS Genet. 2013. PMID: 23990798 Free PMC article. - The role of lincRNA-p21 in regulating the biology of cancer cells.
Huang Y, Yi Q, Feng J, Xie W, Sun W, Sun W. Huang Y, et al. Hum Cell. 2022 Nov;35(6):1640-1649. doi: 10.1007/s13577-022-00768-4. Epub 2022 Aug 15. Hum Cell. 2022. PMID: 35969349 Review. - Functions of long intergenic non-coding (linc) RNAs in plants.
Yamada M. Yamada M. J Plant Res. 2017 Jan;130(1):67-73. doi: 10.1007/s10265-016-0894-0. Epub 2016 Dec 20. J Plant Res. 2017. PMID: 27999969 Review.
Cited by
- Environmental Health and Long Non-coding RNAs.
Karlsson O, Baccarelli AA. Karlsson O, et al. Curr Environ Health Rep. 2016 Sep;3(3):178-87. doi: 10.1007/s40572-016-0092-1. Curr Environ Health Rep. 2016. PMID: 27234044 Free PMC article. Review. - Non-Syndromic Intellectual Disability and Its Pathways: A Long Noncoding RNA Perspective.
Barros II, Leão V, Santis JO, Rosa RCA, Brotto DB, Storti CB, Siena ÁDD, Molfetta GA, Silva WA Jr. Barros II, et al. Noncoding RNA. 2021 Mar 11;7(1):22. doi: 10.3390/ncrna7010022. Noncoding RNA. 2021. PMID: 33799572 Free PMC article. Review. - Genetic and epigenetic profiling of CLL disease progression reveals limited somatic evolution and suggests a relationship to memory-cell development.
Smith EN, Ghia EM, DeBoever CM, Rassenti LZ, Jepsen K, Yoon KA, Matsui H, Rozenzhak S, Alakus H, Shepard PJ, Dai Y, Khosroheidari M, Bina M, Gunderson KL, Messer K, Muthuswamy L, Hudson TJ, Harismendy O, Barrett CL, Jamieson CH, Carson DA, Kipps TJ, Frazer KA. Smith EN, et al. Blood Cancer J. 2015 Apr 10;5(4):e303. doi: 10.1038/bcj.2015.14. Blood Cancer J. 2015. PMID: 25860294 Free PMC article. - Long noncoding RNA EGOT negatively affects the antiviral response and favors HCV replication.
Carnero E, Barriocanal M, Prior C, Pablo Unfried J, Segura V, Guruceaga E, Enguita M, Smerdou C, Gastaminza P, Fortes P. Carnero E, et al. EMBO Rep. 2016 Jul;17(7):1013-28. doi: 10.15252/embr.201541763. Epub 2016 Jun 9. EMBO Rep. 2016. PMID: 27283940 Free PMC article. - EZH2 RIP-seq Identifies Tissue-specific Long Non-coding RNAs.
Wang Y, Xie Y, Li L, He Y, Zheng D, Yu P, Yu L, Tang L, Wang Y, Wang Z. Wang Y, et al. Curr Gene Ther. 2018;18(5):275-285. doi: 10.2174/1566523218666181008125010. Curr Gene Ther. 2018. PMID: 30295189 Free PMC article.
References
- Huarte M, Guttman M, Feldser D, Garber M, Koziol MJ, Kenzelmann-Broz D, Khalil AM, Zuk O, Amit I, Rabani M, Attardi LD, Regev A, Lander ES, Jacks T, Rinn J. A large intergenic noncoding RNA induced by p53 mediates global gene repression in the p53 response. Cell. 2010;14:409–419. doi: 10.1016/j.cell.2010.06.040. - DOI - PMC - PubMed
- Hung T, Wang Y, Lin MF, Koegel AK, Kotake Y, Grant GD, Horlings HM, Shah N, Umbricht C, Wang P, Wang Y, Kong B, Langerød A, Børresen-Dale AL, Kim SK, van de Vijver M, Sukumar S, Whitfield ML, Kellis M, Xiong Y, Wong DJ, Chang HY. Extensive and coordinated transcription of noncoding RNAs within cell-cycle promoters. Nat Genet. 2011;14:621–629. doi: 10.1038/ng.848. - DOI - PMC - PubMed
Publication types
MeSH terms
Substances
LinkOut - more resources
Full Text Sources
Other Literature Sources
Molecular Biology Databases
Research Materials
Miscellaneous


