The transmission of nuclear pore complexes to daughter cells requires a cytoplasmic pool of Nsp1 - PubMed (original) (raw)
The transmission of nuclear pore complexes to daughter cells requires a cytoplasmic pool of Nsp1
Paolo Colombi et al. J Cell Biol. 2013.
Abstract
Nuclear pore complexes (NPCs) are essential protein assemblies that span the nuclear envelope and establish nuclear-cytoplasmic compartmentalization. We have investigated mechanisms that control NPC number in mother and daughter cells during the asymmetric division of budding yeast. By simultaneously tracking existing NPCs and newly synthesized NPC protomers (nups) through anaphase, we uncovered a pool of the central channel nup Nsp1 that is actively targeted to the bud in association with endoplasmic reticulum. Bud targeting required an intact actin cytoskeleton and the class V myosin, Myo2. Selective inhibition of cytoplasmic Nsp1 or inactivation of Myo2 reduced the inheritance of NPCs in daughter cells, leading to a daughter-specific loss of viability. Our data are consistent with a model in which Nsp1 releases a barrier that otherwise prevents NPC passage through the bud neck. It further supports the finding that NPC inheritance, not de novo NPC assembly, is primarily responsible for controlling NPC number in daughter cells.
Figures
Figure 1.
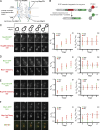
A newly synthesized bud-directed pool of Nsp1. (A) Schematic of the NPC with major structural units and representative nups indicated in bold. ONM and INM, outer and inner nuclear membrane, respectively. (B) Schematic of the RITE cassette inserted in frame at the 3′ end of nup genes. Nup-mCherry fusions (old) are produced in cells. The addition of estradiol releases a Cre recombinase–EBD fusion that promotes loxP-mediated recombination, which leads to the replacement of the mCherry gene with a GFP ORF and the production of a nup-GFP (new) protein. (C–F) Cells expressing the indicated Nup-RITE fusions (PCCPL520, PCCPL522, PCCPL526, and WZCPL2) were incubated in the presence of estradiol, and both Nup-GFP and Nup-mCherry were imaged every 3 min through the indicated anaphase stages. Each fluorescence micrograph is a maximum-intensity projection of a deconvolved z series. Note the arrowhead in F showing a bud-localized focus of Nsp1 that does not colocalize with the NE until the last time point (see MERGE and
Video 1
). C1–F2 are plots (left) of a ratio of tf (green and red) in daughters (tfd) versus mothers (tfm). These ratios were then divided by a ratio of the surface area of the proportion of the dividing nucleus (through a middle z plane) found in either the daughter (sad) or mother (sam) to yield plots at right. 6 ≤ n ≤ 13. Error bars represent the standard deviation from the mean value. Bars, 2 µm.
Figure 2.
Conditional and specific trapping of newly synthesized nups. (A) Schematic of the “anchor-away” strategy where nup genes are genomically tagged with ORFs encoding FRB or FRB-GFP and expressed in cells containing a plasma membrane–localized anchor (Pma1-FKBP12; hook). In the presence of rapamycin, only newly synthesized/cytoplasmic nups (Nup-FRB-GFP_CYT_, green ovals) are sequestered, but not those bound to NPCs (Nup-FRB-GFP_NPC_, red ovals). (B) Yeast strains containing the indicated Nup-FRB fusions (PCCPL260, PCCPL251) with wild-type control (HHY110), and indicated plasmids were plated in 10-fold serial dilutions on YPD plates containing rapamycin or carrier (DMSO) and imaged after 48 h at 30°C. (C) Deconvolved fluorescence micrographs (with bright field) of a top and middle z section of cells expressing the indicated Nup-FRB-GFP fusions (PCCPL259, PCCPL302, CPL1238, and CPL1239) incubated for 4 h with rapamycin or with rapamycin and cycloheximide. Bars, 2 µm.
Figure 3.
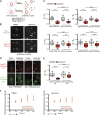
Trapping of newly synthesized components of the Nsp1 complex inhibits NPC inheritance. (A) Schematic of the experimental design where anchor-away (see Fig. 2) strains expressing Nup-FRB-GFP fusions were grown to mid-log phase and treated with DMSO or rapamycin (to trap Nup-FRB-GFP_CYT_). Unbudded cells were imaged through one or two cell cycles (∼4 h). Quantification of Nup-FRB-GFP_NPC_ was performed at a time point directly after anaphase is completed in mother (M) and daughter (D) cells. (B) Deconvolved fluorescent images showing the distribution of Nsp1-FRB-GFP and Nup170-mCherry (CPL1229) in a middle z plane of cells treated with DMSO or rapamycin after anaphase. Pixels in the GFP channel have been digitally saturated to aid in the visualization of the daughter NE. Cell boundaries are denoted by the outlines. Bar, 2 µm. (C) In each of the indicated Nup-FRB-GFP/Nup170-mCherry–expressing strains (CPL1229, PCCPL510, PCCPL511, and PCCPL293), the tf of the GFP and mCherry fluorescence of daughter (tfd) and mother (tfm) NEs was measured after completion of anaphase under DMSO- or rapamycin-treated conditions. 30 ≤ n ≤ 75. A ratio of tfd/tfm was plotted for individual cells in a box plot: boxes are the 25th to 75th percentiles and whiskers are the 10th and 90th percentiles. Outliers are shown as individual points. The mean is indicated by “+.” Significance was assessed using the Student’s t test. ***, P = 0.0003; ****, P < 0.0001. (D) Small-budded cells expressing Nsp1-FRB and Nup133-2xDendra (CPL1231) were treated with DMSO or rapamycin. Nup133-2xDendra was photoconverted to its red form (photoconversion) and allowed to progress through anaphase. The fluorescence images are a middle focal plane from a deconvolved z series in red (old) and green (new) channels. Cell boundaries are denoted by the outlines. Bar, 2 µm. (E) tfd/tfm for both red and green fluorescence (and statistics) are plotted as in C. 36 ≤ n ≤ 47. *, P < 0.05; ****, P < 0.0001. (F) CPL1229 expressing Nsp1-FRB-GFP and Nup170-mCherry was treated with DMSO or rapamycin. G1 cells were imaged until anaphase (2 h), and tf was measured for both GFP and mCherry every 30 min. tf measurements were normalized to the minimum value in each time series and plotted against time (h). Error bars are the standard deviation from the mean. n = 6.
Figure 4.
NPC inheritance does not depend on de novo NPC assembly but is required for daughter viability. (A) Deconvolved image of a middle z plane showing Nup192-FRB-GFP (PCCPL528) or Nup120-FRB-GFP (WZCPL5) after completion of anaphase in the presence of rapamycin. M and D, mother and daughter, respectively. Bars, 2 µm. (B) Plot of tfd/tfm for Nup192-FRB-GFP and Nup120-FRB-GFP as in Fig. 3. 42 ≤ n ≤ 55. (C) Single mother (M) cells expressing Nsp1-FRB-GFP (PCCPL487) or Nup192-FRB-GFP (PCCPL552) were grown in a microfluidic chamber perfused with rapamycin for 24 h. Each daughter was assigned a number (starting with 1) and their daughters assigned the same number followed by a letter to denote their parentage and order of appearance (starting with “a”). Bars, 5 µm. (D) Quantification of C where the average number of buds from mother and daughter cells is plotted. 29 and 32 mother cells (from two independent experiments) were analyzed for PCCPL487 and PCCPL552 strains, respectively. Error bars indicate standard deviation from the mean.
Figure 5.
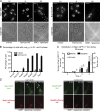
The Nsp1 complex has a cytoplasmic pool localized to the daughter bud. (A) Fluorescence micrographs (and bright field) of Nsp1-GFP– and Nup170-GFP–expressing cells (CPL1234, BWCPL437, PCCPL423, and PCCPL409) arrested in G1, S, or G2 phase with α-factor–, hydroxyurea-, or galactose-induced overexpression of SWE1, respectively. To visualize cytoplasmic foci, we show maximum-intensity projections of a deconvolved z series where 0.4% of pixels have been digitally saturated. Bars, 5 µm. (B) Plot showing the percentage of cells where the indicated nups were found in cytoplasmic foci in α-factor– or hydroxyurea-arrested cells. 90 ≤ n ≤ 190. Error bars indicate standard error of the mean. (C) Plot showing the number of Nsp1-GFP_CYT_ foci and their distribution in daughter buds and mother cells during 3 h of a G2 arrest. At the indicated times, >100 cells were scored. Error bars indicate standard deviations from the mean. Bud size is the surface area of the bud (µm2). (D) _NSP1_-(PCCPL506)– and NUP85-RITE (PCCPL523)–containing strains were grown in the presence of galactose (to induce a G2 arrest) and estradiol and imaged over several hours (see
Videos 2
and
3
). Fluorescence micrographs (maximum-intensity projections of a deconvolved z series) of the GFP and mCherry forms of Nsp1 and Nup85 are shown at the indicated time points. Note the specific appearance of Nsp1-GFP “new” (arrowheads) in the elongated bud. Bars, 5 µm.
Figure 6.
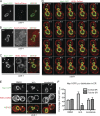
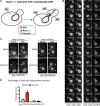
Nsp1-GFP_CYT_ foci interact with ER in the daughter cell. In all images shown, cdc6-1 cells were arrested in G2/M for 3 h at 34°C and then imaged at RT. (A–C) Deconvolved fluorescence micrographs of one z section of cdc6-1 cells expressing Nsp1-GFP and either Kar9-mCherry (PCCPL535), Exo70-mCherry (PCCPL532), or HDEL-DsRed (PCCPL533). Green and red channels are shown in addition to the merge. Arrowheads point to Nsp1-GFP_CYT_ foci. (D) A time-lapse series (Δt = 5 s) of PCCPL533 cells. Each time point is a merge of Nsp1-GFP and HDEL-DsRed images from one z plane. Arrowheads point to a Nsp1-GFP_CYT_ focus (
Video 4
). (E) PCCPL533 cells were treated with latrunculin A (lat A), nocodazole, or DMSO. Deconvolved micrographs from one z section of a representative cell are shown (green, red, and merged images). Nsp1-GFP_CYT_ foci are indicated by arrowheads. (F) Quantification of E showing the distribution of Nsp1-GFP_CYT_ between the cortical and tubular ER under the indicated conditions. 58 ≤ n ≤ 71. Bars, 2 µm.
Figure 7.
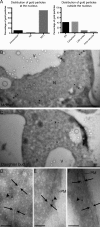
Nsp1_CYT_ interacts with ER at high resolution. cdc6-1 cells (PCCPL393) were arrested in G2/M phase for 3 h at 34°C, released for 3 h at RT, and then processed for immuno-EM. An anti-Nsp1 antibody followed by a 10 nm gold–conjugated secondary antibody were used to localize Nsp1. (A) Plot of the percentage of gold particles from a single experiment both at (left; n = 71) and outside (right; n = 46) the nucleus in association with the indicated cellular structures. (B and C) EM micrographs of a mother and bud (daughter) of the same cell. N, nucleus; V, vacuole. Asterisks indicate NPCs and arrowheads point to gold particles. Bars, 1 µm. (D–F) High-magnification views of gold particles in association with internal ER (D) and cortical ER (E and F). Arrows delimit the two ER membranes with intervening cistern. Arrowheads point to gold particles. PM, plasma membrane. Bars, 100 nm.
Figure 8.
Nsp1_CYT_ associates with NP and contributes to nuclear positioning. (A) Schematic of the association of Nsp1_CYT_ with ER tubules that connect the mother NE and daughter cortex through the exocyst complex and contribute to the formation of NP. Red ovals, NPCs; green triangles, Nsp1_CYT_; grey square, exocyst complex. The arrow indicates NP dynamics. (B) Maximum-intensity projections of two time lapses (Δt is 3 min) of a deconvolved z series of fluorescence images. Left panels show the distribution of Nsp1-GFP (PCCPL393;
Video 5
) and right panels of Nup170-GFP (PCCPL392;
Video 8
) in cdc6-1 cells. Arrowheads point to an Nsp1-GFP_CYT_ focus that interacts with NP. Bar, 2 µm. (C) Nsp1-FRB-GFP/Hmg1-mCherry (PCCPL487)– or Nup192-FRB-GFP/Hmg1-mCherry (PCCPL552)–expressing cells were imaged in the presence of DMSO or rapamycin. Individual unbudded cells were followed by time-lapse microscopy until anaphase completion (∼2 h). The images shown are maximum-intensity projections of a z series of deconvolved images of cells at the time point just before and after anaphase. M and D, mother and daughter, respectively. The position of the bud neck is indicated by the arrows. Bars, 2 µm. (D) Quantification of C where the percentage of cells showing a mispositioned nucleus is plotted under DMSO and rapamycin conditions. 36 ≤ n ≤ 96. Error bars indicate the standard error of the mean.
Figure 9.
The distribution of Nsp1_CYT_ and the density of daughter NPCs require MYO2. (A) Maximum-intensity projections of a deconvolved z series of images showing the distribution of Nsp1-GFP in wild-type (WT; CPL1234), myo2-14 (PCCPL317), myo2-20 (PCCPL316), dyn1Δ (PCCPL559), dyn2Δ (PCCPL427), and myo4Δ (PCCPL365) cells after 3 h of arrest in hydroxyurea at RT. Arrowheads point to Nsp1-GFP_CYT_ foci. Bars, 2 µm. (B) The number and distribution of Nsp1-GFP_CYT_ foci were assessed in the indicated hydroxyurea-arrested cells. For each cell it was determined whether there was a bud-biased (BB), unbiased (UB), or mother-biased (MB) localization in the total number of Nsp1-GFP_CYT_ foci per cell. These numbers were plotted as a percentage of total cells. 40 ≤ n ≤ 60. Error bars are standard deviations from the mean. (C) Deconvolved fluorescence micrographs showing a middle z section of WT (BWCPL42), myo2-14 (PCCPL529), dyn1Δ (PCCPL561), dyn2Δ (PCCPL445), and myo4Δ (PCCPL530) cells expressing Nup85-GFP after anaphase. The bottom panel is a “heatmap” representation of fluorescence intensities normalized to a 1-256 arbitrary scale (legend on the left) of the same mother (M) and daughter (D) cells as in the top panel. Cell boundaries are denoted by outlines. Bars, 2 µm. (D) In a middle z plane of a deconvolved z series, the mfi of the NE of a mother and daughter cell were measured and plotted as a ratio (mfid/mfim) as an indirect readout of relative NPC density. 50 ≤ n ≤ 98. Box plot and statistics are as in Fig. 3. P < 0.0001.
Figure 10.
Model of the mechanism of NPC transmission to daughter cells. (A) In wild-type cells, a diffusion barrier at the bud neck is established (orange). (B) We envision that the delivery of Nsp1_CYT_ (green triangles) to the daughter through a mechanism that requires Myo2 and an association with ER (blue, which bind the daughter cortex through the exocyst complex [grey box]) licenses NPC passage by disrupting the diffusion barrier. (C) Forces applied to the mother NE through NP and/or spindle elongation result in the transmission of NPCs (red ovals). Under conditions in which Nsp1_CYT_ is inhibited or Myo2 function is impaired, the barrier remains intact and restricts the passage of NPCs, leading to the specific loss of viability of daughter cells. De novo NPC assembly continues as indicated by the white ovals.
Similar articles
- Toward a consensus on the mechanism of nuclear pore complex inheritance.
Lusk CP, Colombi P. Lusk CP, et al. Nucleus. 2014 Mar-Apr;5(2):97-102. doi: 10.4161/nucl.28314. Epub 2014 Feb 25. Nucleus. 2014. PMID: 24637838 Free PMC article. Review. - Inheritance of yeast nuclear pore complexes requires the Nsp1p subcomplex.
Makio T, Lapetina DL, Wozniak RW. Makio T, et al. J Cell Biol. 2013 Oct 28;203(2):187-96. doi: 10.1083/jcb.201304047. J Cell Biol. 2013. PMID: 24165935 Free PMC article. - The yeast integral membrane protein Apq12 potentially links membrane dynamics to assembly of nuclear pore complexes.
Scarcelli JJ, Hodge CA, Cole CN. Scarcelli JJ, et al. J Cell Biol. 2007 Aug 27;178(5):799-812. doi: 10.1083/jcb.200702120. J Cell Biol. 2007. PMID: 17724120 Free PMC article. - Pom33, a novel transmembrane nucleoporin required for proper nuclear pore complex distribution.
Chadrin A, Hess B, San Roman M, Gatti X, Lombard B, Loew D, Barral Y, Palancade B, Doye V. Chadrin A, et al. J Cell Biol. 2010 May 31;189(5):795-811. doi: 10.1083/jcb.200910043. Epub 2010 May 24. J Cell Biol. 2010. PMID: 20498018 Free PMC article. - Nuclear pore complex biogenesis.
Fernandez-Martinez J, Rout MP. Fernandez-Martinez J, et al. Curr Opin Cell Biol. 2009 Aug;21(4):603-12. doi: 10.1016/j.ceb.2009.05.001. Epub 2009 Jun 11. Curr Opin Cell Biol. 2009. PMID: 19524430 Free PMC article. Review.
Cited by
- Cytoplasmic nucleoporin assemblage: the cellular artwork in physiology and disease.
Lin J, Sumara I. Lin J, et al. Nucleus. 2024 Dec;15(1):2387534. doi: 10.1080/19491034.2024.2387534. Epub 2024 Aug 12. Nucleus. 2024. PMID: 39135336 Free PMC article. Review. - An ESCRT-LEM protein surveillance system is poised to directly monitor the nuclear envelope and nuclear transport system.
Thaller DJ, Allegretti M, Borah S, Ronchi P, Beck M, Lusk CP. Thaller DJ, et al. Elife. 2019 Apr 3;8:e45284. doi: 10.7554/eLife.45284. Elife. 2019. PMID: 30942170 Free PMC article. - Toward a consensus on the mechanism of nuclear pore complex inheritance.
Lusk CP, Colombi P. Lusk CP, et al. Nucleus. 2014 Mar-Apr;5(2):97-102. doi: 10.4161/nucl.28314. Epub 2014 Feb 25. Nucleus. 2014. PMID: 24637838 Free PMC article. Review. - The long and viscous road: uncovering nuclear diffusion barriers in closed mitosis.
Zavala E, Marquez-Lago TT. Zavala E, et al. PLoS Comput Biol. 2014 Jul 17;10(7):e1003725. doi: 10.1371/journal.pcbi.1003725. eCollection 2014 Jul. PLoS Comput Biol. 2014. PMID: 25032937 Free PMC article. - Altering nuclear pore complex function impacts longevity and mitochondrial function in S. cerevisiae.
Lord CL, Timney BL, Rout MP, Wente SR. Lord CL, et al. J Cell Biol. 2015 Mar 16;208(6):729-44. doi: 10.1083/jcb.201412024. J Cell Biol. 2015. PMID: 25778920 Free PMC article.
References
- Aguilar P.S., Fröhlich F., Rehman M., Shales M., Ulitsky I., Olivera-Couto A., Braberg H., Shamir R., Walter P., Mann M., et al. 2010. A plasma-membrane E-MAP reveals links of the eisosome with sphingolipid metabolism and endosomal trafficking. Nat. Struct. Mol. Biol. 17:901–908 10.1038/nsmb.1829 - DOI - PMC - PubMed
- Amberg D.C., Burke D., Strathern J.N. 2005. Methods in Yeast Genetics. Cold Spring Harbor Laboratory Press, Cold Spring Harbor, NY: 230 pp
Publication types
MeSH terms
Substances
LinkOut - more resources
Full Text Sources
Other Literature Sources
Molecular Biology Databases
