Characterization of CD56+ dendritic-like cells: a normal counterpart of blastic plasmacytoid dendritic cell neoplasm? - PubMed (original) (raw)
. 2013 Nov 29;8(11):e81722.
doi: 10.1371/journal.pone.0081722. eCollection 2013.
Akihiko Yokohama, Akio Saito, Kenichi Tahara, Kunio Yanagisawa, Yoshiyuki Ogawa, Takuma Ishizaki, Takeki Mitsui, Hiromi Koiso, Makiko Takizawa, Hideki Uchiumi, Takayuki Saitoh, Hiroshi Handa, Hirokazu Murakami, Norifumi Tsukamoto, Yoshihisa Nojima
Affiliations
- PMID: 24312342
- PMCID: PMC3843704
- DOI: 10.1371/journal.pone.0081722
Characterization of CD56+ dendritic-like cells: a normal counterpart of blastic plasmacytoid dendritic cell neoplasm?
Yohei Osaki et al. PLoS One. 2013.
Abstract
Blastic plasmacytoid dendritic cell neoplasm (BPDCN) is a rare hematological malignancy. Plasmacytoid DCs (pDCs), which are defined as lineage marker (Lin)(-)HLA-DR(+)CD56(-)CD123(+)CD11c(-) cells, are considered to be the normal counterpart of BPDCNs. However, BPDCN can be distinguished from pDCs by uniform expression of CD56. In this study, to identify a normal counterpart of BPDCN, we searched for a Lin(-)HLA-DR(+)CD56(+) population and focused on a minor subpopulation of Lin(-)DR(+)CD56(+)CD123(+)CD11c(-) cells that we designated as pDC-like cells (pDLCs). pDLC constituted 0.03% of peripheral blood mononuclear cells (PBMCs), and the pDLC/pDC ratio was higher in bone marrow cells than in PBMCs. pDLC clearly expressed BDCA2, BDCA4, and myeloid antigens, which are frequently expressed by BPDCN. pDLCs exhibited modest expression of Toll-like receptors and produced less interferon-α after CpG stimulation, but presented very low endocytic ability unlike mDCs. These functional differences were attributed to the expression profile of transcriptional factors. After in vitro culture with Flt3-ligand and GM-CSF, pDLCs expressed CD11c and BDCA1. These data suggested that pDLCs are a distinct subpopulation, with an immunophenotype similar to BPDCNs. Moreover, our results indicate that pDLCs might be immature DCs and might contribute to the immunophenotypical diversity of BPDCNs.
Conflict of interest statement
Competing Interests: The authors have declared that no competing interests exist.
Figures
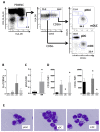
Figure 1. pDLCs are a rare DC population that are morphologically similar to pDCs.
(A) PBMNCs were analyzed using flow cytometry. The gated Lin-HLA−DR+ population (left) was divided according to CD56 expression (middle), and these two subpopulations were analyzed according to CD123 and CD11c expression to define pDLCs, mDLCs, pDCs, and mDCs (right). The results of one representative experiment are presented. (B) The frequency of pDLC, mDLCs, pDCs, and mDCs in PBMCs (n = 5). pDLCs comprised a very small (0.03%) proportion in PBMCs. (C) The pDLC to pDC ratio was compared between peripheral blood (PB) and bone marrow (BM) cells (n=5). *P < 0.05 compared to PB. (D) MFI of CD123 (left panel) and CD11c (right panel) expression was measured on pDLCs, pDCs, and mDCs in PBMCs (n = 5). *P < 0.05 compared to pDLC. (E) Sorted cells were stained with May–Giemsa solution and observed by light microscopy at 1000× magnification.
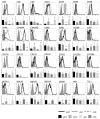
Figure 2. Immunophenotypic characteristics of pDLCs.
Expression of cell-surface and intracellular markers in pDLCs, mDLCs, pDCs, and mDCs were measured by flow cytometry. Upper graph showed the results of one representative experiment. pDLCs (solid line), pDCs (dotted line), mDCs (dashed line) and isotype control (filled histogram). Lower graph showed mean fluorescence intensity of pDLC, mDLC, pDC and mDC (n=5). * P < 0.05 compared to pDLC.
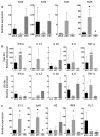
Figure 3. TLR, cytokine, and transcription factor expression levels in pDLCs are distinct from pDCs and mDCs.
qRT-PCR analyses were performed using cDNA from pDLCs, pDCs, and mDCs. Results were standardized using PBMC cDNA (n=5). * P < 0.05 compared to pDLC. (A) TLR expression analysis revealed that mDCs expressed TLR2 and TLR4, whereas pDCs expressed TLR7 and TLR9. (B) Cytokine production was analyzed after CpG or LPS stimulation. (C) Transcripts of E2-2, Id2, Irf8, PU.1, and SpiB were analyzed in pDLCs, pDCs, and mDCs.
Figure 4. pDLCs exhibit lower endocytic activity than that in mDCs, and also induce less proliferation of CD4+T cells than that in pDCs.
* P < 0.05 compared to pDLC. (A) PBMCs were incubated with FITC–dextran and analyzed by flow cytometry. The open histograms represent 37°C- and the filled histograms represent 4°C-cultured cells. Results of one representative experiment are presented (left). The average frequencies of FITC–dextran positive cells are indicated (n = 5, right). (B) Sorted DCs were co-cultured for 72 h with CFSE-labeled CD4+ T cells under CpG stimulation (1µM). The average frequencies of divided CD4 positive cells are indicated (n = 5).
Figure 5. pDLCs expressed mDC specific antigens.
pDLCs were cultured with Flt3-Ligand GM-CSF for six days. (A) CD123, CD11c and CD56 expressions were analyzed at day 0 and 6. CD123highCD11cdim and CD123dimCD11chigh populations were observed at day 6. Results of one representative experiment are presented (left). The average frequencies of CD123highCD11cdim and CD123dimCD11chigh populations are indicated (n = 5, middle). The average MFI of CD56 at day 0 and 6 are indicated (n = 5, right). * P < 0.05 compared to day0. (B) BDCA1 expression was compared by flow cytometry. pDLCs did not express BDCA1 at day 0, but they did express BDCA1 at day 6 especially CD123dimCD11chigh population. * P < 0.05 compared to day0 (n = 5). (C) Sorted cells were CFSE-labeled and incubated for six days with Flt3-L and GM-CSF. The filled histograms represent PHA-stimulated CFSE-labeled CD4+ T cells that were included as a control for cell division (left). The average frequencies of divided cells are indicated (n = 5, right).
Similar articles
- Human BDCA2+CD123+CD56+ dendritic cells (DCs) related to blastic plasmacytoid dendritic cell neoplasm represent a unique myeloid DC subset.
Yu H, Zhang P, Yin X, Yin Z, Shi Q, Cui Y, Liu G, Wang S, Piccaluga PP, Jiang T, Zhang L. Yu H, et al. Protein Cell. 2015 Apr;6(4):297-306. doi: 10.1007/s13238-015-0140-x. Epub 2015 Mar 18. Protein Cell. 2015. PMID: 25779340 Free PMC article. - Myeloid Neoplasms with Elevated Plasmacytoid Dendritic Cell Differentiation Reflect the Maturation Process of Dendritic Cells.
Huang Y, Wang Y, Chang Y, Yuan X, Hao L, Shi H, Lai Y, Huang X, Liu Y. Huang Y, et al. Cytometry A. 2020 Jan;97(1):61-69. doi: 10.1002/cyto.a.23953. Epub 2019 Dec 26. Cytometry A. 2020. PMID: 31876105 - Clinicopathological analysis of 46 cases with CD4+ and/or CD56+ immature haematolymphoid malignancy: reappraisal of blastic plasmacytoid dendritic cell and related neoplasms.
Suzuki Y, Kato S, Kohno K, Satou A, Eladl AE, Asano N, Kono M, Kato Y, Taniwaki M, Akiyama M, Nakamura S. Suzuki Y, et al. Histopathology. 2017 Dec;71(6):972-984. doi: 10.1111/his.13340. Epub 2017 Oct 10. Histopathology. 2017. PMID: 28795410 - Blastic Plasmacytoid Dendritic Cell Neoplasm: Progress in Cell Origin, Molecular Biology, Diagnostic Criteria and Therapeutic Approaches.
Cheng W, Yu TT, Tang AP, He Young K, Yu L. Cheng W, et al. Curr Med Sci. 2021 Jun;41(3):405-419. doi: 10.1007/s11596-021-2393-3. Epub 2021 Jul 3. Curr Med Sci. 2021. PMID: 34218354 Review. - Molecular characterization of human plasmacytoid dendritic cells.
Cao W. Cao W. J Clin Immunol. 2009 May;29(3):257-64. doi: 10.1007/s10875-009-9284-x. Epub 2009 Mar 6. J Clin Immunol. 2009. PMID: 19266271 Review.
Cited by
- Single-cell RNA-seq reveals new types of human blood dendritic cells, monocytes, and progenitors.
Villani AC, Satija R, Reynolds G, Sarkizova S, Shekhar K, Fletcher J, Griesbeck M, Butler A, Zheng S, Lazo S, Jardine L, Dixon D, Stephenson E, Nilsson E, Grundberg I, McDonald D, Filby A, Li W, De Jager PL, Rozenblatt-Rosen O, Lane AA, Haniffa M, Regev A, Hacohen N. Villani AC, et al. Science. 2017 Apr 21;356(6335):eaah4573. doi: 10.1126/science.aah4573. Science. 2017. PMID: 28428369 Free PMC article. - Activity of SL-401, a targeted therapy directed to interleukin-3 receptor, in blastic plasmacytoid dendritic cell neoplasm patients.
Frankel AE, Woo JH, Ahn C, Pemmaraju N, Medeiros BC, Carraway HE, Frankfurt O, Forman SJ, Yang XA, Konopleva M, Garnache-Ottou F, Angelot-Delettre F, Brooks C, Szarek M, Rowinsky E. Frankel AE, et al. Blood. 2014 Jul 17;124(3):385-92. doi: 10.1182/blood-2014-04-566737. Epub 2014 May 23. Blood. 2014. PMID: 24859366 Free PMC article. Clinical Trial. - Haploinsufficiency for NR3C1, the gene encoding the glucocorticoid receptor, in blastic plasmacytoid dendritic cell neoplasms.
Emadali A, Hoghoughi N, Duley S, Hajmirza A, Verhoeyen E, Cosset FL, Bertrand P, Roumier C, Roggy A, Suchaud-Martin C, Chauvet M, Bertrand S, Hamaidia S, Rousseaux S, Josserand V, Charles J, Templier I, Maeda T, Bruder-Costa J, Chaperot L, Plumas J, Jacob MC, Bonnefoix T, Park S, Gressin R, Tensen CP, Mecucci C, Macintyre E, Leroux D, Brambilla E, Nguyen-Khac F, Luquet I, Penther D, Bastard C, Jardin F, Lefebvre C, Garnache F, Callanan MB. Emadali A, et al. Blood. 2016 Jun 16;127(24):3040-53. doi: 10.1182/blood-2015-09-671040. Epub 2016 Apr 8. Blood. 2016. PMID: 27060168 Free PMC article. - Human dendritic cell subsets: an update.
Collin M, Bigley V. Collin M, et al. Immunology. 2018 May;154(1):3-20. doi: 10.1111/imm.12888. Epub 2018 Feb 27. Immunology. 2018. PMID: 29313948 Free PMC article. Review. - Blastic Plasmacytoid Dendritic Cell Neoplasia: A Single Center Experience.
Demiröz AS, Demirkesen C, Salihoğlu A, Tüzüner N. Demiröz AS, et al. Turk J Haematol. 2020 Feb 20;37(1):48-52. doi: 10.4274/tjh.galenos.2019.2019.0195. Epub 2019 Nov 22. Turk J Haematol. 2020. PMID: 31752482 Free PMC article.
References
- Dargent JL, Delannoy A, Pieron P, Husson B, Debecker C et al. (2011) Cutaneous accumulation of plasmacytoid dendritic cells associated with acute myeloid leukemia: a rare condition distinct from blastic plasmacytoid dendritic cell neoplasm. J Cutan Pathol 38: 893-898. doi:10.1111/j.1600-0560.2011.01777.x. PubMed: 21883371. - DOI - PubMed
Publication types
MeSH terms
Substances
Grants and funding
This work was supported in part by the National Cancer Center Research and Development Fund (23-A-17). No additional external funding received for this study. The funders had no role in study design, data collection and analysis, decision to publish, or preparation of the manuscript.
LinkOut - more resources
Full Text Sources
Other Literature Sources
Research Materials
Miscellaneous


