Different calcium sources control somatic versus dendritic SK channel activation during action potentials - PubMed (original) (raw)
Different calcium sources control somatic versus dendritic SK channel activation during action potentials
Scott L Jones et al. J Neurosci. 2013.
Abstract
Small-conductance calcium-activated potassium (SK) channels play an important role in regulating neuronal excitability. While SK channels at the soma have long been known to contribute to the medium afterhyperpolarization (mAHP), recent evidence indicates they also regulate NMDA receptor activation in dendritic spines. Here we investigate the activation of SK channels in spines and dendrites of rat cortical pyramidal neurons during action potentials (APs), and compare this to SK channel activation at the soma. Using confocal calcium imaging, we demonstrate that the inhibition of SK channels with apamin results in a location-dependent increase in calcium influx into dendrites and spines during backpropagating APs (average increase, ~40%). This effect was occluded by block of R-type voltage-dependent calcium channels (VDCCs), but not by inhibition of N- or P/Q-type VDCCs, or block of calcium release from intracellular stores. During these experiments, we noticed that the calcium indicator (Oregon Green BAPTA-1) blocked the mAHP. Subsequent experiments using low concentrations of EGTA (1 mm) produced the same result, suggesting that somatic SK channels are not tightly colocalized with their calcium source. Consistent with this idea, all known subtypes of VDCCs except R-type were calcium sources for the apamin-sensitive mAHP at the soma. We conclude that SK channels in spines and dendrites of cortical pyramidal neurons regulate calcium influx during backpropagating APs in a distance-dependent manner, and are tightly coupled to R-type VDCCs. In contrast, SK channels activated by APs at the soma of these neurons are weakly coupled to a variety of VDCCs.
Figures
Figure 1.
SK channels constrain calcium influx into spines and dendrites during bAPs. A1, Confocal image of a layer 5 pyramidal neuron filled with 200 μ
m
OGB-1. Scale bar, 25 μm. Yellow box indicates a region of interest in a distal basal dendrite. A2, Region of interest at high magnification. Dashed line shows location of line scan. Scale bar, 1 μm. A3, Repeated line scans through the spine and dendrite shown in A2. A single AP evoked after 30 ms (red arrowhead) caused a large increase in fluorescence in both compartments. B, AP-evoked change in fluorescence in a spine (top) and dendrite (bottom) before and after local application of apamin (1 μ
m
). Same spine as in A2. In this and all subsequent figures, the solid line and shaded regions represent the mean ± SEM for an example spine and dendrite. C, Average AP-evoked peak Δ_F_/F (±SEM) in spines in the absence and presence of apamin (n = 32). D, Average change in AP-evoked fluorescence (±SEM) in spines and dendrites after application of apamin (n = 32). E, F, Change in AP-evoked fluorescence in spines (E) and dendrites (F) after apamin application versus distance from the soma. Lines represent linear fits to OGB-1 data. Pearson's coefficient 0.868 (E) and 0.860 (F). G, H, Average change in AP-evoked fluorescence (±SEM) in spines and dendrites after application of UCL 1684 (G; 1 μ
m
; n = 15) and normal ACSF (H; n = 12). *p < 0.05, **p < 0.01. ns, Not significant.
Figure 2.
R-type VDCCs control SK channel activation during bAPs. A, AP-evoked change in fluorescence in a spine (top) and dendrite (bottom) in control (black) and after local application of SNX 482 (1 μ
m
; blue). B, Average AP-evoked peak Δ_F_/F for spines before and after the local application of SNX 482 (±SEM; n = 15). C, Average percentage change in AP-evoked fluorescence in SNX 482 compared with control in spines and dendrites (±SEM; n = 15). D, AP-evoked change in fluorescence in a spine (top) and dendrite (bottom) in the presence of apamin (1 μ
m
; red) and after local application of SNX 482 in apamin (blue). E, Average AP-evoked peak Δ_F_/F for spines before and after the application of SNX 482 in the continued presence of apamin (±SEM; n = 19). F, Average percentage change in AP-evoked fluorescence in SNX 482 plus apamin compared with apamin alone in spines and dendrites (±SEM; n = 19). G, AP-evoked change in fluorescence in a spine (top) and dendrite (bottom) in the presence of SNX 482 (blue) and after local application of apamin in SNX 482 (red). H, Average AP-evoked peak Δ_F_/F for spines before and after the application of apamin in the continued presence of SNX 482 (±SEM; n = 21). I, Average percentage change in AP-evoked fluorescence in apamin plus SNX 482 compared with SNX 482 alone in spines and dendrites (±SEM; n = 21). *p < 0.05, **p < 0.01. ns, Not significant.
Figure 3.
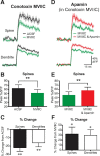
Block of N- and P/Q-type VDCCs does not affect SK channel activation. A, AP-evoked change in fluorescence in a spine (top) and dendrite (bottom) before (black) and after application of conotoxin MVIIC (10 μ
m
; green) to block N- and P/Q-type VDCCs. B, Average AP-evoked peak Δ_F_/F in spines before and after the application of contoxin MVIIC. C, Average percentage change in AP-evoked fluorescence for spines and dendrites after application of conotoxin MVIIC (±SEM; n = 10). D, AP-evoked change in fluorescence in a spine (top) and dendrite (bottom) in conotoxin MVIIC (green) and after application of apamin (1 μ
m
) in the presence of conotoxin MVIIC (red). E, Average AP-evoked peak Δ_F_/F in spines before and after the application of apamin in the continued presence of conotoxin MVIIC (±SEM; n = 10). F, Average percentage change in AP-evoked fluorescence after application of apamin in the presence of conotoxin MVIIC (±SEM; n = 10). *p < 0.05, **p < 0.01.
Figure 4.
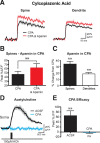
Inhibition of intracellular calcium stores does not affect SK channel activation. A, AP-evoked change in fluorescence in a spine (left) and dendrite (right) in the presence of cyclopiazonic acid (CPA) to deplete intracellular calcium stores (30 μ
m
; black) and after application of apamin (1 μ
m
) in the presence of CPA (red). B, Average AP-evoked peak Δ_F_/F in spines before and after the application of apamin in the continued presence of CPA (±SEM; n = 10). C, Average percentage change in AP-evoked fluorescence after the application of apamin in the presence of CPA (±SEM; n = 10). D, Change in fluorescence at the soma in response to a 10 ms local application of 100 μ
m
acetylcholine to the soma in normal ACSF (black) and in the presence of CPA (blue). E, Average change in fluorescence during somatic acetylcholine applications in ACSF and CPA (n = 4). **p < 0.01. ns, Not significant.
Figure 5.
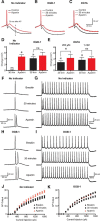
Impact of calcium chelators on the mAHP and action potential firing. A–C, Truncated somatic action potentials evoked by 200 ms somatic current pulses showing the mAHP in control just after initiation of recording (black, solid line), 30 min after recording (black, dashed line) and in the presence of apamin (red, solid line). Recordings were made with no internal calcium indicator in the pipette solution (A), and with OGB-1 (B; 200 μ
m
) or EGTA (C; 1 m
m
) in the pipette solution. mAHP amplitude was measured 30 ms after AP onset (dashed vertical line in A). D, E, Average change in mAHP amplitude in the absence (black) and presence (red) of apamin in cells with and without OGB-1 in the pipette solution (D) and in cells dialyzed with 200 μ
m
or 1 m
m
EGTA (E). F, G, Action potential firing in response to a 200 ms current step just above rheobase (F) or in response to a 500 ms current step (G, 1600 pA amplitude) just after break-in (top), after 30 min (middle), and in apamin (bottom) in control. H, I, Action potential firing in response to a 200 ms current step just above rheobase (H) or in response to a 500 ms current step (I, 1600 pA amplitude) just after break-in (top), after 30 min (middle), and in apamin (bottom) in cells dialyzed with 200 μ
m
OGB-1. J, K, Input–output properties during 500 ms somatic current injections in control (J) and in cells dialyzed with 200 μ
m
OGB-1 (K) immediately after break-in (black circles), after 30 min (black squares), and after the addition of apamin (red triangles). *p < 0.05. ns, Not significant.
Figure 6.
The calcium source for the mAHP in cortical pyramidal neurons. A–F, Truncated somatic action potentials evoked by 200 ms somatic current pulses showing the mAHP in control (black, solid line), after bath application of VDCC blockers (colored dashed line) and in the presence of apamin (red, solid line). A, Impact of the R-type VDCC blocker SNX 482 (300 n
m
; n = 5). B, Impact of the N-type VDCC blocker conotoxin GVIA (1 μ
m
; n = 6). C, Impact of the L-type VDCC blocker nifedipine (15 μ
m
; n = 6). D, Impact of the T-type VDCC blocker NNC 55–0396 (20 μ
m
, n = 5). E, Impact of the P/Q-type VDCC blocker agatoxin IVA (300 n
m
; n = 6). F, Impact of a cocktail of N-, L-, T-, and P/Q-type VDCC blockers (n = 4). G, Average change in mAHP amplitude (±SEM) relative to control under the different recording conditions (mAHP measured 30 ms after AP onset). *p < 0.05, **p < 0.01. ns, Not significant.
Figure 7.
R-type VDCCs are not expressed at the soma of L5 pyramidal neurons. A, Layer 5 pyramidal neuron filled with OGB-1. The black and yellow boxes indicate somatic and dendritic regions of interest for point scans, the results of which are shown in B. Scale bar, 35 μm. B, Point scans of regions shown in A during a single AP before and after wash-in of SNX 482. Solid line and shaded regions represent the mean ± SEM. C, Average peak Δ_F_/F for the soma and dendrite before and after wash-in of SNX 482 (±SEM; n = 5). D, Average percentage change in fluorescence transients after wash-in of SNX 482 for the soma and dendrite (±SEM; n = 5). **p < 0.01, ns, Not significant.
Comment in
- Location matters: somatic and dendritic SK channels answer to distinct calcium signals.
Rudolph S, Thanawala MS. Rudolph S, et al. J Neurophysiol. 2015 Jul;114(1):1-5. doi: 10.1152/jn.00181.2014. Epub 2014 Sep 3. J Neurophysiol. 2015. PMID: 25185803 Free PMC article.
Similar articles
- Paradoxical Excitatory Impact of SK Channels on Dendritic Excitability.
Bock T, Honnuraiah S, Stuart GJ. Bock T, et al. J Neurosci. 2019 Oct 2;39(40):7826-7839. doi: 10.1523/JNEUROSCI.0105-19.2019. Epub 2019 Aug 16. J Neurosci. 2019. PMID: 31420457 Free PMC article. - SK (KCa2) channels do not control somatic excitability in CA1 pyramidal neurons but can be activated by dendritic excitatory synapses and regulate their impact.
Gu N, Hu H, Vervaeke K, Storm JF. Gu N, et al. J Neurophysiol. 2008 Nov;100(5):2589-604. doi: 10.1152/jn.90433.2008. Epub 2008 Aug 6. J Neurophysiol. 2008. PMID: 18684909 - Location matters: somatic and dendritic SK channels answer to distinct calcium signals.
Rudolph S, Thanawala MS. Rudolph S, et al. J Neurophysiol. 2015 Jul;114(1):1-5. doi: 10.1152/jn.00181.2014. Epub 2014 Sep 3. J Neurophysiol. 2015. PMID: 25185803 Free PMC article. - Molecular and cellular basis of small--and intermediate-conductance, calcium-activated potassium channel function in the brain.
Pedarzani P, Stocker M. Pedarzani P, et al. Cell Mol Life Sci. 2008 Oct;65(20):3196-217. doi: 10.1007/s00018-008-8216-x. Cell Mol Life Sci. 2008. PMID: 18597044 Free PMC article. Review. - Local and Global Dynamics of Dendritic Activity in the Pyramidal Neuron.
Stuyt G, Godenzini L, Palmer LM. Stuyt G, et al. Neuroscience. 2022 May 1;489:176-184. doi: 10.1016/j.neuroscience.2021.07.008. Epub 2021 Jul 17. Neuroscience. 2022. PMID: 34280492 Review.
Cited by
- ICAN (TRPM4) Contributes to the Intrinsic Excitability of Prefrontal Cortex Layer 2/3 Pyramidal Neurons.
Riquelme D, Peralta FA, Navarro FD, Moreno C, Leiva-Salcedo E. Riquelme D, et al. Int J Mol Sci. 2021 May 17;22(10):5268. doi: 10.3390/ijms22105268. Int J Mol Sci. 2021. PMID: 34067824 Free PMC article. - Pleiotropic effects of schizophrenia-associated genetic variants in neuron firing and cardiac pacemaking revealed by computational modeling.
Mäki-Marttunen T, Lines GT, Edwards AG, Tveito A, Dale AM, Einevoll GT, Andreassen OA. Mäki-Marttunen T, et al. Transl Psychiatry. 2017 Nov 17;7(11):5. doi: 10.1038/s41398-017-0007-4. Transl Psychiatry. 2017. PMID: 30446648 Free PMC article. - VTA dopamine neurons are hyperexcitable in 3xTg-AD mice due to casein kinase 2-dependent SK channel dysfunction.
Blankenship HE, Carter KA, Pham KD, Cassidy NT, Markiewicz AN, Thellmann MI, Sharpe AL, Freeman WM, Beckstead MJ. Blankenship HE, et al. Nat Commun. 2024 Nov 8;15(1):9673. doi: 10.1038/s41467-024-53891-1. Nat Commun. 2024. PMID: 39516200 Free PMC article. - Ca2+-activated KCa3.1 potassium channels contribute to the slow afterhyperpolarization in L5 neocortical pyramidal neurons.
Roshchin MV, Ierusalimsky VN, Balaban PM, Nikitin ES. Roshchin MV, et al. Sci Rep. 2020 Sep 2;10(1):14484. doi: 10.1038/s41598-020-71415-x. Sci Rep. 2020. PMID: 32879404 Free PMC article.
References
Publication types
MeSH terms
Substances
LinkOut - more resources
Full Text Sources
Other Literature Sources
Miscellaneous


