Increased dosage of DYRK1A and DSCR1 delays neuronal differentiation in neocortical progenitor cells - PubMed (original) (raw)
Increased dosage of DYRK1A and DSCR1 delays neuronal differentiation in neocortical progenitor cells
Nobuhiro Kurabayashi et al. Genes Dev. 2013.
Abstract
Down's syndrome (DS), a major genetic cause of mental retardation, arises from triplication of genes on human chromosome 21. Here we show that DYRK1A (dual-specificity tyrosine-phosphorylated and -regulated kinase 1A) and DSCR1 (DS critical region 1), two genes lying within human chromosome 21 and encoding for a serine/threonine kinase and calcineurin regulator, respectively, are expressed in neural progenitors in the mouse developing neocortex. Increasing the dosage of both proteins in neural progenitors leads to a delay in neuronal differentiation, resulting ultimately in alteration of their laminar fate. This defect is mediated by the cooperative actions of DYRK1A and DSCR1 in suppressing the activity of the transcription factor NFATc. In Ts1Cje mice, a DS mouse model, dysregulation of NFATc in conjunction with increased levels of DYRK1A and DSCR1 was observed. Furthermore, counteracting the dysregulated pathway ameliorates the delayed neuronal differentiation observed in Ts1Cje mice. In sum, our findings suggest that dosage of DYRK1A and DSCR1 is critical for proper neurogenesis through NFATc and provide a potential mechanism to explain the neurodevelopmental defects in DS.
Keywords: Down's syndrome; developing neocortex; neural progenitor; neurogenesis.
Figures
Figure 1.
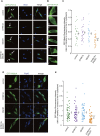
Overexpression of DYRK1A and DSCR1 results in decreased cortical progenitor differentiation. (A) Expression of Dyrk1a and Dscr1 in the developing brain. In situ hybridization analyses with Dyrk1a and Dscr1 probes were carried out on sections of E10 embryos and E14 brains. Images of the horizontal sections of E10 embryos (left panels) and coronal sections of E14 neocortices (right panels) are shown. Bars: in E10 sections, 500 μm; in E14 sections, 200 μm. (B–E) Plasmids encoding DYRK1A and/or DSCR1 were electroporated, together with the GFP-expressing plasmid, in E11 embryos. Thereafter, the E13 brain sections were immunostained with antibodies against Pax6 (B,D) and Tbr1 (C,E). Images of the entire cerebral wall are shown. Plasmids were electroporated, and their concentrations are indicated above the images. Bar, 50 μm. (F,G) Plasmids encoding DYRK1A and DSCR1 were electroporated, together with the GFP-expressing plasmid, in E11 embryos. BrdU was administrated at E12, and brains were fixed 30 min after the BrdU pulse labeling. The brain sections were then immunostained with antibodies against GFP, BrdU, and Sox2 (F) and phospho-Histone H3 (PH3) (G). Images of the entire cerebral wall are shown. Plasmids were electroporated, and their concentration are indicated. Bars, 50 μm. (H) Quantification of a fraction of GFP-positive cells that was also positive for Pax6, Tbr1, BrdU, and PH3. Data are presented as mean ± SEM (n = 3–4 embryos for each group). (*) P < 0.05; (**) P < 0.01; (***) P < 0.001 versus control by a two-tailed Student's _t_-test. The concentration of electroporated plasmids for DYRK1A and DSCR1 (in micrograms per microliter) is presented in brackets.
Figure 2.
Overexpression of DYRK1A and DSCR1 in progenitors causes alteration of their laminar fate. (A–C) Plasmids encoding DYRK1A and DSCR1 were electroporated in E11 embryos, together with the GFP-expressing plasmid. The E16 brain sections were then immunostained with antibodies against Cux1 (A) and Tbr1 (B). Images of the entire cerebral wall are shown. The plasmids were electroporated, and their concentrations are indicated above the images. Bar, 50 μm. (C) Quantification of a fraction of GFP-positive cells that was also positive to Cux1 and Tbr1. Data are presented as mean ± SEM (n = 3 embryos for each group). (*) P < 0.05; (**) P < 0.01; (***) P < 0.001 versus control by a two-tailed Student's _t_-test. The concentration of electroporated plasmid for DYRK1A and DSCR1 (in micrograms per microliter) is presented in brackets.
Figure 3.
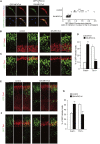
Overexpression of DYRK1A and DSCR1 affects nuclear occupancy of NFATc4 in cortical progenitor cells. (A) Plasmids expressing the indicated proteins were electroporated, together with the GFP-NFATc4-expressing plasmid, in E14 embryos. Neocortical cell cultures were then prepared from the E15 brains. Neocortical cells were fixed at DIV2 and immunostained with antibodies against GFP (green) and Sox2 (blue). Representative images are shown. Bar, 20 μm. (B) Magnified views of the cells indicated by arrowheads a′–f′ in A are shown. Bar, 10 μm. (C) GFP fluorescence intensity of the nucleus and cytoplasm in individual GFP-labeled cells was measured, and the ratio of the intensity values is plotted. (***) P < 0.001 versus control by a two-tailed Welch's _t_-test. (D,E) An experiment similar to the one in A was performed in the presence of ionomycin. At DIV2, neocortical cells were treated with ionomycin (final concentration, 2 μM) for 1 h. Representative images are shown in D. Bar, 20 μm. (E) GFP fluorescence intensity of the nucleus and cytoplasm in individual GFP-labeled cells was measured, and the ratio of the intensity values is plotted. (***) P < 0.001 versus control by a two-tailed Welch's _t_-test.
Figure 4.
Interfering with NFATc activity impairs normal neuronal differentiation. (A) Plasmids expressing DN-NFATc4, together with plasmids encoding GFP-NFATc4 and mCherry, were electroporated in E14 embryos. Neocortical cell cultures were then prepared from the E15 brains. At DIV2, neocortical cells were treated with ionomycin (final concentration, 2 μM) for 1 h, fixed, and immunostained with antibodies against GFP (green) and Sox2 (blue). Representative images are shown. Bar, 20 μm. GFP fluorescence intensity of the nucleus and cytoplasm in individual GFP-labeled cells was measured, and the ratio of the intensity values is plotted on the right. (***) P < 0.001 versus control by a two-tailed Welch's _t_-test. (B–G) A plasmid expressing either control or DN-NFATc4 was electroporated, together with the GFP-expression plasmid, in E11 embryos, and the E13 (B–D) and E16 (E–G) brain sections were immunostained with the various antibodies indicated. (B,C) E13 brain sections immunostained with antibodies against Pax6 (B) and Tbr1 (C). Images of the entire cerebral wall electroporated with control (left panels) or DN-NFATc4 (right panels) are shown. Bar, 50 μm. (D) Quantification of a fraction of GFP-positive cells that was also positive for Pax6 and Tbr1. (***) P < 0.001 versus control by a two-tailed Student's _t_-test. (E,F) E16 brain sections immunostained with antibodies against Cux1 (E) and Tbr1 (F). Images of the entire cerebral wall electroporated with control (left panels) or DN-NFATc4 (right panels) are shown. Bar, 50 μm. (G) Quantification of a fraction of GFP-positive cells that was also positive for Cux1 and Tbr1. (**) P < 0.01 versus control by a two-tailed Student's _t_-test. In the graphs, data are presented as mean ± SEM (n = 3–5 embryos for each group).
Figure 5.
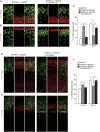
Delay in neuronal differentiation following DYRK1A and DSCR1 overexpression is rescued by coexpression of CA-NFATc4. (A–C) Plasmids expressing DYRK1A, DSCR1, and CA-NFATc4 were electroporated, together with the GFP-expression plasmid, in E11 embryos, and the E13 brain sections were immunostained with antibodies against Pax6 (A) and Tbr1 (B). Images of the entire cerebral wall are shown. Bar, 50 μm. Quantification of a fraction of GFP-positive cells that was also positive for Pax6 and Tbr1 is plotted in C. Similar quantification was performed in control plasmid-introduced brains (see Fig. 1), and the data are also presented in the graph. Data are presented as mean ± SEM (n = 3–5 embryos for each group). (D–F) Plasmids expressing DYRK1A, DSCR1, and CA-NFATc4 were electroporated, together with the GFP-expression plasmid, in E11 embryos, and the E16 brain sections were immunostained with antibodies against Cux1 (D) and Tbr1 (E). Images of the entire cerebral wall are shown. Bar, 50 μm. Quantification of a fraction of GFP-positive cells that was also positive for Cux1 and Tbr1 is plotted in F. Similar quantification was performed in control plasmid-introduced brains (see Fig. 2), and the data are also presented in the graph. Data are presented as mean ± SEM (n = 3–5 embryos for each group). (*) P < 0.05; (**) P < 0.01; (***) P < 0.001, by a two-tailed Student's _t_-test.
Figure 6.
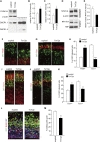
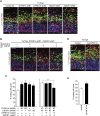
Alteration of DYRK1A/DSCR1 levels, NFATc activity, and neuronal differentiation in neocortical progenitors in Ts1Cje mice. (A–E) Whole-cell lysates (A), cytoplasmic fractions, and nuclear fractions (D) of the E13 neocortex of Ts1Cje mice and euploid littermates were subjected to immunoblotting with the antibodies indicated. (TBP) TATA-binding protein. The quantified band intensity was plotted in B, C, and E (mean ± SEM; n = 4 for euploid; n = 3 for Ts1Cje). The mean values of the band intensities of euploid mice were set to 1. (F–K) The plasmids expressing GFP were introduced into E11 embryos of Ts1Cje and euploid littermates, and the E13 (F–H) and E16 (I–K) brain sections were immunostained with the various antibodies indicated. (F,G) E13 brain sections immunostained with antibodies against Pax6 (F) and Tbr1 (G). Images of the entire cerebral wall are shown. Bars, 50 μm. (H) Quantification of a fraction of GFP-positive cells that was also positive for Pax6 and Tbr1. Data are presented as mean ± SEM (n = 3 embryos for each group). (**) P < 0.01; (***) P < 0.001 versus control by a two-tailed Student's _t_-test. (I,J) E16 brain sections immunostained with antibodies against Cux1 (I) and Tbr1 (J). Images of the entire cerebral wall are shown. Bars, 50 μm. (K) Quantification of a fraction of GFP-positive cells that was also positive for Cux1 and Tbr1. Data are presented as mean ± SEM (n = 3 embryos for each group). (*) P < 0.05; (**) P < 0.01 versus control by a two-tailed Student's _t_-test. (L) The plasmids expressing GFP were introduced into E13 embryos of Ts1Cje and euploid littermates. BrdU was administrated at E14, and the brains were fixed 24 h after the BrdU administration. Brain sections were then stained with antibodies against BrdU, Ki67, and GFP. GFP-positive cells labeled with both BrdU and Ki67 (arrowheads) are progenitor cells remaining in the cell cycle. GFP-positive cells labeled with BrdU but not Ki67 (arrows) are cells that exited the cell cycle. Bar, 50 μm. (M) Cell cycle exit index. Data are presented as mean ± SEM (n = 3 embryos for each group). (**) P < 0.01 versus euploid by a two-tailed Student's _t_-test.
Figure 7.
Modulation of DYRK1A/DSCR1 and NFATc ameliorates reduced cell cycle exit in progenitors in the Ts1Cje neocortex. (A,B) E13 Ts1Cje embryos were electroporated with plasmids encoding GFP, DYRK1A shRNA, and DSCR1 shRNA with or without plasmids expressing shRNA-resistant DYRK1A and DSCR1 mutants, as indicated. BrdU was administrated at E14, and brains were fixed 24 h after the BrdU administration. Brain sections were then stained with antibodies against BrdU, Ki67, and GFP. Bar, 50 μm. (C) Cell cycle exit index. Data are presented as mean ± SEM (n = 3–5 embryos for each group). (D) E13 Ts1Cje embryos were electroporated with plasmids encoding GFP and CA-NFATc4. BrdU was administrated at E14, and the brains were fixed 24 h after the BrdU administration. Brain sections were then stained with antibodies against BrdU, Ki67, and GFP. Bar, 50 μm. (E) Cell cycle exit index. Data are presented as mean ± SEM (n = 3–4 embryos for each group). (*) P < 0.05; (**) P < 0.01, by a two-tailed Student's _t_-test.
Similar articles
- [Molecular Mechanism Underlying Abnormal Differentiation of Neural Progenitor Cells in the Developing Down Syndrome Brain].
Kurabayashi N, Sanada K. Kurabayashi N, et al. Yakugaku Zasshi. 2017;137(7):795-800. doi: 10.1248/yakushi.16-00236-1. Yakugaku Zasshi. 2017. PMID: 28674289 Review. Japanese. - NFAT dysregulation by increased dosage of DSCR1 and DYRK1A on chromosome 21.
Arron JR, Winslow MM, Polleri A, Chang CP, Wu H, Gao X, Neilson JR, Chen L, Heit JJ, Kim SK, Yamasaki N, Miyakawa T, Francke U, Graef IA, Crabtree GR. Arron JR, et al. Nature. 2006 Jun 1;441(7093):595-600. doi: 10.1038/nature04678. Epub 2006 Mar 22. Nature. 2006. PMID: 16554754 - Down's syndrome suppression of tumour growth and the role of the calcineurin inhibitor DSCR1.
Baek KH, Zaslavsky A, Lynch RC, Britt C, Okada Y, Siarey RJ, Lensch MW, Park IH, Yoon SS, Minami T, Korenberg JR, Folkman J, Daley GQ, Aird WC, Galdzicki Z, Ryeom S. Baek KH, et al. Nature. 2009 Jun 25;459(7250):1126-30. doi: 10.1038/nature08062. Epub 2009 May 20. Nature. 2009. PMID: 19458618 Free PMC article. - DYRK1A overexpression enhances STAT activity and astrogliogenesis in a Down syndrome mouse model.
Kurabayashi N, Nguyen MD, Sanada K. Kurabayashi N, et al. EMBO Rep. 2015 Nov;16(11):1548-62. doi: 10.15252/embr.201540374. Epub 2015 Sep 15. EMBO Rep. 2015. PMID: 26373433 Free PMC article. - Triple play of DYRK1A kinase in cortical progenitor cells of Trisomy 21.
Kurabayashi N, Nguyen MD, Sanada K. Kurabayashi N, et al. Neurosci Res. 2019 Jan;138:19-25. doi: 10.1016/j.neures.2018.09.007. Epub 2018 Sep 15. Neurosci Res. 2019. PMID: 30227164 Review.
Cited by
- Neocortical neuronal production and maturation defects in the TcMAC21 mouse model of Down syndrome.
Kurabayashi N, Fujii K, Otobe Y, Hiroki S, Hiratsuka M, Yoshitane H, Kazuki Y, Takao K. Kurabayashi N, et al. iScience. 2023 Nov 2;26(12):108379. doi: 10.1016/j.isci.2023.108379. eCollection 2023 Dec 15. iScience. 2023. PMID: 38025769 Free PMC article. - Biphasic cell cycle defect causes impaired neurogenesis in down syndrome.
Sharma V, Nehra S, Do LH, Ghosh A, Deshpande AJ, Singhal N. Sharma V, et al. Front Genet. 2022 Oct 12;13:1007519. doi: 10.3389/fgene.2022.1007519. eCollection 2022. Front Genet. 2022. PMID: 36313423 Free PMC article. - The Challenging Pathway of Treatment for Neurogenesis Impairment in Down Syndrome: Achievements and Perspectives.
Stagni F, Bartesaghi R. Stagni F, et al. Front Cell Neurosci. 2022 May 11;16:903729. doi: 10.3389/fncel.2022.903729. eCollection 2022. Front Cell Neurosci. 2022. PMID: 35634470 Free PMC article. Review. - Genes Associated with Disturbed Cerebral Neurogenesis in the Embryonic Brain of Mouse Models of Down Syndrome.
Ishihara K. Ishihara K. Genes (Basel). 2021 Oct 11;12(10):1598. doi: 10.3390/genes12101598. Genes (Basel). 2021. PMID: 34680993 Free PMC article. Review. - A plant-specific DYRK kinase DYRKP coordinates cell morphology in Marchantia polymorpha.
Furuya T, Shinkawa H, Kajikawa M, Nishihama R, Kohchi T, Fukuzawa H, Tsukaya H. Furuya T, et al. J Plant Res. 2021 Nov;134(6):1265-1277. doi: 10.1007/s10265-021-01345-w. Epub 2021 Sep 21. J Plant Res. 2021. PMID: 34549353 Free PMC article.
References
- Amano K, Sago H, Uchikawa C, Suzuki T, Kotliarova SE, Nukina N, Epstein CJ, Yamakawa K 2004. Dosage-dependent over-expression of genes in the trisomic region of Ts1Cje mouse model for Down syndrome. Hum Mol Genet 13: 1333–1340 - PubMed
- Antonarakis SE, Lyle R, Dermitzakis ET, Reymond A, Deutsch S 2004. Chromosome 21 and Down syndrome: From genomics to pathophysiology. Nat Rev Genet 5: 725–738 - PubMed
- Arron JR, Winslow MM, Polleri A, Chang CP, Wu H, Gao X, Neilson JR, Chen L, Heit JJ, Kim SK, et al. 2006. NFAT dysregulation by increased dosage of DSCR1 and DYRK1A on chromosome 21. Nature 441: 595–600 - PubMed
- Bulfone A, Smiga SM, Shimamura K, Peterson A, Puelles L, Rubenstein JL 1995. T-brain-1a homolog of Brachyury whose expression defines molecularly distinct domains within the cerebral cortex. Neuron 15: 63–78 - PubMed
Publication types
MeSH terms
Substances
LinkOut - more resources
Full Text Sources
Other Literature Sources
Medical
Molecular Biology Databases
Research Materials
Miscellaneous


