The CP110-interacting proteins Talpid3 and Cep290 play overlapping and distinct roles in cilia assembly - PubMed (original) (raw)
The CP110-interacting proteins Talpid3 and Cep290 play overlapping and distinct roles in cilia assembly
Tetsuo Kobayashi et al. J Cell Biol. 2014.
Abstract
We have identified Talpid3/KIAA0586 as a component of a CP110-containing protein complex important for centrosome and cilia function. Talpid3 assembles a ring-like structure at the extreme distal end of centrioles. Ablation of Talpid3 resulted in an aberrant distribution of centriolar satellites involved in protein trafficking to centrosomes as well as cilia assembly defects, reminiscent of loss of Cep290, another CP110-associated protein. Talpid3 depletion also led to mislocalization of Rab8a, a small GTPase thought to be essential for ciliary vesicle formation. Expression of activated Rab8a suppressed cilia assembly defects provoked by Talpid3 depletion, suggesting that Talpid3 affects cilia formation through Rab8a recruitment and/or activation. Remarkably, ultrastructural analyses showed that Talpid3 is required for centriolar satellite dispersal, which precedes the formation of mature ciliary vesicles, a process requiring Cep290. These studies suggest that Talpid3 and Cep290 play overlapping and distinct roles in ciliary vesicle formation through regulation of centriolar satellite accretion and Rab8a.
Figures
Figure 1.
Talpid3 interacts with CP110, Cep97, Kif24, and Cep290. (A) Flag-tagged Talpid3 or Flag alone was expressed in HEK293 cells, and lysates were immunoprecipitated with an anti-Flag antibody. The resulting immunoprecipitates were Western blotted with anti-Flag, or anti-CP110 antibodies. (B) Western blotting of endogenous proteins after immunoprecipitation of HEK293 cell extracts with antibodies indicated at the top of panel. IN, input.
Figure 2.
Talpid3 localizes to the distal ends of centrioles. (A) RPE1 cells in diverse stages of the cell cycle were processed for immunofluorescence with anti-Talpid3_2 (red) and anti-centrin (green) antibodies. (B) RPE1 cells were visualized with anti-Talpid3_2 (red) and anti–γ-tubulin, C-Nap1, Sas-6, Cep170, or Centrin2 (green) antibodies. Bars: (A and B)10 µm; (insets) 2.5 µm. DNA was stained with DAPI (blue).
Figure 3.
Talpid3 forms a ring-like structure at the distal rim of both mother and daughter centrioles. (A and B) RPE1 cells were visualized using an OMX super-resolution microscope in asynchronously growing conditions stained with the indicated combinations of antibodies. (C–E) Antibodies against glutamylated tubulin (GT335), Cep164, and Talpid3_2 were used to stain RPE1 cells during growing (C), 6 h serum starvation (D), and 24 h serum starvation (E) conditions. The bottom panels of C–E show y-axis rotations of the top panels by 165° (C), 48° (D), and 150° (E) in a clockwise manner to best represent the sub-centriolar localization pattern of Talpid3. (F) Schematic representation of the centrosome illustrates the localization of Talpid3 at the distal rim of both the mother centrioles (MC) and daughter centrioles (DC). Bars, 500 nm.
Figure 4.
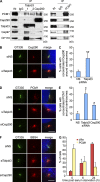
Talpid3 interacts with PCM1 and regulates localization of centriolar satellites markers. (A) Western blotting of endogenous PCM1, Cep290, Talpid3, Cep97, and CP110 after immunoprecipitation of RPE1 cell extracts with antibodies indicated at the top of panel. IN, input. (B, D, and F) RPE1 cells transiently transfected with control (siNS), Talpid3, or Cep290 siRNAs were induced to quiescence for 48 h and processed for immunofluorescence with anti-glutamylated tubulin (GT335, green) and (B) anti-Cep290, (D) anti-PCM1, or (F) anti-BBS4 (red) antibodies. Bars, 5 µm. DNA was stained with DAPI (blue). (C and E) The percentage of quiescent RPE1 cells with accumulations of Cep290 (C) or PCM1 (E) granules around the centrosomes are shown. Average of three independent experiments are shown. *, P < 0.01; **, P < 0.05 compared with NS. (G) RPE1 cells were induced to quiescence and processed for immunofluorescence with anti-glutamylated tubulin and anti-PCM1 antibodies at indicated times after serum starvation. The percentages of RPE1 cells with primary cilia or accumulation of PCM1 granules around centrosomes were determined. Average of two independent experiments is shown.
Figure 5.
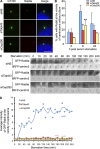
Talpid3 and Cep290 control Rab8 localization at early phase of ciliogenesis. (A) RPE1 cells transiently transfected with control (siNS), Talpid3, or Cep290 siRNA were induced to quiescence for 6 h and processed for immunofluorescence with anti-glutamylated tubulin (GT335, green) and anti-Rab8a (red) antibodies. DNA was stained with DAPI (blue). Bar, 5 µm. (B) RPE1 cells transiently transfected with control, Talpid3, or Cep290 siRNAs were induced to quiescence and processed for immunofluorescence with anti-glutamylated tubulin and anti-Rab8a antibodies at indicated times after serum starvation. The percentages of RPE1 cells that stain for Rab8a in the vicinity of centrosomes were determined. Average of two to four independent experiments is shown. *, P < 0.01; **, P < 0.05 compared with NS at 6 h after serum starvation. (C and D) GFP-Rab8a RPE1 cells transiently transfected with a plasmid expressing tagRFP-Centrin2 and control, Talpid3, or Cep290 siRNAs were induced to quiescence and processed for live-cell imaging. (C) Images were taken at indicated time points. Bar, 2.5 µm. (D) The average intensity of GFP-Rab8a signals at the vicinity of centrosomes was quantified. Dots and lines show average values and trend lines, respectively.
Figure 6.
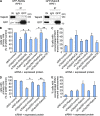
Rab8a functions downstream of Talpid3 and Cep290 in ciliogenesis. (A) Western blotting of Talpid3 and GFP after immunoprecipitation of RPE1 cell extracts stably expressing GFP-Rab8a or GFP-Rabin8 with antibodies indicated at the top of panel. IN, input. (B and D) RPE1 cells treated with control (siNS), Talpid3, or Cep290 siRNA were transiently transfected with plasmids expressing GFP and (B) Myc, Myc-Rab8a/QL, or Myc-Rab8a/TN, or (D) Flag, or Flag-Rabin8, and induced to quiescence for 48 h. Cells were processed for immunofluorescence with an anti-glutamylated tubulin (GT335) antibody. The percentages of GFP-positive RPE1 cells with primary cilia were determined. (C and E) RPE1 cells treated with control, Talpid3, or Cep290 siRNA were transiently transfected with plasmids expressing GFP-Centrin2 and (C) Myc, Myc-Rab8a/QL, or Myc-Rab8a/TN, or (E) Flag, or Flag-Rabin8, and induced to quiescence for 48 h. Cells were processed for immunofluorescence with an anti-PCM1 antibody. The percentages of GFP-Centrin2–positive RPE1 cells with concentrated PCM1 granules around centrosomes were determined. (B–E) Average of three independent experiments is shown. *, P < 0.01; **, P < 0.05.
Figure 7.
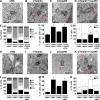
Ablation of Talpid3 or Cep290 suppresses cilia formation via distinct processes. (A–D, H–K) RPE1 cells transiently transfected with siRNA against control (siNS; A and H), Talpid3 (B and I), Cep290 (C and J), or Talpid3 and Cep290 (D and K) were serum starved for 6 h (A–D) or 24 h (H–K) and processed for TEM. Red arrows indicate ciliary vesicles and red arrowheads indicate centriolar satellites. Bars, 500 nm. (E and L) Each siRNA treated population was quantified at 6 h (E) or 24 h (L) of serum starvation with the percentages of cells that were ciliated (Cilia), contained ciliary vesicles (CV), contained ciliary vesicles and centriolar satellites (CV + CS), or centriolar satellites (CS). Centrosomes without CV and/or CS were labeled as centrosomes only (CO). (F and M) Percentages of cells with CS and CV + CS are quantified for each siRNA-treated sample at 6 h (F) or 24 h (M) of serum starvation. (G and N) Percentages of cells with CV and CV + CS are quantified at 6 h (G) or 24 h (N) of serum starvation according to the frequency of populations containing primary ciliary vesicles (PCV) or capped ciliary vesicles (CCV). (E–G and L–N) Average of three independent experiments is shown. Error bars indicate SEM. *, P < 0.01; **, P < 0.05 compared with control siRNA.
Figure 8.
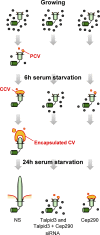
Model summarizing the roles of Talpid3 and/or Cep290 during cilium assembly. Centrioles associated with ciliary vesicles are marked as PCV, CCV, and Encapsulated CV (primary, capped, and encapsulated ciliary vesicle, respectively). See text for details.
Similar articles
- CP110 suppresses primary cilia formation through its interaction with CEP290, a protein deficient in human ciliary disease.
Tsang WY, Bossard C, Khanna H, Peränen J, Swaroop A, Malhotra V, Dynlacht BD. Tsang WY, et al. Dev Cell. 2008 Aug;15(2):187-97. doi: 10.1016/j.devcel.2008.07.004. Dev Cell. 2008. PMID: 18694559 Free PMC article. - The novel centriolar satellite protein SSX2IP targets Cep290 to the ciliary transition zone.
Klinger M, Wang W, Kuhns S, Bärenz F, Dräger-Meurer S, Pereira G, Gruss OJ. Klinger M, et al. Mol Biol Cell. 2014 Feb;25(4):495-507. doi: 10.1091/mbc.E13-09-0526. Epub 2013 Dec 19. Mol Biol Cell. 2014. PMID: 24356449 Free PMC article. - CEP290 interacts with the centriolar satellite component PCM-1 and is required for Rab8 localization to the primary cilium.
Kim J, Krishnaswami SR, Gleeson JG. Kim J, et al. Hum Mol Genet. 2008 Dec 1;17(23):3796-805. doi: 10.1093/hmg/ddn277. Epub 2008 Sep 4. Hum Mol Genet. 2008. PMID: 18772192 Free PMC article. - Role of DZIP1-CBY-FAM92 transition zone complex in the basal body to membrane attachment and ciliary budding.
Lapart JA, Billon A, Duteyrat JL, Thomas J, Durand B. Lapart JA, et al. Biochem Soc Trans. 2020 Jun 30;48(3):1067-1075. doi: 10.1042/BST20191007. Biochem Soc Trans. 2020. PMID: 32491167 Review. - Unraveling the mysteries of centriolar satellites: time to rewrite the textbooks about the centrosome/cilium complex.
Odabasi E, Batman U, Firat-Karalar EN. Odabasi E, et al. Mol Biol Cell. 2020 Apr 15;31(9):866-872. doi: 10.1091/mbc.E19-07-0402. Mol Biol Cell. 2020. PMID: 32286929 Free PMC article. Review.
Cited by
- Hedgehog Signaling and Embryonic Craniofacial Disorders.
Abramyan J. Abramyan J. J Dev Biol. 2019 Apr 24;7(2):9. doi: 10.3390/jdb7020009. J Dev Biol. 2019. PMID: 31022843 Free PMC article. Review. - Progenitor-Based Cell Biological Aspects of Neocortex Development and Evolution.
Vaid S, Huttner WB. Vaid S, et al. Front Cell Dev Biol. 2022 May 2;10:892922. doi: 10.3389/fcell.2022.892922. eCollection 2022. Front Cell Dev Biol. 2022. PMID: 35602606 Free PMC article. Review. - Insights Gained From Zebrafish Models for the Ciliopathy Joubert Syndrome.
Rusterholz TDS, Hofmann C, Bachmann-Gagescu R. Rusterholz TDS, et al. Front Genet. 2022 Jun 30;13:939527. doi: 10.3389/fgene.2022.939527. eCollection 2022. Front Genet. 2022. PMID: 35846153 Free PMC article. Review. - The ABCs of Centriole Architecture: The Form and Function of Triplet Microtubules.
Wang JT, Stearns T. Wang JT, et al. Cold Spring Harb Symp Quant Biol. 2017;82:145-155. doi: 10.1101/sqb.2017.82.034496. Epub 2018 Mar 14. Cold Spring Harb Symp Quant Biol. 2017. PMID: 29540555 Free PMC article. - Rpgrip1l controls ciliary gating by ensuring the proper amount of Cep290 at the vertebrate transition zone.
Wiegering A, Dildrop R, Vesque C, Khanna H, Schneider-Maunoury S, Gerhardt C. Wiegering A, et al. Mol Biol Cell. 2021 Apr 15;32(8):675-689. doi: 10.1091/mbc.E20-03-0190. Epub 2021 Feb 24. Mol Biol Cell. 2021. PMID: 33625872 Free PMC article.
References
- Bachmann-Gagescu R., Phelps I.G., Stearns G., Link B.A., Brockerhoff S.E., Moens C.B., Doherty D. 2011. The ciliopathy gene cc2d2a controls zebrafish photoreceptor outer segment development through a role in Rab8-dependent vesicle trafficking. Hum. Mol. Genet. 20:4041–4055 10.1093/hmg/ddr332 - DOI - PMC - PubMed
Publication types
MeSH terms
Substances
LinkOut - more resources
Full Text Sources
Other Literature Sources
Molecular Biology Databases


