The binary protein-protein interaction landscape of Escherichia coli - PubMed (original) (raw)
. 2014 Mar;32(3):285-290.
doi: 10.1038/nbt.2831. Epub 2014 Feb 23.
Patricia Sikorski # 1, Ashwani Kumar # 2, Roberto Mosca # 3, James Vlasblom 2, Roland Arnold 4, Jonathan Franca-Koh 1, Suman B Pakala 1, Sadhna Phanse 2, Arnaud Ceol 3, Roman Häuser 5, Gabriella Siszler 5, Stefan Wuchty 6, Andrew Emili 4, Mohan Babu 2, Patrick Aloy 3 7, Rembert Pieper 1, Peter Uetz 8
Affiliations
- PMID: 24561554
- PMCID: PMC4123855
- DOI: 10.1038/nbt.2831
The binary protein-protein interaction landscape of Escherichia coli
Seesandra V Rajagopala et al. Nat Biotechnol. 2014 Mar.
Abstract
Efforts to map the Escherichia coli interactome have identified several hundred macromolecular complexes, but direct binary protein-protein interactions (PPIs) have not been surveyed on a large scale. Here we performed yeast two-hybrid screens of 3,305 baits against 3,606 preys (∼70% of the E. coli proteome) in duplicate to generate a map of 2,234 interactions, which approximately doubles the number of known binary PPIs in E. coli. Integration of binary PPI and genetic-interaction data revealed functional dependencies among components involved in cellular processes, including envelope integrity, flagellum assembly and protein quality control. Many of the binary interactions that we could map in multiprotein complexes were informative regarding internal topology of complexes and indicated that interactions in complexes are substantially more conserved than those interactions connecting different complexes. This resource will be useful for inferring bacterial gene function and provides a draft reference of the basic physical wiring network of this evolutionarily important model microbe.
Figures
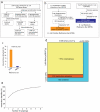
Figure 1. Systematic identification of binary PPIs in E. coli
(a) Pipeline used to construct E. coli Y2H bait and prey libraries. The Y2H libraries were constructed by transferring 3,971 Gateway-compatible E. coli entry clones into AD (activation domain, pGADT7g) and DB (DNA binding domain, pGBGT7g and pGBKCatg) Y2H vectors using Gateway recombination cloning. (b) Pipeline used to assemble literature-curated binary E. coli PPIs (a positive reference set (PRS)) and random reference set (RRS) for binary PPIs. (c) Percentage of the PRS and RRS detected by the Y2H system (error bars denote standard error). (d) Coverage of E. coli proteome (a total of ~4200 ORFs) and the search space of pair-wise protein combinations tested. (e) Sampling sensitivity of Y2H screens measured by screening 92 baits multiple times (error bars denote standard error). Based on this, the mean sampling sensitivity was estimated to be 69% (+/− 2.5%) for the two screens performed on the full search-space.
Figure 2. Quality assessment and comparison of Y2H interactions with data from the literature
(a) Immunoblots of 6 of the 114 randomly selected PPIs identified by Y2H assay that were tested by co-immunoprecipitation. The interacting pairs and negative controls (vector) were co-transformed into E. coli and protein binding was detected by immunoblotting (Online Methods). (b) The same 114 randomly selected interacting protein pairs were tested by LUMIER assay . Interactions were scored as positive when exhibiting a luminescence intensity ratio (LIR) value > 3 and a p-value <0.05. These two values are plotted against each other in the graph in logarithmic scale. The LIR and p-value thresholds are indicated by dashed lines: (log (LIR) >0.477; log (p) <−1.30). (c) Number of PPIs validated by Co-IP, LUMIER or both assays. (d) Overlap between interactions detected in this large-scale Y2H (pink) and in the literature. The manually curated literature-binary PPIs (purple) are compiled from the microbial protein interaction database (MPIDB;
http://jcvi.org/mpidb/about.php
) which consists of 1,941 manually curated binary PPIs. The combined-AP-MS PPIs (beige) were predicted from large scale AP-MS studies– and consists of 20,425 PPIs. (e) Pipeline used to detect direct interactions within co-complexes by Y2H matrix screening.
Figure 3. Structural analysis of the E. coli binary interactome
Nodes (representing proteins) are colored according to the availability of structural data. Edges (representing PPIs) are colored according to their source (literature, our Y2H experiment or both). The sub-networks (enlarged parts) are based on a previous AP-MS study and for which Y2H and literature binary interactions provided the topology for a sub-complex of at least three components. Protein structural data is overlaid. For example, protein complex 42 (bottom left) contains seven proteins; the Y2H binary interactions suggest a topology for five subunits in the complex, and all the subunits have either a complete structure or a model. Furthermore, for two interactions between three different components we have structures of the binary sub-complexes. For complexes 72, 100, and 103 the Y2H binary interactions identified in our screens suggest an almost complete topology.
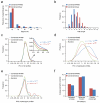
Figure 4. Comparison of the properties of binary and AP-MS interaction networks
(a) The degree of a node in a network (degree distribution) involving essential E. coli protein pairs from the combined-binary (data from this study and literature binary interactions) and combined AP-MS networks, . (b) Frequency distribution involving protein pairs from the combined-binary and combined AP-MS PPI networks at different path lengths. For panels A and B, the data were sampled by considering the same number of interactions among the same number of nodes in the two datasets. (c) Distribution of the Pearson correlation coefficient (PCC) between the GI profiles for gene pairs encoding interacting proteins derived from combined-binary or combined-AP-MS network versus random gene pairs. (d) Distribution of co-expression and (e) condition-dependent phenotypic correlation profiles with corresponding interacting proteins, shown as in (c). The p-values for panels (c,d,e) were computed (i.e., AP-MS vs. random (blue) and combined-binary vs. random (brown)) using the Student's _t_- test. (f) Average semantic similarity of the combined-binary and combined-AP-MS PPI networks is shown for Gene Ontology (GO) categories.
Figure 5. Integrative analyses on the PPI and GI data
Examples of sub-networks showing the physical and genetic connectivity among the components of various bioprocesses. Sub-networks containing Y2H physical interactions (shown as grey edges) among 1,269 proteins are derived using a Markov clustering approach. The GIs (red edges for negative interactions and green for positive interactions) from the published large scale eSGA surveys, , were overlaid on the PPI network. Sub-networks with positive and/or negative interactions are highlighted with shaded ovals: (a) secretion components (cluster ID: 5); (b) flagellum or motility components (cluster ID: 9); (c) subunits of ATP-dependent protease complexes (cluster ID: 14); and (d) ycfM and pbpG (cluster ID: 8). For details on GIs in each of the sub-networks and clusters IDs see Supplementary Tables 7 and 8. Large nodes in each sub-network indicated that genetic associations with the indicated protein subunits are known; small nodes indicate an absence of GIs.
Figure 6. Conservation of physical interactions between and within protein complexes
(a) Phylogenetic tree based on the comparison of complete proteomes of 20 different bacteria that are closely related to E. coli. Using bacterial proteins that had orthologs in E. coli, we determined the sets of interologs (that is, conserved interacting homologs, Ncons.PPI) in each organism. Normalizing the number of interologs by the corresponding number of orthologs in each organism (Northo), we observed a declining trend with increasing distance from E. coli in the phylogenetic tree. (b) Bacteria were sorted according to their numbers of predicted interologs and the data suggest that PPIs in E. coli were more conserved in evolutionarily closer organisms. However, we found the opposite trend when we considered the fraction of conserved interactions between essential E. coli proteins (left panel, red). We determined the number of interactions between proteins in other species that are in the same complex or in different complexes compared to protein complexes in E. coli (right panel) and found that interactions are more conserved in species closely related to E. coli, but interactions within complexes are more often conserved than interactions between complexes.
Comment in
- E. coli network upgrade.
Stelzl U. Stelzl U. Nat Biotechnol. 2014 Mar;32(3):241-3. doi: 10.1038/nbt.2848. Nat Biotechnol. 2014. PMID: 24727776 No abstract available.
Similar articles
- Reliable identification of protein-protein interactions by crosslinking mass spectrometry.
Lenz S, Sinn LR, O'Reilly FJ, Fischer L, Wegner F, Rappsilber J. Lenz S, et al. Nat Commun. 2021 Jun 11;12(1):3564. doi: 10.1038/s41467-021-23666-z. Nat Commun. 2021. PMID: 34117231 Free PMC article. - A second-generation protein-protein interaction network of Helicobacter pylori.
Häuser R, Ceol A, Rajagopala SV, Mosca R, Siszler G, Wermke N, Sikorski P, Schwarz F, Schick M, Wuchty S, Aloy P, Uetz P. Häuser R, et al. Mol Cell Proteomics. 2014 May;13(5):1318-29. doi: 10.1074/mcp.O113.033571. Epub 2014 Mar 13. Mol Cell Proteomics. 2014. PMID: 24627523 Free PMC article. - Next-generation large-scale binary protein interaction network for Drosophila melanogaster.
Tang HW, Spirohn K, Hu Y, Hao T, Kovács IA, Gao Y, Binari R, Yang-Zhou D, Wan KH, Bader JS, Balcha D, Bian W, Booth BW, Coté AG, de Rouck S, Desbuleux A, Goh KY, Kim DK, Knapp JJ, Lee WX, Lemmens I, Li C, Li M, Li R, Lim HJ, Liu Y, Luck K, Markey D, Pollis C, Rangarajan S, Rodiger J, Schlabach S, Shen Y, Sheykhkarimli D, TeeKing B, Roth FP, Tavernier J, Calderwood MA, Hill DE, Celniker SE, Vidal M, Perrimon N, Mohr SE. Tang HW, et al. Nat Commun. 2023 Apr 15;14(1):2162. doi: 10.1038/s41467-023-37876-0. Nat Commun. 2023. PMID: 37061542 Free PMC article. - Interactome mapping for analysis of complex phenotypes: insights from benchmarking binary interaction assays.
Braun P. Braun P. Proteomics. 2012 May;12(10):1499-518. doi: 10.1002/pmic.201100598. Proteomics. 2012. PMID: 22589225 Review. - Yeast two-hybrid contributions to interactome mapping.
Parrish JR, Gulyas KD, Finley RL Jr. Parrish JR, et al. Curr Opin Biotechnol. 2006 Aug;17(4):387-93. doi: 10.1016/j.copbio.2006.06.006. Epub 2006 Jun 27. Curr Opin Biotechnol. 2006. PMID: 16806892 Review.
Cited by
- Computing the functional proteome: recent progress and future prospects for genome-scale models.
O'Brien EJ, Palsson BO. O'Brien EJ, et al. Curr Opin Biotechnol. 2015 Aug;34:125-34. doi: 10.1016/j.copbio.2014.12.017. Epub 2015 Jan 8. Curr Opin Biotechnol. 2015. PMID: 25576845 Free PMC article. Review. - YbiB: a novel interactor of the GTPase ObgE.
Deckers B, Vercauteren S, De Kock V, Martin C, Lazar T, Herpels P, Dewachter L, Verstraeten N, Peeters E, Ballet S, Michiels J, Galicia C, Versées W. Deckers B, et al. Nucleic Acids Res. 2023 Apr 24;51(7):3420-3435. doi: 10.1093/nar/gkad127. Nucleic Acids Res. 2023. PMID: 36864742 Free PMC article. - Testing the Domino Theory of Gene Loss in Buchnera aphidicola: The Relevance of Epistatic Interactions.
Martínez-Cano DJ, Bor G, Moya A, Delaye L. Martínez-Cano DJ, et al. Life (Basel). 2018 May 29;8(2):17. doi: 10.3390/life8020017. Life (Basel). 2018. PMID: 29843462 Free PMC article. - Mechismo: predicting the mechanistic impact of mutations and modifications on molecular interactions.
Betts MJ, Lu Q, Jiang Y, Drusko A, Wichmann O, Utz M, Valtierra-Gutiérrez IA, Schlesner M, Jaeger N, Jones DT, Pfister S, Lichter P, Eils R, Siebert R, Bork P, Apic G, Gavin AC, Russell RB. Betts MJ, et al. Nucleic Acids Res. 2015 Jan;43(2):e10. doi: 10.1093/nar/gku1094. Epub 2014 Nov 11. Nucleic Acids Res. 2015. PMID: 25392414 Free PMC article. - Identification of YbeY-Protein Interactions Involved in 16S rRNA Maturation and Stress Regulation in Escherichia coli.
Vercruysse M, Köhrer C, Shen Y, Proulx S, Ghosal A, Davies BW, RajBhandary UL, Walker GC. Vercruysse M, et al. mBio. 2016 Nov 8;7(6):e01785-16. doi: 10.1128/mBio.01785-16. mBio. 2016. PMID: 27834201 Free PMC article.
References
- Butland G, et al. Interaction network containing conserved and essential protein complexes in Escherichia coli. Nature. 2005;433:531–537. - PubMed
- Rual JF, et al. Towards a proteome-scale map of the human protein-protein interaction network. Nature. 2005;437:1173–1178. - PubMed
Publication types
MeSH terms
Substances
LinkOut - more resources
Full Text Sources
Other Literature Sources
Molecular Biology Databases


