Iron metabolism regulates p53 signaling through direct heme-p53 interaction and modulation of p53 localization, stability, and function - PubMed (original) (raw)
. 2014 Apr 10;7(1):180-93.
doi: 10.1016/j.celrep.2014.02.042. Epub 2014 Mar 27.
Xiangpeng Sheng 1, Zenan Chang 2, Qian Wu 3, Sheng Wang 1, Zongliang Xuan 4, Dan Li 5, Yalan Wu 6, Yongjia Shang 4, Xiangtao Kong 6, Long Yu 7, Lin Li 6, Kangchen Ruan 6, Hongyu Hu 6, Ying Huang 6, Lijian Hui 8, Dong Xie 9, Fudi Wang 10, Ronggui Hu 11
Affiliations
- PMID: 24685134
- PMCID: PMC4219651
- DOI: 10.1016/j.celrep.2014.02.042
Iron metabolism regulates p53 signaling through direct heme-p53 interaction and modulation of p53 localization, stability, and function
Jia Shen et al. Cell Rep. 2014.
Abstract
Iron excess is closely associated with tumorigenesis in multiple types of human cancers, with underlying mechanisms yet unclear. Recently, iron deprivation has emerged as a major strategy for chemotherapy, but it exerts tumor suppression only on select human malignancies. Here, we report that the tumor suppressor protein p53 is downregulated during iron excess. Strikingly, the iron polyporphyrin heme binds to p53 protein, interferes with p53-DNA interactions, and triggers both nuclear export and cytosolic degradation of p53. Moreover, in a tumorigenicity assay, iron deprivation suppressed wild-type p53-dependent tumor growth, suggesting that upregulation of wild-type p53 signaling underlies the selective efficacy of iron deprivation. Our findings thus identify a direct link between iron/heme homeostasis and the regulation of p53 signaling, which not only provides mechanistic insights into iron-excess-associated tumorigenesis but may also help predict and improve outcomes in iron-deprivation-based chemotherapy.
Copyright © 2014 The Authors. Published by Elsevier Inc. All rights reserved.
Figures
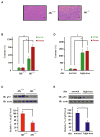
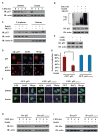
Figure 1. Tumor Suppressor p53 Protein Is Downregulated in Iron Excess
(A) Perls’ Prussian Blue staining of Hfe+/+ and Hfe−/− mouse liver sections (representative sections shown). Scale bars represent 100 μm. (B–E) Homeostatic levels of iron, heme, and endogenous p53 protein in the livers of Hfe−/− and Hfe+/+ mice (B and C) or Hfe+/+ mice fed on a normal or high-iron diet were measured (D and E). Iron or heme content was determined using an unsaturated iron-binding capacity or TMB assay, respectively (B and D), and protein levels were measured by immunoblotting (IB) with the indicated antibodies (C and E). In (B) and (D), iron or heme levels in the livers of wild-type mice fed a normal diet were set to 100%. Protein levels were normalized by setting the static endogenous p53 levels in the livers of Hfe+/+ mice (C) and normal-diet mice (E) as 100%. Comparative quantification of band intensities was performed with ImageJ. Bar graphs are shown as mean ± SEM (n = 3). *p < 0.05.
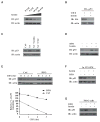
Figure 2. Hemin Destabilizes p53 Protein Independently of HIF-1α
Immunoblots (IB) were probed with the indicated antibodies. (A) HepG2 cells were treated with hemin at indicated concentrations for 8 hr. (B) HepG2 cells transiently expressing HA-tagged human p53 were pretreated with CHX (25 μg/ml) for 6 hr before hemin addition (15 μM, 8 hr). (C) HepG2 cells were cultured in the absence (Ctrl) or presence of succinylacetone (1 mM, 24 hr), with or without hemin (10 μM, 6 hr) or FAC (100 μg/ml, 6 hr) treatment. (D) HCT116 p53+/+ cells were treated with or without DFO (100 μM, 24 hr) and with or without hemin (10 μM, 8 hr). (E) HepG2 cells were pretreated with or without DFO (100 μM, 24 hr), then subjected to CHX (25 μg/ml) treatment for the indicated times. Relative amounts of remaining endogenous p53 protein (%) were plotted against the indicated time course (lower panel). (F) HepG2 cells, adapted to serum-free growth conditions by growing in VP-SFM (Invitrogen) for 8 hr, were treated with DFO (100 μM, 24 hr), hemin (10 μM, 24 hr), or both. (G) HIF-1α and vHL null 786-O cells were treated with DFO (100 μM, 24 hr), hemin (10 μM, 8 hr), or both.
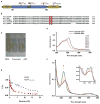
Figure 3. Tumor Suppressor p53 Protein Directly Interacts with Heme
(A) Schematic domain structure of human p53 protein, with putative HRMs marked by their amino acid sequences. TAD, transcription activation domain; TET, tetramerization domain. (B) Sequence alignment of the CACP motif in p53 proteins across species. (C) Gel filtration of p53 protein. BSA was used as a positive control of heme binding and lysozyme as the negative control. (D) UV-Vis spectrum of heme-p53 complexes (after gel filtration). Inset shows the purity of the p53 protein. (E) A tryptophan fluorescence quenching assay of hemin with wild-type and mutant p53 determined that heme associates with wild-type human p53 protein at a KD of ~1.20 μM and with p53C275,277A at a KD of ~15.70 μM. (F) UV-Vis spectra analyses were performed with p53-heme complexes before (red line) and after infusion of CO. Arrow indicates the spectral shift upon infusion of increasing CO until saturation (cyan line). Inset panel zooms in on the 450–625 nm range.
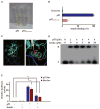
Figure 4. Heme Interacts with Tumor Suppressor p53 through Its C275AC277P Motif and Interferes with p53-DNA Interactions
(A and B) Recombinant wild-type or p53C275,277A mutant protein (10 μM) was incubated with hemin (50 μM) on ice, followed by gel filtration and TMB assay (Pierce). (C) A close-up view of the C275 and C277 residues of human p53 in the p53 core domain-DNA (Cho et al., 1994) (derived from PDB 1TSR). (D) EMSA of the indicated hemin amounts, p53 protein, and double-stranded DNA probes containing p53RE consensus sequences. Band designations are free DNA (F) and bound DNA (B; p53-DNA complex). (E) HCT116 p53−/− cells transiently expressing HA-tagged wild-type p53 were cotransfected with indicated luciferase reporter plasmids, then treated with or without hemin (10 μM, 6 hr). Error bars indicate ± SEM (n = 3). **p < 0.01.
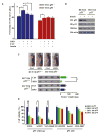
Figure 5. Heme Destabilizes p53 Protein through Triggering Its Nuclear Export
Immunoblots (IB) were probed with the indicated antibodies. (A) HepG2 cells were treated with or without hemin (10 μM, 10 hr) in the presence of CHX (25 μg/ml) for the indicated times. (B) HepG2 cells transiently expressing His6-tagged Ub (His6-Ubi) were treated with hemin (10 μM), MG132 (10 μM), or both for 6 hr. Endogenous p53 protein was immunoprecipitated with anti-p53 in modified RIPA buffer, followed by immunoblotting with anti-His6. (C) Cytoplasmic and nuclear fractions were prepared from HepG2 cells treated with or without hemin (10 μM, 6 hr), using actin and lamin B as respective references. Where indicated, 10 μM MG132 was added. (D) Immunofluorescence microscopy of p53 in HepG2 cells with or without hemin (10 μM, 5 hr). (E) Hep2G cells were treated with or without LMB (5 ng/ml) and hemin (10 μM). (F and G) Both GFP-p53L348, 350A (nuclear export sequence mutant) and GFP-p53C275,277A (the p53 mutant impaired in heme binding) were resistant to hemin-induced nuclear export (10 μM, 6 hr). The percentages of cells with predominantly nuclear localization of p53 over the total number of GFP-positive cells in a field of view were quantified in (G). The scale bars represent 10 μm. Data are shown with mean ± SEM (n = 5). **p < 0.01. (H) HepG2 cells expressing HA-tagged wild-type p53 or HA-tagged p53L348,350A mutant were treated with hemin (10 μM, 6 hr) in the presence of CHX (25 μg/ml) for the indicated times. (I) HepG2 cells expressing HA-tagged wild-type p53 or HA-tagged p53 C275, 277A mutant were treated with hemin (10 μM, 6 hr) in the presence of CHX (25 μg/ml) for the indicated times.
Figure 6. Iron Deprivation Suppresses Multiple Human Tumors in a p53-Dependent Manner
(A) Flow cytometry analyses of HCT116 p53+/+ or HCT116 p53−/− cells treated with or without DFO (100 μM, 24 hr), FAC (100 μg/ml, 8 hr), or hemin (10 μM, 8 hr) as indicated. Data are represented as mean ± SEM (n = 3). *p < 0.05. (B) Hemin treatment (10 μM, 6 hr) destabilized p53 and downregulated endogenous p21 and Bax expression in a p53-dependent manner. (C) Nude mice were subcutaneously seeded with HCT116 p53+/+ and HCT116 p53−/− cells and treated with DFO (500 mg/kg/d over 6 consecutive days). Tumor masses were dissected from treated mice and weighed. Data are represented as mean ± SEM (n = 4). **p < 0.01. (D) p53 null (NCI-H1299, SaoS2, and CRL-5807) and wild-type p53 (U2OS, ACHN, and NCI-H460) human cancer cell lines were seeded in a 96-well plate at a density of 2 × 10³ cells per well and subjected to DFO treatment at indicated concentrations for 72 hr. Cells were stained with Hoechst 33258 for 1 hr, and Hoechst-positive cells were counted in fluorescence images. The data represent at least three independent experiments. Error bars indicate ± SEM. **p < 0.01.
Similar articles
- The heme-p53 interaction: Linking iron metabolism to p53 signaling and tumorigenesis.
Shen J, Sheng X, Chang Z, Wu Q, Xie D, Wang F, Hu R. Shen J, et al. Mol Cell Oncol. 2014 Nov 3;3(1):e965642. doi: 10.4161/23723548.2014.965642. eCollection 2016 Jan. Mol Cell Oncol. 2014. PMID: 27308524 Free PMC article. - Regulation of iron homeostasis by the p53-ISCU pathway.
Funauchi Y, Tanikawa C, Yi Lo PH, Mori J, Daigo Y, Takano A, Miyagi Y, Okawa A, Nakamura Y, Matsuda K. Funauchi Y, et al. Sci Rep. 2015 Nov 12;5:16497. doi: 10.1038/srep16497. Sci Rep. 2015. PMID: 26560363 Free PMC article. - Dual role of heme iron in cancer; promotor of carcinogenesis and an inducer of tumour suppression.
Gamage SMK, Lee KTW, Dissabandara DLO, Lam AK, Gopalan V. Gamage SMK, et al. Exp Mol Pathol. 2021 Jun;120:104642. doi: 10.1016/j.yexmp.2021.104642. Epub 2021 Apr 24. Exp Mol Pathol. 2021. PMID: 33905708 Review. - 14-3-3 sigma positively regulates p53 and suppresses tumor growth.
Yang HY, Wen YY, Chen CH, Lozano G, Lee MH. Yang HY, et al. Mol Cell Biol. 2003 Oct;23(20):7096-107. doi: 10.1128/MCB.23.20.7096-7107.2003. Mol Cell Biol. 2003. PMID: 14517281 Free PMC article. - p53 tumor suppressor and iron homeostasis.
Zhang J, Chen X. Zhang J, et al. FEBS J. 2019 Feb;286(4):620-629. doi: 10.1111/febs.14638. Epub 2018 Sep 4. FEBS J. 2019. PMID: 30133149 Free PMC article. Review.
Cited by
- Lycorine inhibits glioblastoma multiforme growth through EGFR suppression.
Shen J, Zhang T, Cheng Z, Zhu N, Wang H, Lin L, Wang Z, Yi H, Hu M. Shen J, et al. J Exp Clin Cancer Res. 2018 Jul 17;37(1):157. doi: 10.1186/s13046-018-0785-4. J Exp Clin Cancer Res. 2018. PMID: 30016965 Free PMC article. - Nanomedicine targets iron metabolism for cancer therapy.
Lin L, Chen H, Zhao R, Zhu M, Nie G. Lin L, et al. Cancer Sci. 2022 Mar;113(3):828-837. doi: 10.1111/cas.15250. Epub 2022 Feb 7. Cancer Sci. 2022. PMID: 34962017 Free PMC article. Review. - Iron: The cancer connection.
Torti SV, Torti FM. Torti SV, et al. Mol Aspects Med. 2020 Oct;75:100860. doi: 10.1016/j.mam.2020.100860. Epub 2020 Apr 25. Mol Aspects Med. 2020. PMID: 32340745 Free PMC article. Review. - Chronic exposure to excess iron promotes EMT and cancer via p53 loss in pancreatic cancer.
Bhutia YD, Ogura J, Grippo PJ, Torres C, Sato T, Wachtel M, Ramachandran S, Babu E, Sivaprakasam S, Rajasekaran D, Schniers B, On N, Smoot L, Thangaraju M, Gnana-Prakasam JP, Ganapathy V. Bhutia YD, et al. Asian J Pharm Sci. 2020 Mar;15(2):237-251. doi: 10.1016/j.ajps.2020.02.003. Epub 2020 Mar 5. Asian J Pharm Sci. 2020. PMID: 32373202 Free PMC article. - Research Progress of Ferroptosis: A Bibliometrics and Visual Analysis Study.
Xiong J, Qi W, Liu J, Zhang Z, Wang Z, Bao J, Wu C, Liang F. Xiong J, et al. J Healthc Eng. 2021 Aug 6;2021:2178281. doi: 10.1155/2021/2178281. eCollection 2021. J Healthc Eng. 2021. PMID: 34413966 Free PMC article.
References
- Abeysinghe RD, Greene BT, Haynes R, Willingham MC, Turner J, Planalp RP, Brechbiel MW, Torti FM, Torti SV. p53-independent apoptosis mediated by tachpyridine, an anti-cancer iron chelator. Carcinogenesis. 2001;22:1607–1614. - PubMed
- An WG, Kanekal M, Simon MC, Maltepe E, Blagosklonny MV, Neckers LM. Stabilization of wild-type p53 by hypoxia-inducible factor 1alpha. Nature. 1998;392:405–408. - PubMed
- Ba Q, Hao M, Huang H, Hou J, Ge S, Zhang Z, Yin J, Chu R, Jiang H, Wang F, et al. Iron deprivation suppresses hepato-cellular carcinoma growth in experimental studies. Clin Cancer Res. 2011;17:7625–7633. - PubMed
Publication types
MeSH terms
Substances
LinkOut - more resources
Full Text Sources
Other Literature Sources
Medical
Molecular Biology Databases
Research Materials
Miscellaneous
