Cytokine-driven loss of plasmacytoid dendritic cell function in chronic lymphocytic leukemia - PubMed (original) (raw)
Cytokine-driven loss of plasmacytoid dendritic cell function in chronic lymphocytic leukemia
D Saulep-Easton et al. Leukemia. 2014 Oct.
Abstract
Chronic lymphocytic leukemia (CLL) is characterized by the accumulation of CD5(+)CD19(+) B cells in the peripheral blood, and in primary and secondary lymphoid organs. A major complication associated with CLL is severe recurrent infections, which are often fatal. Vulnerability to infection is due to a wide variety of immunological defects, yet the initiating events of immunodeficiency in CLL are unclear. Using CLL patient samples and a mouse model of CLL, we have discovered that plasmacytoid dendritic cells (pDCs), which underpin the activity of effector immune cells critical for anti-viral immunity and anti-tumor responses, are reduced in number and functionally impaired in progressive CLL. As a result, the levels of interferon alpha (IFNα) production, a cytokine critical for immunity, are markedly reduced. Lower pDC numbers with impaired IFNα production was due to the decreased expression of FMS-like tyrosine kinase 3 receptor (Flt3) and Toll-like receptor 9 (TLR9), respectively. Reduced Flt3 expression was reversed using inhibitors of TGF-β and TNF, an effect correlating with a reduction in tumor load. Defects in pDC numbers and function offer new insight into mechanisms underpinning the profound immunodeficiency affecting CLL patients and provide a potentially novel avenue for restoring immunocompetency in CLL.
Figures
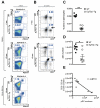
Figure 1. Analysis of splenic and BM pDCs in WT and EμTCL1-Tg mice
(A) Murine splenic pDCs were gated by flow cytometry as CD11b− Gr.1− B220+ CD11c+ SiglecH+ PDCA-1+ as indicated. Representative dot plots show splenic pDCs in WT mice and EμTCL1-Tg mice at 1-mo and 12-mo of age as indicated (n=7 per group). Representative dot plots show BM pDCs from WT and EμTCL1-Tg mice at 12-mo of age (n=7 per group; bottom, left panel). Percentages of gated cells are shown. (B) Dot plots showing CD5+CD19+ B cells in splenocytes from 1-mo and 12-mo old WT and EμTCL1-Tg mice as indicated (n=7 per group). Emergence of CD5+CD19+ tumor B cells in EμTCL1-Tg mice is indicated with an arrow. CD19− CD5− non-B cells correspond to CD3+ T cells. Percentages of gated cells are shown. (C) Proportion of splenic pDCs in 12-mo WT and EμTCL1-Tg mice (n=7 per group). (D) Absolute numbers of splenic pDCs in the spleens of 12-mo WT and EμTCL1-Tg mice (n=7 per group). (E) Correlation between absolute numbers of splenic CD5+CD19+ tumor B cells and pDCs in EμTCL1-Tg mice (n=7) with advanced disease. In C and D horizontal bars indicate the mean. In A-E, data are representative of at least three independent experiments.
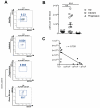
Figure 2. Analysis of pDCs from the peripheral blood and BM of HD and CLL patients
(A) Human pDCs from peripheral blood and BM were gated by flow cytometry as HLA-DR+ CD123+ BDCA2+ BDCA4+ and negative for lineage markers CD3, CD14, CD16, CD19, CD56, CD11c and CD11b. Representative dot plots show pDCs in healthy donor, and patients with indolent and progressive CLL with a representative matched BM sample for the latter patient, as indicated. Percentages of gated cells is shown. (B) Absolute numbers of pDCs per litre in HD (n=12), and patients with indolent (n=14) and progressive (n=12) CLL. (C) Correlation between absolute numbers of CD5+CD19+ B cells and pDCs in progressive CLL patients (n=14). In C, horizontal bars indicate the mean. In A-C, data are representative of at least three independent experiments.
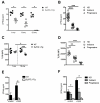
Figure 3. IFNα levels and TLR9 expression in pDCs from EμTCL1-Tg mice and CLL patients
(A) Serum IFNα levels for WT and Eμ-TCL1-Tg mice at 1-mo (n=7 and n= 6, respectively), 6-mo (n= 6 per group) and 12-mo of age (n=6 per group) were measured by ELISA. (B) Serum IFNα levels from HD (n=17), and patients with indolent CLL (n=13) and progressive CLL (n=9). (C) Intracellular expression of TLR9 was measured by flow cytometry in pDCs of WT (n=6) and EμTCL1-Tg mice (n=5) at 1-mo and 12-mo of age. (D) Intracellular expression of TLR9 in pDCs from HD (n=7), and patients with indolent (n=8) and progressive (n=5) CLL. (E) IFNα production in response to in vitro CpG stimulation of splenic pDCs from WT mice (n=6) and EμTCL1-Tg mice (n=6) assessed by ELISA. (F) IFNα production in response to in vitro CpG stimulation of pDCs from HD (n=6), and patients with indolent (n=6) and progressive CLL (n=6). In A-D, horizontal bars indicate the mean. In A-F, data are representative of at least three independent experiments.
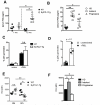
Figure 4. Flt3-Flt3L function in peripheral and BM pDCs of EμTCL1-Tg mice and CLL patients
(A) Serum Flt3L levels for WT and Eμ-TCL1-Tg mice at 1-mo (n=5 and n=3, respectively) and 12-mo of age (n=4 and n=6, respectively) measured by ELISA. (B) Serum Flt3L levels for HD (n=11), and patients with indolent CLL (n=5) and progressive CLL (n=6). (C) BM cells from WT mice and EμTCL1-Tg mice (n=6 per group) at 1-mo and 12-mo of age was cultured for 9-d with or without Flt3L and assessed for pDC generation by flow cytometry as in Figure 1. (D) BM tissue from CLL patients with progressive disease (n=3) was cultured for 9-d with or without Flt3L and assessed for pDC generation by flow cytometry as in Figure 2. (E) Flt3 expression was measured by flow cytometry on freshly isolated pDCs from BM and spleens of WT and EμTCL1-Tg mice (n=6 per group). (F) Flt3 expression on pDCs from peripheral blood of HD (n=3), and patients with indolent (n=7) and progressive (n=5) CLL. In A-F, horizontal bars indicate the mean. In A-F, data are representative of at least two independent experiments.
Figure 5. In vitro stimulation of pDCs from EμTCL1-Tg and CLL patients with Flt3L and CpG
(A) Numbers of pDCs from 5-d cultures of splenocytes from WT and EμTCL1-Tg mice (n=4 per group) were determined by flow cytometry as in Figure 1A. (B) Numbers of pDCs from 4-d cultures of PBMCs from HD, and patients with indolent CLL and progressive CLL (n=6 per group) were determined by flow cytometry as in Figure 2A. (C) pDCs isolated from WT and EμTCL1-Tg mice (n=4 per group) were cultured with or without Flt3L and/or CpG and supernatants assessed for IFNα levels by ELISA (D) IFNa levels in supernatants of pDCs from HD, and patients with indolent CLL and progressive CLL (n=6 per group) cultured with or without Flt3L and/or CpG. In A-D, horizontal bars indicate the mean. In A-D, data are representative of at least two independent experiments.
Figure 6. Increased pDC numbers following TNF or TGF-β inhibition in EμTCL1-Tg mice and CLL patients
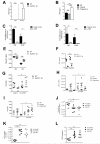
(A) Serum TNF levels in WT and Eμ-TCL1-Tg mice at 1-mo and 12-mo of age (n=3 per group), measured by ELISA. (B) Serum TNF levels from HD (n=7), and patients with indolent CLL (n=4) and progressive CLL (n=5), measured by ELISA. (C) Flt3 and TLR9 mRNA levels in TNF-treated pDCs from EμTCL1-Tg mice and (D) CLL patients. (E) TGF-βR1 expression on BM and splenic pDCs from WT and EμTCL1-Tg mice (n=5 per group, p = 0.0079), measured by flow cytometry as in Figure 1A. (F) pDC numbers and (G) Flt3 expression from 12-h cultures of splenocytes from WT and EμTCL1-Tg mice (n=4 and n=5 per group, p = 0.0075) stimulated with or without anti-TNF in vitro, measured by flow cytometry as in Figure 1A. (H) Enumeration of pDCs by flow cytometry as in Figure 2A, from 12-h cultures of PBMCs from HD (n=5), and patients with indolent CLL (n=6) and progressive CLL (n=4, p = 0.0357). (I) Flt3 expression on cultured pDCs from HD (n=3), and patients with indolent CLL (n=7) and progressive CLL (n=7, p = 0.038) stimulated with or without anti-TNF in vitro, measured by flow cytometry (J) Enumeration of splenic CD5+CD19+ B cells and (K) pDCs by flow cytometry as in Figure 1A and B from EμTCL1-Tg mice with advanced disease, injected twice with 100μg anti-TNF (n=7) or anti-TGF-β (n=6) neutralizing mAbs or isotype control (n=6). (L) Serum IFNα levels for Eμ-TCL1-Tg mice injected twice with 100μg anti-TNF (n=7) or anti-TGF-β (n=6) neutralizing mAbs or isotype control (n=6), measured by ELISA. In A-K, horizontal bars indicate the mean. Data are representative of at least two independent experiments.
Similar articles
- Effects of Toll-like receptor 7 and Toll-like receptor 9 signaling stimulators and inhibitors on chronic lymphocytic leukemia cells ex vivo and their interactions with cladribine.
Wolska A, Cebula-Obrzut B, Smolewski P, Robak T. Wolska A, et al. Leuk Lymphoma. 2013 Jun;54(6):1268-78. doi: 10.3109/10428194.2012.741233. Epub 2012 Nov 20. Leuk Lymphoma. 2013. PMID: 23078646 - The Expression of Toll-Like Receptors in Patients with B-Cell Chronic Lymphocytic Leukemia.
Rybka J, Butrym A, Wróbel T, Jaźwiec B, Bogucka-Fedorczuk A, Poręba R, Kuliczkowski K. Rybka J, et al. Arch Immunol Ther Exp (Warsz). 2016 Dec;64(Suppl 1):147-150. doi: 10.1007/s00005-016-0433-7. Epub 2017 Jan 12. Arch Immunol Ther Exp (Warsz). 2016. PMID: 28083607 Free PMC article. - Toll-like receptor 9 signaling by CpG-B oligodeoxynucleotides induces an apoptotic pathway in human chronic lymphocytic leukemia B cells.
Liang X, Moseman EA, Farrar MA, Bachanova V, Weisdorf DJ, Blazar BR, Chen W. Liang X, et al. Blood. 2010 Jun 17;115(24):5041-52. doi: 10.1182/blood-2009-03-213363. Epub 2010 Mar 25. Blood. 2010. PMID: 20339095 Free PMC article. - T Cells in Chronic Lymphocytic Leukemia: A Two-Edged Sword.
Vlachonikola E, Stamatopoulos K, Chatzidimitriou A. Vlachonikola E, et al. Front Immunol. 2021 Jan 20;11:612244. doi: 10.3389/fimmu.2020.612244. eCollection 2020. Front Immunol. 2021. PMID: 33552073 Free PMC article. Review. - TGF-beta activity and expression of its receptors in B-cell chronic lymphocytic leukemia.
Lagneaux L, Delforge A, Bernier M, Stryckmans P, Bron D. Lagneaux L, et al. Leuk Lymphoma. 1998 Sep;31(1-2):99-106. doi: 10.3109/10428199809057589. Leuk Lymphoma. 1998. PMID: 9720719 Review.
Cited by
- Profound deficiencies in mature blood and bone marrow progenitor dendritic cells in Chronic Lymphocyticcytic Leukemia patients.
Welch BM, Parikh SA, Kay NE, Medina KL. Welch BM, et al. Res Sq [Preprint]. 2024 Sep 27:rs.3.rs-4953853. doi: 10.21203/rs.3.rs-4953853/v1. Res Sq. 2024. PMID: 39399662 Free PMC article. Preprint. - Prognostic biomarker HIF1α and its correlation with immune infiltration in gliomas.
Ding Z, Zhang J, Li L, Wang C, Mei J. Ding Z, et al. Oncol Lett. 2024 Mar 4;27(5):193. doi: 10.3892/ol.2024.14326. eCollection 2024 May. Oncol Lett. 2024. PMID: 38495835 Free PMC article. - Comprehensive analysis of m6A reader YTHDF2 prognosis, immune infiltration, and related regulatory networks in hepatocellular carcinoma.
Wang H, Cai H, Li L. Wang H, et al. Heliyon. 2023 Dec 3;10(1):e23204. doi: 10.1016/j.heliyon.2023.e23204. eCollection 2024 Jan 15. Heliyon. 2023. PMID: 38163150 Free PMC article. - Comparison of the blood immune repertoire with clinical features in chronic lymphocytic leukemia patients treated with chemoimmunotherapy or ibrutinib.
Welch BM, Manso BA, Gwin KA, Lothert PK, Parikh SA, Kay NE, Medina KL. Welch BM, et al. Front Oncol. 2023 Dec 4;13:1302038. doi: 10.3389/fonc.2023.1302038. eCollection 2023. Front Oncol. 2023. PMID: 38111528 Free PMC article. - Comprehensive bioinformatic analysis of mind bomb 1 gene in stomach adenocarcinoma.
Wang D, Wang QH, Luo T, Jia W, Wang J. Wang D, et al. World J Gastrointest Oncol. 2023 Jul 15;15(7):1295-1310. doi: 10.4251/wjgo.v15.i7.1295. World J Gastrointest Oncol. 2023. PMID: 37546549 Free PMC article.
References
- Ternynck T, Dighiero G, Follezou J, Binet JL. Comparison of normal and CLL lymphocyte surface Ig determinants using peroxidase-labeled antibodies. I. Detection and quantitation of light chain determinants. Blood. 1974;43(6):789–95. Epub 1974/06/01. - PubMed
- Harris NL, Jaffe ES, Diebold J, Flandrin G, Muller-Hermelink HK, Vardiman J, et al. The World Health Organization classification of hematological malignancies report of the Clinical Advisory Committee Meeting, Airlie House, Virginia, November 1997. Modern pathology: an official journal of the United States and Canadian Academy of Pathology, Inc. 2000;13(2):193–207. Epub 2000/03/04. - PubMed
- Hallek M, Cheson BD, Catovsky D, Caligaris-Cappio F, Dighiero G, Dohner H, et al. Guidelines for the diagnosis and treatment of chronic lymphocytic leukemia: a report from the International Workshop on Chronic Lymphocytic Leukemia updating the National Cancer Institute-Working Group 1996 guidelines. Blood. 2008;111(12):5446–56. Epub 2008/01/25. - PMC - PubMed
- Abrisqueta P, Pereira A, Rozman C, Aymerich M, Gine E, Moreno C, et al. Improving survival in patients with chronic lymphocytic leukemia (1980-2008): the Hospital Clinic of Barcelona experience. Blood. 2009;114(10):2044–50. Epub 2009/06/26. - PubMed
- Orchard JA, Ibbotson RE, Davis Z, Wiestner A, Rosenwald A, Thomas PW, et al. ZAP-70 expression and prognosis in chronic lymphocytic leukaemia. Lancet. 2004;363(9403):105–11. Epub 2004/01/17. - PubMed
Publication types
MeSH terms
Substances
LinkOut - more resources
Full Text Sources
Other Literature Sources
Molecular Biology Databases
Research Materials
Miscellaneous
