Control of MT1-MMP transport by atypical PKC during breast-cancer progression - PubMed (original) (raw)
. 2014 May 6;111(18):E1872-9.
doi: 10.1073/pnas.1400749111. Epub 2014 Apr 21.
Catalina Lodillinsky, Laetitia Fuhrmann, Maya Nourieh, Pedro Monteiro, Marie Irondelle, Emilie Lagoutte, Sophie Vacher, François Waharte, Perrine Paul-Gilloteaux, Maryse Romao, Lucie Sengmanivong, Mark Linch, Johan van Lint, Graça Raposo, Anne Vincent-Salomon, Ivan Bièche, Peter J Parker, Philippe Chavrier
Affiliations
- PMID: 24753582
- PMCID: PMC4020077
- DOI: 10.1073/pnas.1400749111
Control of MT1-MMP transport by atypical PKC during breast-cancer progression
Carine Rossé et al. Proc Natl Acad Sci U S A. 2014.
Abstract
Dissemination of carcinoma cells requires the pericellular degradation of the extracellular matrix, which is mediated by membrane type 1-matrix metalloproteinase (MT1-MMP). In this article, we report a co-up-regulation and colocalization of MT1-MMP and atypical protein kinase C iota (aPKCι) in hormone receptor-negative breast tumors in association with a higher risk of metastasis. Silencing of aPKC in invasive breast-tumor cell lines impaired the delivery of MT1-MMP from late endocytic storage compartments to the surface and inhibited matrix degradation and invasion. We provide evidence that aPKCι, in association with MT1-MMP-containing endosomes, phosphorylates cortactin, which is present in F-actin-rich puncta on MT1-MMP-positive endosomes and regulates cortactin association with the membrane scission protein dynamin-2. Thus, cell line-based observations and clinical data reveal the concerted activity of aPKC, cortactin, and dynamin-2, which control the trafficking of MT1-MMP from late endosome to the plasma membrane and play an important role in the invasive potential of breast-cancer cells.
Keywords: MMP14; actin cytoskeleton; membrane traffic; multi-vesicular body.
Conflict of interest statement
The authors declare no conflict of interest.
Figures
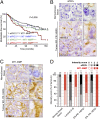
Fig. 1.
Co–up-regulation and colocalization of MT1-MMP and aPKCι in hormone receptor-negative breast tumors correlate with poor prognosis. (A) Metastasis-free survival (MFS) curves for breast-tumor patients with normal (Norm) or overexpressed (Overexp, >3) aPKCι and MT1-MMP mRNA levels (Spearman rank). (B and C) aPKCι (B) and MT1-MMP (C) immunohistochemistry staining on consecutive sections of human breast tumor TMAs showing adjacent nonneoplastic tissue and representative ER− PR− HER2−/triple-negative tumors. Note that adjacent nonneoplastic tissue shown in Top panels correspond to tumor sample shown in Middle panels. Right panels show higher magnification. [Scale bars: 20 μm (Left) and 5 μm (Right).] (D) Intensity scoring of aPKCι (black bars) and MT1-MMP (red bars) immunohistochemistry staining (on a 0-to-3 scale as documented in
Fig. S1 A and B
) of a tissue microarray of human breast tumors representative of the different molecular subtypes and adjacent nonneoplastic areas (Normal breast tissue). Breast molecular subtypes were defined as follows: luminal A+B according to ref. [luminal A, estrogen receptor (ER) ≥ 10%, progesterone receptor (PR) ≥ 20%, Ki67 < 14%; luminal B, ER ≥ 10%, PR < 20%, Ki67 ≥ 14%]; ER− PR− HER2+, ER < 10%, PR < 10%, HER2 2+ amplified or 3+ according to ref. ; ER− PR− HER2− (triple-negative), ER < 10%, PR < 10%, HER2 0/1+ or 2+ nonamplified according to ASCO guidelines (53). n, the number of tumors analyzed. *P < 0.05; ***P < 0.001; ns, non significant compared with normal adjacent tissues (χ2 test). Note that intensity scores of MT1-MMP expression in luminal A+B tumors are inferior to normal tissues.
Fig. 2.
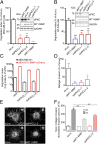
Atypical PKCζ/ι regulate MT1-MMP–dependent matrix degradation and invasion. (A and B) Quantification of FITC–gelatin degradation by MDA-MB-231 (A) and BT-549 cells (B) treated with indicated siRNAs. Values are means ± SEM of the normalized degradation area from at least three independent experiments. (Insets) Immunoblotting with antibodies against aPKCζ/ι and MT1-MMP of cells treated with the indicated siRNAs. Immunoblotting with antibodies against GAPDH served as a control for loading. (C) Quantification of FITC–gelatin degradation by MDA-MB-231 stably expressing MT1-MMP–mCherry treated with the indicated siRNAs (red bars) compared with untransfected MDA-MB-231 cells (black bars). Note the logarithmic scale. (D) MDA-MB-231 cells treated with indicated siRNAs were tested for their ability to invade through Matrigel. Values are means ± SEM normalized to the mean for siLuc-treated cells. *P < 0.05; **P < 0.01. (E) Multicellular spheroids of MDA-MB-231 cells treated with siRNAs against luciferase or aPKCζ/ι (siaPKCζ/ι-2) were embedded in 3D acid-extracted type I collagen (T0) and further incubated for 2 d (T2). Images show phalloidin-labeled spheroids collected at T2 (Insets correspond to spheroids at T0). (Scale bars: 200 μm.) (F) Data are mean invasion area in type I collagen at T2 normalized to the mean invasion area at T0 ± SEM (n = 3 independent experiments; 15–20 spheroids were analyzed for each cell population). ***P < 0.001.
Fig. 3.
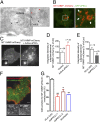
aPKCζ/ι regulate MT1-MMP trafficking to plasma membrane invadopodia. (A) Ultrathin cryosection of MDA-MB-231 cells expressing MT1-MMP–mCherry labeled with MT1-MMP antibody followed by protein A-gold. Red arrows, MT1-MMP in the limiting membrane; black arrows, MT1-MMP associated with intraluminal vesicles of late endosomes/multivesicular bodies (LE/MVB). (Scale bars: 500 nm.) (B) Confocal spinning-disk microscopy image of an MDA-MB-231 cell expressing GFP–aPKCι and MT1-MMP–mCherry. [Scale bars: 5 μm (Left) and 1 μm (Right, boxed region at higher magnification). (C) MDA-MB-231 expressing MT1-MMP–mCherry alone or together with constitutively active aPKCι were imaged by TIRFM. (Insets) Corresponding wide-field images showing equal MT1-MMP expression. (Scale bar: 5 μm.) (D and E) Integrated intensity of MT1-MMP–mCherry signal per unit membrane area measured from TIRFM images. Values represent mean percentage of membrane MT1-MMP normalized to cells expressing only MT1-MMP–mCherry (D) or siLuc-treated cells (E) ± SEM. *P < 0.05; ***P < 0.001. (F) MDA-MB-231 cells expressing MT1-MMP–pHluorin and DsRed-cortactin plated on cross-linked gelatin and analyzed by dual color TIRFM. (Insets) Split signals from the boxed region. (Scale bar: 5 μm.) (G) Plots show the percentage of cells with MT1-MMP–pHluorin–positive invadopodia. Efficiency of cortactin knockdown is shown in Fig. 4_G_. Values are means ± SEM from three independent experiments scoring a total of 150–200 cells for each cell population. **P < 0.01; ***P < 0.001 (compared with cells treated with siLuc siRNA).
Fig. 4.
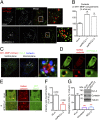
aPKCζ/ι regulates cortactin and dynamin-2 recruitment on MT1-MMP–positive endosomes. (A) MDA-MB-231 cells stably expressing MT1-MMP–mCherry (red) were treated with indicated siRNAs, plated on gelatin, and immunolabeled with an antibody against cortactin (in green). [Scale bars: 5 μm (entire cell) and 1 μm (boxed region at higher magnification, Right panel of each row).] (B) Quantification of cortactin on MT1-MMP–mCherry–containing vesicles in deconvoluted image stacks of MDA-MD-231 cells as in A. The x axis indicates mean cortactin intensity associated with MT1-MMP–mCherry–containing endosomes normalized to the value in control siLuc-treated cells (in percentage) ± SEM (from 50 cells from each cell population). ***P < 0.001. (C) MDA-MB-231 cells expressing MT1-MMP–mCherry (red) were immunolabeled for cortactin (blue) and dyn-2 (green). (Left) The distribution of dyn-2 on the ventral plane of the cell in clathrin-coated pits with partial association with cortactin. (Center) Documents dyn-2’s association with cortactin-positive puncta on MT1-MMP–mCherry vesicles (arrows). (Right) A higher magnification of the boxed region. [Scale bars: 5 μm (Left and Center) and 1 μm (Right)]. (D) Confocal spinning-disk microscopy image of MDA-MB-231 cells expressing GFP–dyn2 and DsRed–cortactin (
Movie S2
). [Scale bars: 5 μm (Upper) and 1 μm (Lower). (E) Dual-color confocal spinning-disk microscopy of MDA-MB-231 cells expressing DsRed–cortactin and GFP–dyn-2 and treated with indicated siRNAs. (Scale bars: 5 μm.) (F) The ratio of signal intensities from GFP–dyn-2 and DsRed–cortactin was measured for 200 and 290 endosomal cortactin patches in cells treated with siRNAs against luciferase or aPKC, respectively. ***P < 0.001. (G) Quantification of gelatin degradation by MDA-MB-231 cells treated with indicated siRNAs. Values are means ± SEM of the normalized degradation area from three independent experiments. (Inset) Immunoblotting with indicated antibodies using tubulin as a control for loading.
Fig. 5.
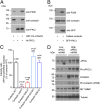
Phosphorylation of cortactin by aPKCι controls dyn-2 association with cytoplasmic cortactin-positive puncta. (A) Purified GST-tagged human cortactin (2 μg) was incubated in the presence (0.5 μg) or absence of recombinant human aPKCι for 20 min at 37 °C. Cortactin phosphorylation was analyzed by immunoblotting with antibodies against cortactin pSer298 phosphopeptide (anti-P298). (B) Lysates of MDA-MB-231 cells expressing DsRed–cortactin alone or together with GFP–aPKCι were analyzed by immunoblotting with antibodies against pSer298 (anti-P298), total cortactin, or GFP. (C) Quantification of dyn-2 on cortactin patches from confocal dual-color spinning-disk images of MDA-MD-231 cells overexpressing GFP–dyn-2 together with DsRed-tagged wild-type cortactin or variants as indicated. The ratios of the signal intensities from dyn-2 and cortactin were measured from n endosome patches. ***P < 0.001; NS, not significant. (D) Whole-cell extracts from breast tumors underexpressing (low) or overexpressing (high) aPKCι mRNA were analyzed by immunoblotting with the indicated antibodies. Tubulin was used as a control for equal loading.
Similar articles
- N-WASP coordinates the delivery and F-actin-mediated capture of MT1-MMP at invasive pseudopods.
Yu X, Zech T, McDonald L, Gonzalez EG, Li A, Macpherson I, Schwarz JP, Spence H, Futó K, Timpson P, Nixon C, Ma Y, Anton IM, Visegrády B, Insall RH, Oien K, Blyth K, Norman JC, Machesky LM. Yu X, et al. J Cell Biol. 2012 Oct 29;199(3):527-44. doi: 10.1083/jcb.201203025. Epub 2012 Oct 22. J Cell Biol. 2012. PMID: 23091069 Free PMC article. - ATAT1/MEC-17 acetyltransferase and HDAC6 deacetylase control a balance of acetylation of alpha-tubulin and cortactin and regulate MT1-MMP trafficking and breast tumor cell invasion.
Castro-Castro A, Janke C, Montagnac G, Paul-Gilloteaux P, Chavrier P. Castro-Castro A, et al. Eur J Cell Biol. 2012 Nov-Dec;91(11-12):950-60. doi: 10.1016/j.ejcb.2012.07.001. Epub 2012 Aug 16. Eur J Cell Biol. 2012. PMID: 22902175 - LIMK Regulates Tumor-Cell Invasion and Matrix Degradation Through Tyrosine Phosphorylation of MT1-MMP.
Lagoutte E, Villeneuve C, Lafanechère L, Wells CM, Jones GE, Chavrier P, Rossé C. Lagoutte E, et al. Sci Rep. 2016 Apr 27;6:24925. doi: 10.1038/srep24925. Sci Rep. 2016. PMID: 27116935 Free PMC article. - Matrix invasion by tumour cells: a focus on MT1-MMP trafficking to invadopodia.
Poincloux R, Lizárraga F, Chavrier P. Poincloux R, et al. J Cell Sci. 2009 Sep 1;122(Pt 17):3015-24. doi: 10.1242/jcs.034561. J Cell Sci. 2009. PMID: 19692588 Review. - Cellular and Molecular Mechanisms of MT1-MMP-Dependent Cancer Cell Invasion.
Castro-Castro A, Marchesin V, Monteiro P, Lodillinsky C, Rossé C, Chavrier P. Castro-Castro A, et al. Annu Rev Cell Dev Biol. 2016 Oct 6;32:555-576. doi: 10.1146/annurev-cellbio-111315-125227. Epub 2016 Aug 8. Annu Rev Cell Dev Biol. 2016. PMID: 27501444 Review.
Cited by
- Heterotrimeric G proteins directly regulate MMP14/membrane type-1 matrix metalloprotease: a novel mechanism for GPCR-EGFR transactivation.
Overland AC, Insel PA. Overland AC, et al. J Biol Chem. 2015 Apr 17;290(16):9941-7. doi: 10.1074/jbc.C115.647073. Epub 2015 Mar 10. J Biol Chem. 2015. PMID: 25759388 Free PMC article. - CLIC4 regulates late endosomal trafficking and matrix degradation activity of MMP14 at focal adhesions in RPE cells.
Hsu KS, Otsu W, Li Y, Wang HC, Chen S, Tsang SH, Chuang JZ, Sung CH. Hsu KS, et al. Sci Rep. 2019 Aug 22;9(1):12247. doi: 10.1038/s41598-019-48438-0. Sci Rep. 2019. PMID: 31439888 Free PMC article. - A new pipeline for pathophysiological analysis of the mammary gland based on organoid transplantation and organ clearing.
Lagoutte E, Villeneuve C, Fraisier V, Krndija D, Deugnier MA, Chavrier P, Rossé C. Lagoutte E, et al. J Cell Sci. 2020 Jun 23;133(12):jcs242495. doi: 10.1242/jcs.242495. J Cell Sci. 2020. PMID: 32467329 Free PMC article. - Antioxidative Impact of Phenolics-Loaded Nanocarriers on Cytoskeletal Network Remodeling of Invasive Cancer Cells.
Jung J, Ku M, Jeong S, Yoon N, Park JH, Youn HS, Yang J, Seo S. Jung J, et al. ACS Appl Mater Interfaces. 2023 Jul 26;15(29):34462-34474. doi: 10.1021/acsami.3c04693. Epub 2023 Jul 12. ACS Appl Mater Interfaces. 2023. PMID: 37438323 Free PMC article. - Circulating Matrix Metalloproteinases for Prediction of Aortic Dilatation in Children with Bicuspid Aortic Valve: A Single-Center, Observational Study.
Făgărășan A, Săsăran MO, Gozar L, Toma D, Șuteu C, Ghiragosian-Rusu S, Al-Akel FC, Szabo B, Huțanu A. Făgărășan A, et al. Int J Mol Sci. 2024 Sep 30;25(19):10538. doi: 10.3390/ijms251910538. Int J Mol Sci. 2024. PMID: 39408865 Free PMC article.
References
- Egeblad M, Werb Z. New functions for the matrix metalloproteinases in cancer progression. Nat Rev Cancer. 2002;2(3):161–174. - PubMed
- Sato H, et al. A matrix metalloproteinase expressed on the surface of invasive tumour cells. Nature. 1994;370(6484):61–65. - PubMed
- Strongin AY, et al. Mechanism of cell surface activation of 72-kDa type IV collagenase: Isolation of the activated form of the membrane metalloprotease. J Biol Chem. 1995;270(10):5331–5338. - PubMed
- Hotary KB, et al. Membrane type I matrix metalloproteinase usurps tumor growth control imposed by the three-dimensional extracellular matrix. Cell. 2003;114(1):33–45. - PubMed
Publication types
MeSH terms
Substances
LinkOut - more resources
Full Text Sources
Other Literature Sources
Medical
Molecular Biology Databases
Miscellaneous
