Age-related macular degeneration: genetics and biology coming together - PubMed (original) (raw)
Review
Age-related macular degeneration: genetics and biology coming together
Lars G Fritsche et al. Annu Rev Genomics Hum Genet. 2014.
Abstract
Genetic and genomic studies have enhanced our understanding of complex neurodegenerative diseases that exert a devastating impact on individuals and society. One such disease, age-related macular degeneration (AMD), is a major cause of progressive and debilitating visual impairment. Since the pioneering discovery in 2005 of complement factor H (CFH) as a major AMD susceptibility gene, extensive investigations have confirmed 19 additional genetic risk loci, and more are anticipated. In addition to common variants identified by now-conventional genome-wide association studies, targeted genomic sequencing and exome-chip analyses are uncovering rare variant alleles of high impact. Here, we provide a critical review of the ongoing genetic studies and of common and rare risk variants at a total of 20 susceptibility loci, which together explain 40-60% of the disease heritability but provide limited power for diagnostic testing of disease risk. Identification of these susceptibility loci has begun to untangle the complex biological pathways underlying AMD pathophysiology, pointing to new testable paradigms for treatment.
Keywords: blindness; complex disease; genetic susceptibility; neurodegeneration; retina.
Figures
Figure 1
(a) Normal retina. (Left) Anatomical depiction of the human eye viewed in sagittal section. Light entering the eye passes through the cornea and is focused by the lens onto the retina. The macula (Latin for “spot”) is a feature of human and most nonhuman primate retinas and lies in the central visual axis. The fovea (Latin for “pit”) is a small region at the center of the macula adapted for high-acuity vision. Two vascular networks—one in the neural retina and the other in the choroid—support the high metabolic demands of the retina. Rod and cone photoreceptors rely principally on the choroidal blood supply. Metabolites destined for the rods and cones are shuttled from the choroid to the photoreceptors by the retinal pigment epithelium. Neuronal impulses generated in the retina are conveyed to the brain by the optic nerve. (Center) Fundus photograph of the retina of a healthy individual. Using an ophthalmoscope, the retina can be evaluated as part of a routine eye exam. The optic nerve, macula, and retinal blood vessels provide ophthalmologists with clues about patients’ ocular health. (Right) Confocal microscopy image of a human retina labeled with fluorescent probes to show the close apposition of photoreceptors, retinal pigment epithelium, Bruch’s membrane, and choroidal blood vessels. Cell nuclei in the outer nuclear layer of photoreceptors are red, photoreceptor outer segments are green, and structures containing high concentrations of filamentous actin (cell–cell junctions and vessel walls) are blue. The inner segments of photoreceptors contain metabolic components, including numerous mitochondria. (b) AMD pathology. (Left,center) Fundus photographs depicting two distinct pathological features of AMD. The photograph on the left shows the characteristic accumulation of drusen, which appear as yellow splotches and flecks within the macula. The photograph in the center shows the unmistakable evidence of hemorrhage beneath the retina resulting from the pathological process of choroidal neovascularization (CNV). The decline in visual function associated with CNV hemorrhage is often rapid and irreversible. (Right) Micrograph showing pathological changes characteristic of AMD, outside the zone of geographic atrophy (GA). Layers of cells and extracellular lesions have been pseudocolored to highlight the extensive disorganization that has occurred at the interfaces between the photoreceptors, the retinal pigment epithelium, Bruch’s membrane, and the choroid. The outer plexiform layer includes synapses of photoreceptors with neurons in the inner retina. Lipid-rich deposits accumulate between the retinal pigment epithelium and Bruch’s membrane (dull yellow), and between the retinal pigment epithelium and photoreceptors (bright yellow). These deposits compromise the delivery of metabolites from the choroid to the photoreceptors and may initiate or exacerbate inflammatory processes, resulting in retinal pigment epithelium and photoreceptor cell death. Adapted in part from Reference 104.
Figure 2
Schematic of human chromosomes showing reported association signals of common (minor allele frequencies ≥1%) and rare variants (minor allele frequencies <1%) for 20 AMD susceptibility loci/genes. Locus names indicate genes that overlap or are close to the observed association signal but do not necessarily represent the underlying disease-causing gene (33, 40,75, 90, 113, 121). The visualization was created using quantsmooth R package version 1.24.0.
Figure 3
Effect sizes and 95% confidence intervals for the 19 common AMD risk variants in the discovery study of the AMD Gene Consortium meta-analysis (33). Box sizes indicate the precision of effect estimates. The 7 loci that were reported with genome-wide significance (P < 5 × 10⁻⁸) for the first time are highlighted in green. Population-based effect allele frequencies are given for European (N = 379), East Asian (N = 286), and West African (N = 244) ancestry groups of the 1000 Genomes Project (phase I v3) (1). rs5749482 for TIMP3 was not available in the 1000 Genomes Project, and effect allele frequencies in this row (indicated by asterisks) are instead given for the highly correlated rs5754227 [_r_2 = 0.92 in CEU (Utah residents with ancestry from northern and western Europe) samples from the International HapMap Project].
Figure 4
Risk scores for individuals in the large Michigan, Mayo, AREDS, Pennsylvania (MMAP) AMD case–control study (7), defined as the product of the number of common risk alleles at each locus and the associated effect size for each allele (measured on the log-odds scale, with each variant conditioned on the other variants). The plot summarizes the ability of these overall genetic risk scores to distinguish late-AMD cases (geographic atrophy and choroidal neovascularization) and controls. Secondary variants—i.e., variants reported to be independently associated within the reported 19 AMD loci—improved discriminatory power (panel a), whereas variants within/near complement genes as well as noncomplement genes contributed to the overall risk score (panel b). Abbreviation: AUC, area under the curve.
Figure 5
Multilocus genotypes and disease risk. A summary of the proportion of affected individuals in each risk decile is shown, with the highest-risk decile on the left. (a) Michigan, Mayo, AREDS, Pennsylvania (MMAP) AMD case–control samples segregated according to the risk of disease predicted by a simple logistic regression model. (b,c) Equivalent predictions at the population level, after assigning different weights to cases and controls and taking into account that the sample is enriched for cases and that the disease prevalence might actually be 2.8% (panel b) or 10.9% (panel c) (method described in Reference 7). (d) Top 10 risk percentiles of a population with 10.9% disease prevalence.
Figure 6
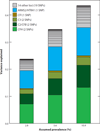
Estimated disease variance explained by 27 common risk genomic variants reported in 19 AMD loci. Relative risks were estimated using the independent risk effects of each variant conditioned on all other variants, assuming disease prevalences of 2.8%, 5.6%, and 10.9%, which correspond to the predicted prevalences of late AMD in European populations at ages 75, 80, and 85 years, respectively (82). Reference describes the methods applied to measure the variance of the disease. Abbreviation: SNP, single-nucleotide polymorphism. favors combinatorial and synergistic mechanisms involving gene or pathway interactions leading to AMD pathogenesis.
Figure 7
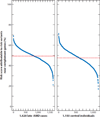
Attributable contributions of variants within or near complement genes to overall risk scores (19 primary and 8 secondary signals) (33) (see also Figure 3) in 1,628 late-AMD cases and 1,150 control individuals from the large Michigan, Mayo, AREDS, Pennsylvania (MMAP) AMD case–control study (7). The dashed red lines indicate the average contributions in cases (49.3%) and controls (47.5%). Individuals were sorted by increasing percentage of their risk score attributable to risk variants near complement genes. Ticks on the x axis represent 100 individuals.
Figure 8
A multi-hit “threshold” model of AMD. Advanced age and environmental factors have an impact on all components (in green) associated with the photoreceptor support system. The assignment of genes to distinct groups is based on published literature and not on functional studies. Each gene group can be associated with a specific function/pathway that may influence one or more components— e.g., alterations in extracellular matrix (ECM)–associated genes can affect both the retinal pigment epithelium (RPE) and Bruch’s membrane. Some of the genetic variants (e.g., those in the complement pathway) are expected to have a stronger impact on specific clinical findings. The cellular changes (in blue) are shown next to (or near) components (in green) that are likely impacted. Some of the changes in one or more components can have a domino effect, leading to pathology phenotypes (red) in AMD. The appearance of late-stage disease [geographic atrophy (GA) or choroidal neovascularization (CNV)] would depend on the acquisition of threshold levels that can be reached by the cumulative effect of multiple hits, including genetic susceptibility, aging-associated changes, and environmental factors.
Similar articles
- Hypothetical LOC387715 is a second major susceptibility gene for age-related macular degeneration, contributing independently of complement factor H to disease risk.
Rivera A, Fisher SA, Fritsche LG, Keilhauer CN, Lichtner P, Meitinger T, Weber BH. Rivera A, et al. Hum Mol Genet. 2005 Nov 1;14(21):3227-36. doi: 10.1093/hmg/ddi353. Epub 2005 Sep 20. Hum Mol Genet. 2005. PMID: 16174643 - Rare Variants in the Functional Domains of Complement Factor H Are Associated With Age-Related Macular Degeneration.
Triebwasser MP, Roberson ED, Yu Y, Schramm EC, Wagner EK, Raychaudhuri S, Seddon JM, Atkinson JP. Triebwasser MP, et al. Invest Ophthalmol Vis Sci. 2015 Oct;56(11):6873-8. doi: 10.1167/iovs.15-17432. Invest Ophthalmol Vis Sci. 2015. PMID: 26501415 Free PMC article. - Multifactor effects and evidence of potential interaction between complement factor H Y402H and LOC387715 A69S in age-related macular degeneration.
Seitsonen SP, Onkamo P, Peng G, Xiong M, Tommila PV, Ranta PH, Holopainen JM, Moilanen JA, Palosaari T, Kaarniranta K, Meri S, Immonen IR, Järvelä IE. Seitsonen SP, et al. PLoS One. 2008;3(12):e3833. doi: 10.1371/journal.pone.0003833. Epub 2008 Dec 2. PLoS One. 2008. PMID: 19048105 Free PMC article. - Molecular Genetic Mechanisms in Age-Related Macular Degeneration.
Shughoury A, Sevgi DD, Ciulla TA. Shughoury A, et al. Genes (Basel). 2022 Jul 12;13(7):1233. doi: 10.3390/genes13071233. Genes (Basel). 2022. PMID: 35886016 Free PMC article. Review. - Genomic aspects of age-related macular degeneration.
Horie-Inoue K, Inoue S. Horie-Inoue K, et al. Biochem Biophys Res Commun. 2014 Sep 19;452(2):263-75. doi: 10.1016/j.bbrc.2014.08.013. Epub 2014 Aug 8. Biochem Biophys Res Commun. 2014. PMID: 25111812 Review.
Cited by
- 7-ketocholesterol induces endothelial-mesenchymal transition and promotes fibrosis: implications in neovascular age-related macular degeneration and treatment.
Wang H, Ramshekar A, Kunz E, Hartnett ME. Wang H, et al. Angiogenesis. 2021 Aug;24(3):583-595. doi: 10.1007/s10456-021-09770-0. Epub 2021 Feb 28. Angiogenesis. 2021. PMID: 33646466 Free PMC article. - NEI-Supported Age-Related Macular Degeneration Research: Past, Present, and Future.
Wright C, Mazzucco AE, Becker SM, Sieving PA, Tumminia SJ. Wright C, et al. Transl Vis Sci Technol. 2020 Jun 30;9(7):49. doi: 10.1167/tvst.9.7.49. eCollection 2020 Jun. Transl Vis Sci Technol. 2020. PMID: 32832254 Free PMC article. - Genetic Insights into Age-Related Macular Degeneration.
Bhumika, Bora NS, Bora PS. Bhumika, et al. Biomedicines. 2024 Jul 4;12(7):1479. doi: 10.3390/biomedicines12071479. Biomedicines. 2024. PMID: 39062052 Free PMC article. Review. - Protein therapeutics and their lessons: Expect the unexpected when inhibiting the multi-protein cascade of the complement system.
Schmidt CQ, Smith RJH. Schmidt CQ, et al. Immunol Rev. 2023 Jan;313(1):376-401. doi: 10.1111/imr.13164. Epub 2022 Nov 18. Immunol Rev. 2023. PMID: 36398537 Free PMC article. Review. - Decreased Circulating Very Small Low-Density Lipoprotein is Likely Causal for Age-Related Macular Degeneration.
Farashi S, Bonelli R, Jackson VE, Ansell BRE, Guymer RH, Bahlo M. Farashi S, et al. Ophthalmol Sci. 2024 Apr 22;4(5):100535. doi: 10.1016/j.xops.2024.100535. eCollection 2024 Sep-Oct. Ophthalmol Sci. 2024. PMID: 39091897 Free PMC article.
References
- Awh CC, Lane AM, Hawken S, Zanke B, Kim IK. CFH and ARMS2 genetic polymorphisms predict response to antioxidants and zinc in patients with age-related macular degeneration. Ophthalmology. 2013;120:2317–2323. - PubMed
Publication types
MeSH terms
Substances
Grants and funding
- EY022005/EY/NEI NIH HHS/United States
- R01 EY006109/EY/NEI NIH HHS/United States
- EY06109/EY/NEI NIH HHS/United States
- R01 EY023164/EY/NEI NIH HHS/United States
- ImNIH/Intramural NIH HHS/United States
- EY023164/EY/NEI NIH HHS/United States
- R01 EY022005/EY/NEI NIH HHS/United States
LinkOut - more resources
Full Text Sources
Other Literature Sources
Medical
Miscellaneous


