Mechanisms promoting escape from mitotic stress-induced tumor cell death - PubMed (original) (raw)
Mechanisms promoting escape from mitotic stress-induced tumor cell death
Rebecca Sinnott et al. Cancer Res. 2014.
Abstract
Non-small cell lung cancer (NSCLC) is notorious for its paltry responses to first-line therapeutic regimens. In contrast to acquired chemoresistance, little is known about the molecular underpinnings of the intrinsic resistance of chemo-naïve NSCLC. Here we report that intrinsic resistance to paclitaxel in NSCLC occurs at a cell-autonomous level because of the uncoupling of mitotic defects from apoptosis. To identify components that permit escape from mitotic stress-induced death, we used a genome-wide RNAi-based strategy, which combines a high-throughput toxicity screen with a live-cell imaging platform to measure mitotic fate. This strategy revealed that prolonging mitotic arrest with a small molecule inhibitor of the APC/cyclosome could sensitize otherwise paclitaxel-resistant NSCLC. We also defined novel roles for CASC1 and TRIM69 in supporting resistance to spindle poisons. CASC1, which is frequently co-amplified with KRAS in lung tumors, is essential for microtubule polymerization and satisfaction of the spindle assembly checkpoint. TRIM69, which associates with spindle poles and promotes centrosomal clustering, is essential for formation of a bipolar spindle. Notably, RNAi-mediated attenuation of CASC1 or TRIM69 was sufficient to inhibit tumor growth in vivo. On the basis of our results, we hypothesize that tumor evolution selects for a permissive mitotic checkpoint, which may promote survival despite chromosome segregation errors. Attacking this adaptation may restore the apoptotic consequences of mitotic damage to permit the therapeutic eradication of drug-resistant cancer cells.
©2014 American Association for Cancer Research.
Figures
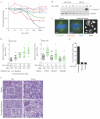
Figure 1
(A) Paclitaxel dose curves in indicated NSCLC cell lines. Each point is the mean ± Standard Error of the Mean (SEM) for 3 independent experiments. (B) Whole cell lysates (WCLs) from HCC366 and H1155 exposed to paclitaxel for 48 hours were immunoblotted as indicated. (C) Immunostaining of HCC366 cells treated for 24 hours. Arrowheads indicate micronucleated cells. Scale = 5 μm or 15 μm (right panel). (D) Single-cell lineage tracing of HCC366 cells stably expressing GFP-H2B (HCC366-GFP-H2B) for 48 hours post-paclitaxel exposure. Each circle represents a single cell. Bar is mean mitotic transit time, which is also indicated. Right panel: Cells were transfected with indicated siRNAs for 48 hours prior to drug exposure. (E) Quantitation of single-cell lineage tracing of HCC366-GFP-H2B micronucleates post exposure to 10 nM paclitaxel. Bars represent mean ± range for 100 cells over 2 experiments. (F) H&E staining of HCC366 subcutaneous tumor xenografts treated as indicated. Arrowheads specify micronucleated cells. Scale = 40 μm. Zoomed images are of white boxed area.
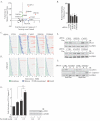
Figure 2
(A) Graph of relative mitotic transit time (y) vs. relative caspase-3/7 activity (APO-ONE®) in HCC366 cells exposed to paclitaxel. A subset of siRNA gene targets is indicated. (B) Colony formation assay in HCC366s exposed to 10 nM paclitaxel for 48 hours. Bars represent mean ± SEM from n=3 independent experiments. (C) HCC366-GFP-H2B cells were transfected with indicated siRNAs for 48 hours followed by exposure to 10 nM paclitaxel. Live cell imaging commenced with paclitaxel treatment and single-cell lineage traces of 50 cells from 2 independent experiments were measured. (D) As in C, but in the presence of siMAD2. (E) WCLs from HCC366 cells transfected for 48 hours followed by exposure to vehicle or 10 nM paclitaxel for 48 hours were immunoblotted with indicated antibodies. (F) WCLs from non-tumorigenic HBEC3KT (N) and HCC366 (T) cells treated as in 2E were immunoblotted with indicated antibodies. (G) Left panel: Relative cleaved caspase-3/7 activity (APO-ONE®) in HCC366s treated with vehicle, 10 nM paclitaxel or 2.5 μM proTAME for 24 hours. Bars represent mean ± SEM for n=9 independent experiments. ** P <0.01 *** P < 0.0001 (unpaired two-tailed student's t-test). Right panel: Immunoblot of WCLs of HCC366s treated as in left panel.
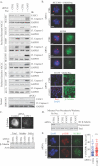
Figure 3
(A) WCLs of NSCLC cells immunoblotted with indicated antibodies following siRNA transfection for 48 hours and subsequent treatment as indicated for 48 hours. siPLK1 was used as a positive control for cleaved caspase-3 detection in HBEC3KT cells. (B) As in A, except paclitaxel treatment was 24 hours prior to immunostaining. Scale = 5 μm. (C) Top panel: H1299 cells were transfected for 72 hours with indicated siRNAs followed by glutaraldehyde fix and immunostained. Scale =15 μm. Bottom panel: Immunoblots of H1299 cells following an in vivo polymerized tubulin assay (D) In vivo polymerized tubulin assay in H1299 cells transfected for 72 hours. Lysates were immunoblotted with indicated antibodies. (E) HCC366 cells treated as in B, were fixed in cold methanol and immunostained as indicated. Scale = 5 μm. BUBR1 foci were counted by manual inspection in 60 cells per experiment in 3 independent experiments. Bar indicates mean. *** P < 0.001, Mann-Whitney t-test.
Figure 4
(A&B) As in 3A&B. Scale bars = 10 μm for A549 and H1299, 5 μm for HCC366. (C) As in 3E. ** P <0.05.
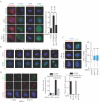
Figure 5
(A) HeLa cells transfected with indicated cDNAs for 48 hours were fixed and immunostained. Scale = 5μm. Right panel: Quantitation of cells from (A). Bars represent mean ± range for n=2 independent experiments. (B) Immunostaining of H1299-myc-TRIM69A representing each stage in the cell cycle based on nuclear morphology. Scale bar = 5 μm. (C) H1299 cells stably expressing myc-TRIM69A were transfected with indicated siRNA for 72 hours and immunostained with indicated antibodies. Plots represent relative fluorescence of myc-TRIM69A at centrosomes in > 150 cells across 3 independent experiments. *** P <0.0001 by two-tailed Mann Whitney test. Scale = 5 μm. (D) Left panel: H1299 cells were immunostained with indicated antibodies following siRNA transfection for 72 hours. Scale = 5 μm. Middle panel: Quantitation of cells from (D). Bars represent mean ± range from 2 independent experiments. Right panel: Bars represent mean mRNA expression levels of HAUS1 72 hours post-transfection.
Figure 6
(A) Bars represent mean mRNA expression levels ± range of CASC1 and TRIM69 in HCC366 cells expressing indicated hairpins from 2 independent infections. (B) Tumor growth curves for mice harboring HCC366s expressing indicated shRNAs. shGFP n=9, shCASC1 n=9 and shTRIM69 n=7. Mean ± standard deviation (SD). (C) Tumors expressing indicated short hairpins were excised 96 days following injection. Left panel: Bars represent mean mass of tumors ± SEM; shGFP n=7, shCASC1 n=10, shTRIM69 n=8. Right: Representative images of excised tumors. (D) Tumors from (B) were sectioned and H&E stained. Left: Quantitation of micronucleated cells in tumor sections. 6 independent tumors were examined for each indicated shRNA. Right: Representative images of H&E stained tumor sections. Scale = 50 μm. White arrowheads indicate micronucleated cells. Blue arrowheads indicate aberrant mitotic cells. (E) Tumors from (B) were sectioned and TUNEL stained. Bars indicate mean TUNEL positive cells ± SEM from 6 tumors for each shRNA condition. For all panels, ** P <0.01. *** P < 0.0001 (unpaired two-tailed student's t-test).
Similar articles
- DT-13 synergistically enhanced vinorelbine-mediated mitotic arrest through inhibition of FOXM1-BICD2 axis in non-small-cell lung cancer cells.
Li H, Sun L, Li H, Lv X, Semukunzi H, Li R, Yu J, Yuan S, Lin S. Li H, et al. Cell Death Dis. 2017 May 25;8(5):e2810. doi: 10.1038/cddis.2017.218. Cell Death Dis. 2017. PMID: 28542137 Free PMC article. - Antagonizing the spindle assembly checkpoint silencing enhances paclitaxel and Navitoclax-mediated apoptosis with distinct mechanistic.
Henriques AC, Silva PMA, Sarmento B, Bousbaa H. Henriques AC, et al. Sci Rep. 2021 Feb 18;11(1):4139. doi: 10.1038/s41598-021-83743-7. Sci Rep. 2021. PMID: 33603057 Free PMC article. - Synthetic lethal screen identification of chemosensitizer loci in cancer cells.
Whitehurst AW, Bodemann BO, Cardenas J, Ferguson D, Girard L, Peyton M, Minna JD, Michnoff C, Hao W, Roth MG, Xie XJ, White MA. Whitehurst AW, et al. Nature. 2007 Apr 12;446(7137):815-9. doi: 10.1038/nature05697. Nature. 2007. PMID: 17429401 - Using Budding Yeast to Identify Molecules That Block Cancer Cell 'Mitotic Slippage' Only in the Presence of Mitotic Poisons.
Schuyler SC, Chen HY. Schuyler SC, et al. Int J Mol Sci. 2021 Jul 26;22(15):7985. doi: 10.3390/ijms22157985. Int J Mol Sci. 2021. PMID: 34360748 Free PMC article. Review. - Perturbing mitosis for anti-cancer therapy: is cell death the only answer?
Haschka M, Karbon G, Fava LL, Villunger A. Haschka M, et al. EMBO Rep. 2018 Mar;19(3):e45440. doi: 10.15252/embr.201745440. Epub 2018 Feb 19. EMBO Rep. 2018. PMID: 29459486 Free PMC article. Review.
Cited by
- The RanGTP Pathway: From Nucleo-Cytoplasmic Transport to Spindle Assembly and Beyond.
Cavazza T, Vernos I. Cavazza T, et al. Front Cell Dev Biol. 2016 Jan 11;3:82. doi: 10.3389/fcell.2015.00082. eCollection 2015. Front Cell Dev Biol. 2016. PMID: 26793706 Free PMC article. Review. - RNF20 Regulates Oocyte Meiotic Spindle Assembly by Recruiting TPM3 to Centromeres and Spindle Poles.
Wang L, Liu C, Li L, Wei H, Wei W, Zhou Q, Chen Y, Meng TG, Jiao R, Wang ZB, Sun QY, Li W. Wang L, et al. Adv Sci (Weinh). 2024 Apr;11(13):e2306986. doi: 10.1002/advs.202306986. Epub 2024 Jan 19. Adv Sci (Weinh). 2024. PMID: 38240347 Free PMC article. - Intricate confrontation: Research progress and application potential of TRIM family proteins in tumor immune escape.
Gu J, Chen J, Xiang S, Zhou X, Li J. Gu J, et al. J Adv Res. 2023 Dec;54:147-179. doi: 10.1016/j.jare.2023.01.011. Epub 2023 Feb 2. J Adv Res. 2023. PMID: 36736694 Free PMC article. Review. - Single B Cell Gene Co-Expression Networks Implicated in Prognosis, Proliferation, and Therapeutic Responses in Non-Small Cell Lung Cancer Bulk Tumors.
Ye Q, Guo NL. Ye Q, et al. Cancers (Basel). 2022 Jun 25;14(13):3123. doi: 10.3390/cancers14133123. Cancers (Basel). 2022. PMID: 35804895 Free PMC article. - Targeting mitotic exit in solid tumors.
Greil C, Felthaus J, Follo M, Ihorst G, Ewerth D, Schüler J, Schnerch D, Duyster J, Engelhardt M, Wäsch R. Greil C, et al. Am J Cancer Res. 2021 Jul 15;11(7):3698-3710. eCollection 2021. Am J Cancer Res. 2021. PMID: 34354869 Free PMC article.
References
- Jordan MA, Kamath K. How do microtubule-targeted drugs work? An overview. Curr Cancer Drug Targets. 2007;7(8):730–42. - PubMed
- Schiller JH, Harrington D, Belani CP, Langer C, Sandler A, Krook J, et al. Comparison of four chemotherapy regimens for advanced non-small-cell lung cancer. N Engl J Med. 2002;346(2):92–8. - PubMed
- Ichiki M, Kawasaki M, Takayama K, Ninomiya K, Kuba M, Iwami F, et al. A multicenter phase II study of carboplatin and paclitaxel with a biweekly schedule in patients with advanced non-small-cell lung cancer: Kyushu thoracic oncology group trial. Cancer Chemother Pharmacol. 2006;58(3):368–73. - PubMed
- Peters JM. The anaphase promoting complex/cyclosome: a machine designed to destroy. Nature reviews Molecular cell biology. 2006;7(9):644–56. - PubMed
- Yu H. Regulation of APC-Cdc20 by the spindle checkpoint. Curr Opin Cell Biol. 2002;14(6):706–14. - PubMed
Publication types
MeSH terms
Substances
Grants and funding
- CA154699/CA/NCI NIH HHS/United States
- CA071341-14/CA/NCI NIH HHS/United States
- CA128926/CA/NCI NIH HHS/United States
- R01 CA154699/CA/NCI NIH HHS/United States
- T32 GM007040/GM/NIGMS NIH HHS/United States
- T32 CA071341/CA/NCI NIH HHS/United States
- K99 CA128926/CA/NCI NIH HHS/United States
- R00 CA128926/CA/NCI NIH HHS/United States
- T32GM007040-37/GM/NIGMS NIH HHS/United States
LinkOut - more resources
Full Text Sources
Other Literature Sources
Medical
Miscellaneous


