ER-mitochondria associations are regulated by the VAPB-PTPIP51 interaction and are disrupted by ALS/FTD-associated TDP-43 - PubMed (original) (raw)
Kurt J De Vos 2, Sébastien Paillusson 3, Sarah Mueller 3, Rosa M Sancho 1, Kwok-Fai Lau 4, Gema Vizcay-Barrena 5, Wen-Lang Lin 6, Ya-Fei Xu 6, Jada Lewis 6, Dennis W Dickson 6, Leonard Petrucelli 6, Jacqueline C Mitchell 7, Christopher E Shaw 7, Christopher C J Miller 3
Affiliations
- PMID: 24893131
- PMCID: PMC4046113
- DOI: 10.1038/ncomms4996
Free PMC article
ER-mitochondria associations are regulated by the VAPB-PTPIP51 interaction and are disrupted by ALS/FTD-associated TDP-43
Radu Stoica et al. Nat Commun. 2014.
Free PMC article
Abstract
Mitochondria and the endoplasmic reticulum (ER) form tight structural associations and these facilitate a number of cellular functions. However, the mechanisms by which regions of the ER become tethered to mitochondria are not properly known. Understanding these mechanisms is not just important for comprehending fundamental physiological processes but also for understanding pathogenic processes in some disease states. In particular, disruption to ER-mitochondria associations is linked to some neurodegenerative diseases. Here we show that the ER-resident protein VAPB interacts with the mitochondrial protein tyrosine phosphatase-interacting protein-51 (PTPIP51) to regulate ER-mitochondria associations. Moreover, we demonstrate that TDP-43, a protein pathologically linked to amyotrophic lateral sclerosis and fronto-temporal dementia perturbs ER-mitochondria interactions and that this is associated with disruption to the VAPB-PTPIP51 interaction and cellular Ca(2+) homeostasis. Finally, we show that overexpression of TDP-43 leads to activation of glycogen synthase kinase-3β (GSK-3β) and that GSK-3β regulates the VAPB-PTPIP51 interaction. Our results describe a new pathogenic mechanism for TDP-43.
Figures
Figure 1. Binding of VAPB to PTPIP51 requires its complete cytosolic domain.
(a) Cells were transfected with either control empty vector (CTRL) or HA-tagged PTPIP51 and the lysates then used in GST pull-down assays with either GST, GST-VAPB1-124 (the MSP domain), GST-VAPB89-207, GST-VAPB142-207 (containing the coiled-coil domain) or GST-VAPB1-220 (the entire cytosolic domain) ‘baits’. PTPIP51 only bound GST-VAPB1-220. Upper shows immunoblot of both lysates and GST pulldowns probed for PTPIP51 via the HA tag; lower shows Poncea red-stained blot of GST ‘baits’. (b) VAPB and PTPIP51 cytosolic domains bind directly in vitro. PTPIP51 cytosolic domain (amino acids 36–470) produced in E. coli was incubated with either GST or GST-VAPB1-220 (the entire cytosolic domain) and bound PTPIP51 detected by immunoblotting. Upper shows input and either GST or GST-VAPB1-220 pulldown; lower shows Coomassie blue-stained gel of GST ‘baits’.
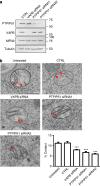
Figure 2. siRNA knockdown of VAPB or PTPIP51 reduces ER–mitochondria associations in NSC34 cells.
(a) Immunoblots showing siRNA knockdown of VAPB and PTPIP51. siRNA knockdown of VAPB does not affect expression of PTPIP51, siRNA knockdown of PTPIP51 does not affect expression of VAPB and siRNA knockdown of either VAPB or PTPIP51 does not affect expression of mitofusin-2 (MFN2). Also shown is an immunoblot of tubulin as a loading control. (b) Representative electron micrographs of ER–mitochondria associations in untreated cells and control (CTRL), VAPB or PTPIP51 siRNA-treated cells; arrowheads with loops show regions of association. Scale bar, 100 nm. Bar chart shows % of the mitochondrial surface closely apposed to ER in the different samples. Data were analysed by one-way analysis of variance followed by Tukey’s multiple comparison test. _N_=27–35 cells and 279–374 mitochondria; error bars are s.e.m.; ***P<0.001.
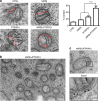
Figure 3. Overexpression of VAPB and/or PTPIP51 increases ER–mitochondria associations in NSC34 cells.
(a) Representative electron micrographs of ER–mitochondria associations in cells transfected with control ECFP vector (CTRL), ECFP-VAPB (VAPB), PTPIP51 (PTPIP51) or ECFP-VAPB+PTPIP51; arrowheads with loops show regions of association. (b) Low-magnification electron micrograph of cells co-transfected with VAPB and PTPIP51 to show numerous mitochondria with closely apposed ER. (c) With a zoom view; ER–mitochondria contacts in VAPB+PTPIP51 co-transfected cells showing tight associations of ER and mitochondria (Mit) as indicated with putative connections (arrowheads) linking ER with the outer mitochondrial membrane. Bar chart in a shows % of the mitochondrial surface closely apposed to ER in the different samples. Data were analysed by one-way analysis of variance followed by Tukey’s multiple comparison test. _N_=30–32 cells and 376–483 mitochondria; error bars are s.e.m.; *P<0.05, ***P<0.001. Scale bars, 100 nm in (a) 500 nm in (b) and 30 nm in (c) zoom.
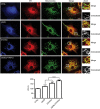
Figure 4. Overexpression of VAPB and/or PTPIP51 increases ER–mitochondria associations in CV-1 cells.
Confocal immunostaining of CV-1 cells transfected with control ECFP vector (CTRL; blue), ECFP-VAPB (VAPB; blue), PTPIP51-HA (PTPIP51; blue) or ECFP-VAPB+PTPIP51-HA (VAPB+PTPIP51) and immunostained for ER (using mouse PDI antibody) and mitochondria (using rabbit TOM-20) as indicated. In VAPB+PTPIP51 co-transfected cells, only ECFP-VAPB (blue) labelling is shown but duplicate coverslips were immunostained for ECFP-VAPB and PTPIP51-HA, and this demonstrated that ~95% of cells expressed both transfected proteins. These data are consistent with many previous reports, which show that most co-transfected cells express both plasmids (for example, ref. 59) Merge is of ER and mitochondria labelling only; the zoom view shows co-localized pixels. Scale bar, 20 μm. Bar chart shows intensity correlation quotient (ICQ) values (with ECFP control represented as 100%) in the different transfections. Data were analysed by one-way analysis of variance with Tukey’s post hoc test. _N_=34–52 cells; error bars are s.e.m.; ***P<0.001.
Figure 5. Expression of TDP-43 reduces ER–mitochondria associations.
(a) Representative electron micrographs of ER–mitochondria associations in NSC34 cells transfected with control EGFP vector (CTRL), EGFP-TDP-43, EGFP-TDP-43M337V, EGFP-TDP-43Q331K, EGFP-TDP-43A382T or EGFP-TDP-43G348C as indicated; arrowheads with loops show regions of association. Scale bar, 100 nm. Bar chart shows % of the mitochondrial surface closely apposed to ER in the different samples. Data were analysed by one-way analysis of variance followed by Tukey’s multiple comparison test. _N_=30–35 cells and 352–481 mitochondria; error bars are s.e.m.; ***P<0.001. (b) Expression of wild-type or disease-associated mutant TDP-43 does not alter expression of VAPB, PTPIP51 or mitofusin-2 (MFN2). Immunoblots of NSC34 cells transfected with EGFP as a control (CTRL), or wild-type or mutant EGFP-TDP-43 as indicated. Transfected cells were purified via EGFP using a cell sorter and the samples probed on immunoblots as indicated. On TDP-43 immunoblot, upper species is transfected and lower species endogenous TDP-43; actin is shown as a loading control. (c) Representative electron micrographs of ER–mitochondria associations in motor neurons of TDP-43 transgenic mice and their non-transgenic littermates; arrowheads with loops show regions of association. Scale bar, 200 nm. Bar chart shows % of the mitochondrial surface closely apposed to ER in the two samples. Data were analysed by the unpaired_t_-test. _N_=67–88 cells and 438–749 mitochondria; error bars are s.e.m.; ***P<0.001.
Figure 6. siRNA loss of TDP-43 does not affect binding of PTPIP51 to VAPB or ER–mitochondria associations in NSC34 cells.
(a) Loss of TDP-43 does not affect the binding of PTPIP51 to VAPB. Cells were transfected with empty vector (EV), PTPIP51-HA or PTPIP51-HA+either control (CTRL) or TDP-43 siRNAs (mixture of two siRNAs). PTPIP51 was immunoprecipitated using the HA tag and the amounts of endogenous bound VAPB detected by immunoblotting. No signals were obtained for either VAPB or PTPIP51 in immunoprecipitations from EV-transfected cells, which demonstrates the specificity of the immunoprecipitations. Both inputs and immunoprecipitations (IP) are shown. Data analysed by one-way analysis of variance; _N_=3. (b) Representative electron micrographs of ER–mitochondria associations in control (CTRL) and TDP-43 siRNA-treated cells. Arrowheads with loops show regions of association. Scale bar, 100 nm. Data were analysed by the unpaired _t_-test._N_=31 cells each for both control and TDP-43 siRNAs, and 252 and 283 mitochondria.
Figure 7. Expression of TDP-43 reduces the binding of VAPB to PTPIP51 in both transfected cells and transgenic mice.
(a,b) Cells were transfected with either empty vector (EV) or co-transfected with PTPIP51-HA and either EGFP control vector (CTRL) or wild-type or ALS/FTD mutants of TDP-43 (TDP-43M337V, TDP-43Q331K, TDP-43A382T and TDP-43G348C). PTPIP51 was immunoprecipitated using the HA tag and the amounts of endogenous bound VAPB detected by immunoblotting. No signals were obtained for either VAPB or PTPIP51 in immunoprecipitations from EV-transfected cells, which demonstrates the specificity of the immunoprecipitations. Both inputs and immunoprecipitations (IP) are shown. The bar chart shows relative levels of VAPB bound to PTPIP51 in the immunoprecipitations following quantification of signals from immunoblots. VAPB signals were normalized to immunoprecipitated PTPIP51-HA signals. (a) Shows data for NSC34 cells; _N_=3. (b) Shows data for HEK293 cells; _N_=5. Data were analysed by one-way analysis of variance and Tukey’s post hoc test; error bars are s.e.m., *P<0.05, **P<0.01. (c) VAPB binds to PTPIP51 in mouse spinal cords. VAPB was immunoprecipitated using rabbit anti-VAPB and detected on immunoblots using rat anti-VAPB; bound PTPIP51 was detected using rat PTPIP51. Both inputs and immunoprecipitations (IP) are shown. Control immunoprecipitations were performed using no primary antibody (−Ab) or preimmune rabbit serum (CTRL). (d) Reduced binding of VAPB to PTPIP51 in TDP-43 transgenic mice. Immunoprecipitations were performed as in c from three non-transgenic (NTg) and three TDP-43 transgenic mice. Also shown are immunoblots for TDP-43, mitofusin-2 (MFN2) and actin as a loading control in the spinal cords. Bar chart shows relative levels of PTPIP51 bound to VAPB in the immunoprecipitations following quantification of signals from immunoblots. PTPIP51 signals were normalized to immunoprecipitated VAPB signals. Data were analysed by the unpaired_t_-test; error bars are s.e.m., **P<0.01.
Figure 8. Expression of TDP-43 disrupts cellular Ca2+ homeostasis.
HEK293 cells were transfected with M3R and either control empty vector (CTRL), TDP-43, TDP-43M337V, TDP-43Q331K, TDP-43A382T or TDP-43G348C as indicated. Release of ER Ca2+ was induced by treatment of cells with Oxotremorine-M (OxoM). (a) shows cytosolic Ca2+ levels with representative Fluo4 fluorescence traces on the left and normalized peak values on the right. Fluo4 fluorescence shows a transient increase in cytosolic Ca2+ levels upon OxoM treatment but compared with control, wild-type and mutant TDP-43 all increase peak cytosolic Ca2+ levels. (b) shows mitochondrial Ca2+ levels with representative Rhod2 fluorescence traces on the left and normalized peak values on the right. Data were analysed by one-way analysis of variance and Tukey’s post hoc test. (a)_N_=48–52 cells from 3–5 experiments; (b) _N_=48–52 cells from 3–4 experiments. *P<0.05, ***P<0.001; error bars are s.e.m.
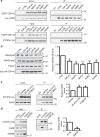
Figure 9. TDP-43 activates GSK-3β, and modulating GSK-3β activity regulates the VAPB–PTPIP51 interaction.
(a) Immunoprecipitation assays of TDP-43 with VAPB and PTPIP51. HEK293 cells were transfected with either VAPB (upper) or PTPIP51 (lower) and either control empty vector (EV) or EGFP-tagged TDP-43, TDP-43M337V, TDP-43Q331K, TDP-43A382T or TDP-43G348C. VAPB and PTPIP51 were immunoprecipitated via their myc or HA tags and the samples probed for co-immunoprecipitating TDP-43 on immunoblots. (b) TDP-43 activates GSK-3β. HEK293 cells were transfected with either control empty vector (CTRL), TDP-43, TDP-43M337V, TDP-43Q331K, TDP-43A382T or TDP-43G348C and the samples probed on immunoblots for total GSK-3β and GSK-3β phosphorylated on serine-9. Phosphorylation of GSK-3β serine-9 is the principal mechanism for regulating its activity; serine-9 phosphorylation inhibits GSK-3β activity. Bar chart shows relative levels of GSK-3β serine-9 phosphorylation following quantification of signals from immunoblots and normalization to total GSK-3β signals. Data were analysed by one-way analysis of variance (ANOVA) and Tukey’s post hoc test._N_=5; *P<0.05, **P<0.01,***P<0.001; error bars are s.e.m.. (c) Inhibition of GSK-3β increases the amount of VAPB bound to PTPIP51. Cells were transfected with control empty vector (EV) or HA-tagged PTPIP51 and treated with either vehicle, GSK-3β inhibitor AR-A014418 (1 μM) or GSK-3β inhibitor CT99021 (100 nM) for 16 h. PTPIP51 was immunoprecipitated using the HA tag and the amounts of endogenous bound VAPB detected by immunoblotting. Both inputs and immunoprecipitations (IP) are shown. Bar chart shows relative levels of VAPB bound to PTPIP51 in the immunoprecipitations following quantification of signals from immunoblots. VAPB signals were normalized to immunoprecipitated PTPIP51-HA signals. Data were analysed by one-way ANOVA and Tukey’s post hoc test; _N_=3, error bars are s.e.m., *P<0.05. (d) Transfection of GSK-3β decreases the amount of VAPB bound to PTPIP51. Cells were transfected with empty vector (EV), HA-PTPIP51 or HA-PTPIP51+GSK-3β. PTPIP51 was immunoprecipitated using the HA tag and the amounts of endogenous bound VAPB detected by immunoblotting. Both inputs and immunoprecipitations (IP) are shown. Bar chart shows relative levels of VAPB bound to PTPIP51 in the immunoprecipitations following quantification of signals from immunoblots. VAPB signals were normalized to immunoprecipitated PTPIP51 signals. Data were analysed by the unpaired_t_-test; _N_=3, error bars are s.e.m., *P<0.05.
Similar articles
- Depressing time: Waiting, melancholia, and the psychoanalytic practice of care.
Salisbury L, Baraitser L. Salisbury L, et al. In: Kirtsoglou E, Simpson B, editors. The Time of Anthropology: Studies of Contemporary Chronopolitics. Abingdon: Routledge; 2020. Chapter 5. In: Kirtsoglou E, Simpson B, editors. The Time of Anthropology: Studies of Contemporary Chronopolitics. Abingdon: Routledge; 2020. Chapter 5. PMID: 36137063 Free Books & Documents. Review. - Using Experience Sampling Methodology to Capture Disclosure Opportunities for Autistic Adults.
Love AMA, Edwards C, Cai RY, Gibbs V. Love AMA, et al. Autism Adulthood. 2023 Dec 1;5(4):389-400. doi: 10.1089/aut.2022.0090. Epub 2023 Dec 12. Autism Adulthood. 2023. PMID: 38116059 Free PMC article. - Identification of a novel toxicophore in anti-cancer chemotherapeutics that targets mitochondrial respiratory complex I.
Stephenson ZA, Harvey RF, Pryde KR, Mistry S, Hardy RE, Serreli R, Chung I, Allen TE, Stoneley M, MacFarlane M, Fischer PM, Hirst J, Kellam B, Willis AE. Stephenson ZA, et al. Elife. 2020 May 20;9:e55845. doi: 10.7554/eLife.55845. Elife. 2020. PMID: 32432547 Free PMC article. - Qualitative evidence synthesis informing our understanding of people's perceptions and experiences of targeted digital communication.
Ryan R, Hill S. Ryan R, et al. Cochrane Database Syst Rev. 2019 Oct 23;10(10):ED000141. doi: 10.1002/14651858.ED000141. Cochrane Database Syst Rev. 2019. PMID: 31643081 Free PMC article. - Pharmacological treatments in panic disorder in adults: a network meta-analysis.
Guaiana G, Meader N, Barbui C, Davies SJ, Furukawa TA, Imai H, Dias S, Caldwell DM, Koesters M, Tajika A, Bighelli I, Pompoli A, Cipriani A, Dawson S, Robertson L. Guaiana G, et al. Cochrane Database Syst Rev. 2023 Nov 28;11(11):CD012729. doi: 10.1002/14651858.CD012729.pub3. Cochrane Database Syst Rev. 2023. PMID: 38014714 Free PMC article. Review.
Cited by
- The Interplay of RNA Binding Proteins, Oxidative Stress and Mitochondrial Dysfunction in ALS.
Harley J, Clarke BE, Patani R. Harley J, et al. Antioxidants (Basel). 2021 Apr 2;10(4):552. doi: 10.3390/antiox10040552. Antioxidants (Basel). 2021. PMID: 33918215 Free PMC article. Review. - Molecular Dissection of TDP-43 as a Leading Cause of ALS/FTLD.
Tamaki Y, Urushitani M. Tamaki Y, et al. Int J Mol Sci. 2022 Oct 19;23(20):12508. doi: 10.3390/ijms232012508. Int J Mol Sci. 2022. PMID: 36293362 Free PMC article. Review. - Mitochondrial dynamism and the pathogenesis of Amyotrophic Lateral Sclerosis.
Cozzolino M, Rossi S, Mirra A, Carrì MT. Cozzolino M, et al. Front Cell Neurosci. 2015 Feb 10;9:31. doi: 10.3389/fncel.2015.00031. eCollection 2015. Front Cell Neurosci. 2015. PMID: 25713513 Free PMC article. Review. - Effects of the Edaravone, a Drug Approved for the Treatment of Amyotrophic Lateral Sclerosis, on Mitochondrial Function and Neuroprotection.
Cha SJ, Kim K. Cha SJ, et al. Antioxidants (Basel). 2022 Jan 20;11(2):195. doi: 10.3390/antiox11020195. Antioxidants (Basel). 2022. PMID: 35204078 Free PMC article. Review. - Dysregulation of organelle membrane contact sites in neurological diseases.
Kim S, Coukos R, Gao F, Krainc D. Kim S, et al. Neuron. 2022 Aug 3;110(15):2386-2408. doi: 10.1016/j.neuron.2022.04.020. Epub 2022 May 12. Neuron. 2022. PMID: 35561676 Free PMC article. Review.
References
- Rizzuto R. et al.. Close contacts with the endoplasmic reticulum as determinants of mitochondrial Ca2+ responses. Science 280, 1763–1766 (1998). - PubMed
- Kornmann B. The molecular hug between the ER and the mitochondria. Curr. Opin. Cell Biol. 25, 443–448 (2013). - PubMed
Publication types
MeSH terms
Substances
Grants and funding
- 089701/WT_/Wellcome Trust/United Kingdom
- G0900635/MRC_/Medical Research Council/United Kingdom
- G0600974/MRC_/Medical Research Council/United Kingdom
- G1100695/MRC_/Medical Research Council/United Kingdom
- G0500289/MRC_/Medical Research Council/United Kingdom
- G0900688/MRC_/Medical Research Council/United Kingdom
- MILLER/OCT08/6247/MNDA_/Motor Neurone Disease Association/United Kingdom
- MR/L501529/1/MRC_/Medical Research Council/United Kingdom
- G0501573/MRC_/Medical Research Council/United Kingdom
- MC_G1000733/MRC_/Medical Research Council/United Kingdom
- 078662/WT_/Wellcome Trust/United Kingdom
- WT_/Wellcome Trust/United Kingdom
- MR/K005146/1/MRC_/Medical Research Council/United Kingdom
LinkOut - more resources
Full Text Sources
Other Literature Sources
Miscellaneous


