Differential roles of microglia and monocytes in the inflamed central nervous system - PubMed (original) (raw)
. 2014 Jul 28;211(8):1533-49.
doi: 10.1084/jem.20132477. Epub 2014 Jul 7.
Haiyan Lu 1, Oleg Butovsky 2, Nobuhiko Ohno 1, Anna M Rietsch 1, Ron Cialic 2, Pauline M Wu 1, Camille E Doykan 1, Jessica Lin 3, Anne C Cotleur 1, Grahame Kidd 1, Musab M Zorlu 4, Nathan Sun 5, Weiwei Hu 6, LiPing Liu 1, Jar-Chi Lee 1, Sarah E Taylor 7, Lindsey Uehlein 3, Debra Dixon 8, Jinyu Gu 1, Crina M Floruta 9, Min Zhu 1, Israel F Charo 10, Howard L Weiner 2, Richard M Ransohoff 11
Affiliations
- PMID: 25002752
- PMCID: PMC4113947
- DOI: 10.1084/jem.20132477
Differential roles of microglia and monocytes in the inflamed central nervous system
Ryo Yamasaki et al. J Exp Med. 2014.
Abstract
In the human disorder multiple sclerosis (MS) and in the model experimental autoimmune encephalomyelitis (EAE), macrophages predominate in demyelinated areas and their numbers correlate to tissue damage. Macrophages may be derived from infiltrating monocytes or resident microglia, yet are indistinguishable by light microscopy and surface phenotype. It is axiomatic that T cell-mediated macrophage activation is critical for inflammatory demyelination in EAE, yet the precise details by which tissue injury takes place remain poorly understood. In the present study, we addressed the cellular basis of autoimmune demyelination by discriminating microglial versus monocyte origins of effector macrophages. Using serial block-face scanning electron microscopy (SBF-SEM), we show that monocyte-derived macrophages associate with nodes of Ranvier and initiate demyelination, whereas microglia appear to clear debris. Gene expression profiles confirm that monocyte-derived macrophages are highly phagocytic and inflammatory, whereas those arising from microglia demonstrate an unexpected signature of globally suppressed cellular metabolism at disease onset. Distinguishing tissue-resident macrophages from infiltrating monocytes will point toward new strategies to treat disease and promote repair in diverse inflammatory pathologies in varied organs.
© 2014 Yamsaki et al.
Figures
Figure 1.
MDMs and MiDMs exhibit different time courses of accumulation in the CNS of mice with EAE and morphological characteristics can distinguish them. (A) Immunohistochemistry shows expression of CD11b for red RFP+ MDMs and green GFP+ MiDMs in the spinal cords of _Cx3cr1_gfp/+::_Ccr2_rfp/+ mice at EAE onset. Bars: 25 µm. We studied 6 mice at EAE onset from 3 EAE inductions. In each EAE induction, 8–10 mice were used and 2 mice were selected from each induction. (B) Flow cytometric analysis of CCR2-RFP+ and CX3CR1-GFP+ populations in cells gated for F4/80 expression (top); CD45 expression of F4/80+RFP+ MDMs and F4/80+GFP+ MiDMs populations (middle); and MDMs and MiDMs numbers at EAE onset, peak, and recovery (bottom). We studied 3 mice for naive groups; 12 for onset; 15 for peak; 13 for recovery from 5 EAE inductions. For each induction, 8–10 mice were used and 2–3 mice were selected at each time point (onset, peak, and recovery) for analysis. (C) Confocal microscopy assessment of myeloid cell morphology in lumbar spinal cord from mice at EAE onset. We studied 54 MDMs and 51 MiDMs of 5 EAE onset mice from 3 EAE inductions for (C–E); 2 sections/mouse; 4–6 cells/section; 8–12 cells /mouse. In each EAE induction, 8–10 mice were induced and 1–2 EAE onset mice were selected from each experiment. Bars, 25 µm. (D) Cell volumes of 500 µm3; surface areas of 1,000 µm2; primary process numbers ≤3 or ≥5; solidity3D of 0.4; and Formfactor3D of 0.3 discriminate between MDMs and MiDMs. (E) Model plot of cell volume against primary process number to distinguish MDMs (red symbols and pink area) from MiDMs (green symbols and green area).
Figure 2.
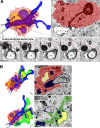
SBF-SEM shows MDMs initiating demyelination at EAE onset. Quantitation of MiDMs and MDMs interacting with axoglial units in SBF-SEM images of CNS at EAE onset. Intact (69%) and demyelinated (76%) segments interacted with MDMs and MiDMs. Red and pink, MDMs; green and light green, MiDMs; yellow, both MDMs and MiDMs. We studied 29 intact axon segments, 46 demyelinated axon segments, 86 MiDMs, and 169 MDMs in 14 lesions of 7 EAE onset mice from 3 EAE inductions as follows: 8–10 mice were immunized at each experiment and 2–3 onset mice were selected from each induction.
Figure 3.
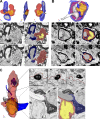
SBF-SEM shows example of MDM-initiating demyelination at EAE onset. (A) Representative MDMs encircles the axoglial unit. A myelin ovoid within an intracellular phagolysosome shows physical continuity with myelin remaining attached to an axoglial unit which is undergoing active demyelination. In serial images, disrupted myelin shows continuity from outside to inside the MDM. (B) Rotated view from B demonstrating MDM-extensive attachment to axoglial unit and MiDM nearby with limited attachment to axon. A, axon; m, myelin; c, cytosol; n, nucleus. Red, MDM cytosol; green, MiDM cytosol; yellow: nuclei; blue, myelin and myelin debris; gray, axoplasm; red line, MDM plasma membrane. We studied 14 lesions from 7 EAE onset mice from 3 EAE inductions as follows: 8–10 mice were immunized at each experiment and 2–3 EAE onset mice were selected from each induction. Bar, 2 µm.
Figure 4.
MDMs surrounded, apposed, and invaded nodes of Ranvier at EAE onset. (A) SBF-SEM images and 3D reconstruction of SBF-SEM images of MDMs with a node of Ranvier. White and black arrow: microvillus. (B) SBF-SEM images and 3D construction of intratubal MDMs with demyelinated axon and node of Ranvier. (C) SBF-SEM images and 3D reconstruction of an MDM with intracellular myelin debris apposed to a node of Ranvier. Red, MDM cytosol; yellow, nucleus; blue, myelin; gray, axoplasm. M, myelin; c, cytosol. red line, MDM plasma membrane. We studied 14 lesions from 7 EAE onset mice collected as follows: 8–10 mice were immunized at each induction and 2–3 EAE onset mice were selected from each immunization. Bar, 2 µm.
Figure 5.
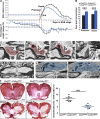
Nodal pathology without demyelination at EAE onset in _Ccr2_rfp/rfp::_Cx3cr1_gfp/+ mice. (A) Magnitude of weight loss in _Ccr2_rfp/+::_Cx3cr1_gfp/+ and _Ccr2_rfp/rfp::_Cx3cr1_gfp/+ mice at preonset and onset stages of EAE. Clinical score in _Ccr2_rfp/+::_Cx3cr1_gfp/+ and _Ccr2_rfp/rfp::_Cx3cr1_gfp/+ mice at EAE onset stage. (B) Days at disease preonset and onset stages of EAE. We studied 28 _Ccr2_rfp/+::_Cx3cr1_gfp/+ mice and 26 _Ccr2_rfp/rfp::_Cx3cr1_gfp/+ mice for A and B. Data were collected from 12 EAE inductions in _Ccr2_rfp/+::_Cx3cr1_gfp/+ mice and 19 EAE inductions in _Ccr2_rfp/rfp::_Cx3cr1_gfp/+ mice as follows: 8–10 mice were immunized at each induction and 1–3 EAE recovery mice were selected from each immunization. **, P < 0.01; ***, P < 0.001. (C) SBF-SEM imaging of MDMs with nodes of Ranvier phagocytosis in _Ccr2_rfp/+::_Cx3cr1_gfp/+ mice at EAE preonset. Pink, MDM cytosol; red arrow, myelin inclusion of MDM connecting to the node of Ranvier. We studied 3 tissues from 3 _Ccr2_rfp/+::_Cx3cr1_gfp/+ EAE mice at preonset stage from 3 EAE inductions: 8–10 mice were immunized at each experiment and one EAE preonset mouse was selected from each induction. Bar, 2 µm. (D) SBF-SEM of disrupted nodes (black arrows) in preonset spinal cord tissues of _Ccr2_rfp/rfp::_Cx3cr1_gfp/+ mice. Bar, 2 µm. (E) SBF-SEM of neutrophil is with myelin phagocytosis from internode at preonset stage of _Ccr2_rfp/rfp::_Cx3cr1_gfp/+ mouse. Blue, neutrophil cytosol. For D–E, we studied three tissues from three _Ccr2_rfp/rfp::_Cx3cr1_gfp/+ EAE mice at preonset stage from 3 EAE inductions: 8–10 mice were immunized at each experiment and one EAE preonset mouse was selected from each induction. Bar: 2 µm. (F) Histochemical staining and with aurohalophosphate complexes (black gold staining) and quantification of demyelinated area of _Ccr2_rfp/+::_Cx3cr1_gfp/+ mice and _Ccr2_rfp/+::_Cx3cr1_gfp/+ mice. We studied 5 naive _Ccr2_rfp/+::_Cx3cr1_gfp/+ mice, 5 naive _Ccr2_rfp/rfp::_Cx3cr1_gfp/+ mice, 5 onset _Ccr2_rfp/+::_Cx3cr1_gfp/+ mice, and 5 onset _Ccr2_rfp/rfp::_Cx3cr1_gfp/+ mice from 3 EAE inductions as follows: 8–10 mice were immunized at each experiment and 1–2 onset mice were selected from each induction. **, P < 0.01. Bar: 250 µm.
Figure 6.
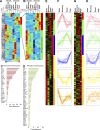
Inflammatory signature in MiDMs versus MDMs in the CNS of _Cx3cr1_gfp/+::_Ccr2_rfp/+ mice with EAE. (A) Quantitative nCounter expression profiling of 179 inflammation related genes was performed in CNS-derived GFP+ microglia and RFP+ recruited monocytes from naive and EAE mice at onset, peak and recovery stages. Each row of the heat map represents an individual gene and each column an individual group from pool of 5 mice at each time point. The relative abundance of transcripts is indicated by a color (red, higher; green, median; blue, low). For A–H, we studied five mice in each time point (onset, peak, recovery) from 3 EAE inductions; 8–10 mice were immunized in each induction. (B) Heat map of differentially expressed microglia and monocyte genes. (C) Enriched monocyte genes as compared with resident microglia. Bars represent fold changes of gene expression across naive and all disease stages versus resident microglia. (D) Enriched microglia genes as compared with recruited monocytes. Bars represent fold changes of gene expression across naive and all disease stages versus recruited monocytes. (E–H) K-means clustering of inflammation genes in resident microglia and recruited monocytes. K-means clustering was used to generate 5 disease stage–related clusters in MiDMs. Heat map (E) and expression profile (F) of inflammation genes in MiDMs are shown by generated clusters. MDM expression matrix overlaid on microglial based clusters shows (G) heat map and (H) expression profile.
Figure 7.
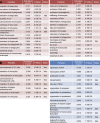
Affected functions in MiDMs and MDMs at EAE onset. nCounter inflammatory gene expression data were uploaded to IPA. Genes with fold change (EAE onset vs. Naive) ≥1.5 or ≤−1.5 were included in downstream effects analysis. (A) MDMs up-regulated functions, sorted by activation z-score. (B) MiDMs up-regulated (left) and down-regulated (right) functions, sorted by activation z score. The bias term indicates imbalanced numbers of up- and down-regulated genes associated with a distal function requiring significance at the P < 0.01 level. We studied pooled samples from 5 mice in each time point (onset, peak, recovery) from 3 EAE inductions; 8–10 mice were immunized in each induction.
Figure 8.
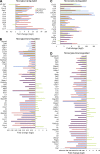
Restoration of affected inflammatory genes in resident microglia and recruited monocytes at recovery stage. For each gene, fold change of all different disease stages versus naive state were calculated. Genes that contained at least one fold change >2 or < 0.5 and average fold change for peak and onset >2 or <0.5 were presented. (A) Microglial up-regulated; (B) Microglial down-regulated; (C) monocyte up-regulated; (D) monocyte down-regulated. We studied pooled samples from five mice in each time point (onset, peak, recovery) from three EAE inductions; 8–10 mice were immunized in each induction. FC, fold change.
Figure 9.
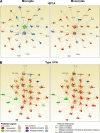
Function networks in MiDMs and MDMs. nCounter inflammatory gene expression data were uploaded to IPA. Genes with fold change (EAE onset vs. Naive) ≥1.5 or ≤−1.5 were included in upstream regulators analysis. Predicted upstream regulators were manually curated to form functional clusters. Clusters were uploaded to IPA using Z scores as reference value for each gene. Networks were generated for each cluster consisting of uploaded genes and additional predicted molecules. (A) Typical example of functions with dissimilar activation pattern in MiDMs and MDMs: HIF1A. (B) Function with similar activation pattern in MiDMs and MDMs: Type I IFN. Red object denotes positive (>2) z score and green object denotes negative (<2) z-score. Orange object denotes predicted activation of the network object. Blue object denotes predicted inhibition of the network object. Predicted relationships (connecting lines): orange, leads to activation; blue, leads to inhibition; yellow, finding inconsistent with state of downstream molecule; gray, effect not predicted.
Comment in
- Macrophages derived from infiltrating monocytes mediate autoimmune myelin destruction.
Heneka MT. Heneka MT. J Exp Med. 2014 Jul 28;211(8):1500. doi: 10.1084/jem.2118insight1. J Exp Med. 2014. PMID: 25071159 Free PMC article. No abstract available.
Similar articles
- Splitting the "Unsplittable": Dissecting Resident and Infiltrating Macrophages in Experimental Autoimmune Encephalomyelitis.
Koeniger T, Kuerten S. Koeniger T, et al. Int J Mol Sci. 2017 Sep 29;18(10):2072. doi: 10.3390/ijms18102072. Int J Mol Sci. 2017. PMID: 28961183 Free PMC article. Review. - Temporal expression and cellular origin of CC chemokine receptors CCR1, CCR2 and CCR5 in the central nervous system: insight into mechanisms of MOG-induced EAE.
Eltayeb S, Berg AL, Lassmann H, Wallström E, Nilsson M, Olsson T, Ericsson-Dahlstrand A, Sunnemark D. Eltayeb S, et al. J Neuroinflammation. 2007 May 7;4:14. doi: 10.1186/1742-2094-4-14. J Neuroinflammation. 2007. PMID: 17484785 Free PMC article. - Opposing Functions of Microglial and Macrophagic TNFR2 in the Pathogenesis of Experimental Autoimmune Encephalomyelitis.
Gao H, Danzi MC, Choi CS, Taherian M, Dalby-Hansen C, Ellman DG, Madsen PM, Bixby JL, Lemmon VP, Lambertsen KL, Brambilla R. Gao H, et al. Cell Rep. 2017 Jan 3;18(1):198-212. doi: 10.1016/j.celrep.2016.11.083. Cell Rep. 2017. PMID: 28052249 Free PMC article. - Siglec-H is a microglia-specific marker that discriminates microglia from CNS-associated macrophages and CNS-infiltrating monocytes.
Konishi H, Kobayashi M, Kunisawa T, Imai K, Sayo A, Malissen B, Crocker PR, Sato K, Kiyama H. Konishi H, et al. Glia. 2017 Dec;65(12):1927-1943. doi: 10.1002/glia.23204. Epub 2017 Aug 24. Glia. 2017. PMID: 28836308 - Differential roles of resident microglia and infiltrating monocytes in murine CNS autoimmunity.
Shemer A, Jung S. Shemer A, et al. Semin Immunopathol. 2015 Nov;37(6):613-23. doi: 10.1007/s00281-015-0519-z. Epub 2015 Aug 4. Semin Immunopathol. 2015. PMID: 26240063 Review.
Cited by
- Harnessing the Benefits of Neuroinflammation: Generation of Macrophages/Microglia with Prominent Remyelinating Properties.
Mishra MK, Rawji KS, Keough MB, Kappen J, Dowlatabadi R, Vogel HJ, Chopra S, Distéfano-Gagné F, Dufour A, Gosselin D, Yong VW. Mishra MK, et al. J Neurosci. 2021 Apr 14;41(15):3366-3385. doi: 10.1523/JNEUROSCI.1948-20.2021. Epub 2021 Mar 12. J Neurosci. 2021. PMID: 33712513 Free PMC article. - Dynamic Responses of Microglia in Animal Models of Multiple Sclerosis.
Plastini MJ, Desu HL, Brambilla R. Plastini MJ, et al. Front Cell Neurosci. 2020 Aug 20;14:269. doi: 10.3389/fncel.2020.00269. eCollection 2020. Front Cell Neurosci. 2020. PMID: 32973458 Free PMC article. - Divergent Functions of Tissue-Resident and Blood-Derived Macrophages in the Hemorrhagic Brain.
Chang CF, Goods BA, Askenase MH, Beatty HE, Osherov A, DeLong JH, Hammond MD, Massey J, Landreneau M, Love JC, Sansing LH. Chang CF, et al. Stroke. 2021 May;52(5):1798-1808. doi: 10.1161/STROKEAHA.120.032196. Epub 2021 Apr 12. Stroke. 2021. PMID: 33840225 Free PMC article. - Prostaglandin D2 signaling in dendritic cells is critical for the development of EAE.
Zheng J, Sariol A, Meyerholz D, Zhang Q, Abrahante Lloréns JE, Narumiya S, Perlman S. Zheng J, et al. J Autoimmun. 2020 Nov;114:102508. doi: 10.1016/j.jaut.2020.102508. Epub 2020 Jul 2. J Autoimmun. 2020. PMID: 32624353 Free PMC article. - Tumor necrosis factor: a mechanistic link between angiotensin-II-induced cardiac inflammation and fibrosis.
Duerrschmid C, Trial J, Wang Y, Entman ML, Haudek SB. Duerrschmid C, et al. Circ Heart Fail. 2015 Mar;8(2):352-61. doi: 10.1161/CIRCHEARTFAILURE.114.001893. Epub 2014 Dec 30. Circ Heart Fail. 2015. PMID: 25550440 Free PMC article.
References
Publication types
MeSH terms
Substances
LinkOut - more resources
Full Text Sources
Other Literature Sources
Molecular Biology Databases


