Cell-intrinsic lysosomal lipolysis is essential for alternative activation of macrophages - PubMed (original) (raw)
doi: 10.1038/ni.2956. Epub 2014 Aug 3.
Bart Everts 2, Yulia Ivanova 2, David O'Sullivan 2, Marcia Nascimento 1, Amber M Smith 1, Wandy Beatty 3, Latisha Love-Gregory 4, Wing Y Lam 1, Christina M O'Neill 1, Cong Yan 5, Hong Du 5, Nada A Abumrad 4, Joseph F Urban Jr 6, Maxim N Artyomov 1, Erika L Pearce 1, Edward J Pearce 1
Affiliations
- PMID: 25086775
- PMCID: PMC4139419
- DOI: 10.1038/ni.2956
Cell-intrinsic lysosomal lipolysis is essential for alternative activation of macrophages
Stanley Ching-Cheng Huang et al. Nat Immunol. 2014 Sep.
Abstract
Alternative (M2) activation of macrophages driven via the α-chain of the receptor for interleukin 4 (IL-4Rα) is important for immunity to parasites, wound healing, the prevention of atherosclerosis and metabolic homeostasis. M2 polarization is dependent on fatty acid oxidation (FAO), but the source of the fatty acids that support this metabolic program has not been clear. We found that the uptake of triacylglycerol substrates via the scavenger receptor CD36 and their subsequent lipolysis by lysosomal acid lipase (LAL) was important for the engagement of elevated oxidative phosphorylation, enhanced spare respiratory capacity (SRC), prolonged survival and expression of genes that together define M2 activation. Inhibition of lipolysis suppressed M2 activation during infection with a parasitic helminth and blocked protective responses to this pathogen. Our findings delineate a critical role for cell-intrinsic lysosomal lipolysis in M2 activation.
Figures
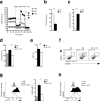
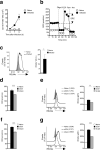
Figure 1
M2 activation is marked by increased spare respiratory capacity and is dependent on fatty acid oxidation. (a) Bone marrow-derived macrophages were cultured in medium without (M0) or with IFN-γ + LPS (M1), or with IL-4 (M2) for 24 h and then oxygen consumption rates (OCR) was determined using an XF-96 Extracellular Flux Analyzer (EFA) during sequential treatments with oligomycin, FCCP, and rotenone/antimycin. Spare respiratory capacity (SRC), the quantitative difference between maximal uncontrolled OCR, and the initial basal OCR, is depicted in the plot. (b) M1 and M2 macrophage basal extracellular acidification rates (ECAR, changes in mpH per unit time), measured in real time using the EFA. (c) Ratios of OCR/ECAR for M1 and M2 macrophages. (d) The effect of etomoxir (ETO) on basal OCR in M2 macrophages. Basal OCR for M0 macrophages is shown as a reference. (e) The effect of ETO on M2 SRC as defined in (a). (f) The effect of ETO on CD206 and CD301 expression by M2 macrophages, as measured by flow cytometry. Expression on M0 macrophages is shown for reference. (g) Effect of ETO on RELMαexpression by M2 macrophages. (h) Effect of ETO on iNOS expression by M1 macrophages. In these experiments ETO was included in the culture from the time at which M2 or M1 polarizing conditions were initiated, and data were collected 24 h later. Data in a-e are means + SEM (a) or ± SEM of 5 or more technical replicates from one experiment, and are representative of more than three independent experiments.. In f, numbers represent % of macrophages falling within indicated gates; plots shown are from one representative experiment of 2, but numbers are mean ± SEM of data from both experiments. . In g histograms show plots from one experiment representative of 3, and the bar graph shows mean relative geometric mean fluorescence intensity (gMFI) values ± SEM from 3 independent experiments. In h, histograms show plots from one experiment representative of 2. The mean % of cells that were iNOS positive in these two experiments were 69.7% ± 1.3% (SEM) for M1 cells and 60.5% ± 9.7% for M1 plus ETO. _P-_values are from Student's _t_-test (*P < 0.05, **P < 0.0001).
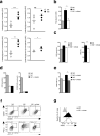
Figure. 2
Lipolysis is essential for M2 activation and survival. (a) Abundance of the monoacylglycerols 1-oleoylglycerol, 1-palmitoylglycerol, 1stearoglycerol and 2-palmitoylglycerol in extracts of M2 compared to M1 macrophages were assessed by mass spectrometry (AU, arbitrary units). (b) Glycerol concentrations in 24 h culture supernatants of M0 macrophages, M2 macrophages, and M2 macrophages treated with the lipase inhibitor tetrahydrolipistatin (Orlistat, 100 μM). (c-g) The effect of inhibiting lipolysis with Orlistat on (c) basal OCR and SRC in M2 macrophages, (d) basal OCR, and on the basal OCR/ ECAR ratio in M1 macrophages, (e) M2 macrophage survival, (f) CD206, CD301, PD-L2 and RELMα expression by M2 macrophages, as measured by flow cytometry, (g) iNOS expression in M1 macrophages. In these experiments Orlistat was included in the culture from the time at which M2 or M1 polarizing conditions were initiated and data were collected 24 h (a-d, f, g) or 48 h (e) later. Data for M0 macrophages are shown in c,d,f, and g for reference. Data in a show means ± SEM from 4 independent experiments. Data in b-e are means ± SEM of 3 technical replicates from one experiment representative of 3. In f, numbers represent % of macrophages falling within indicated gates; plots shown are from one representative experiment of 2, but numbers are mean ± SEM of data from both experiments. In g histograms show plots from one experiment representative of 2. The mean % of cells that were iNOS positive in these two experiments were 68.2 ± 5.0% (SEM) for M1 cells and 70.2% ± 6.7% for M1 plus Orlistat. data are P values are from Student's _t_-test (*P < 0.05; **P < 0.01; ***P < 0.0001).
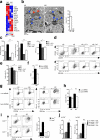
Figure 3
Lipolysis for M2 activation is mediated by lysosomal acid lipase. (a) RNA-Seq analysis of the relative expression in M2 and M1 macrophages of genes involved in lipolysis. (b) Transmission electron micrographs of bone marrow derived M1 and M2 macrophages. Blue arrowheads indicate mitochondria, yellow asterixes indicate lysosomes, and red arrowheads indicate lipid droplets. Graph shows numbers of lipid droplets (LD) per cell in M1 and M2 cells (150 cells per condition were examined, and data represent means ± SEM). (c) The effect of neutralizing lysosomal pH with chloroquine (CLQ) or Bafilomycin (Baf) on basal OCR, the ratio of OCR/ECAR, and SRC in M2 macrophages. Basal OCR and OCR/ECAR ratios for M0 macrophages are shown as a reference. (d) The effect of CLQ and Baf on CD206, CD301, PD-L2 and RELMα expression by M2 macrophages, as measured by flow cytometry. Expression for M0 macrophages is shown for reference. (e) Effects on M2 cell viability of culturing for 24 h in CLQ or Baf. (f) Basal OCR, relative to M0 macrophages, of M2 macrophages transduced with either control virus (Luc shRNA) or virus expressing shRNA against Lipa (Lipa shRNA). (g,h) Expression of CD206 and CD301 and of PD-L2 and of RELMα (g) and cellular viability (h) of macrophages transduced with Luc shRNA or Lipa shRNA prior to culture in M0 or M2 conditions. For (h), cells were cultured for 2 days before assessment. (i) Expression of CD206, CD301 and RELMα by wild-type (Lipa+/+) or _Lipa-/-_M0 or M2 macrophages. (j) %RELMα positive Lipa shRNA transduced vs Luc shRNA transduced huCD8+ peritoneal macrophages from bone marrow chimeric mice injected with PBS or IL-4c (left). Data from untransduced huCD8- peritoneal macrophages from the same mice are shown for comparison (right). Data in a are from 2 separate experiments. Images in b are from individual cells, representative of over 150 examined from 2 independent experiments. Data in the graph are mean ± SEM values of numbers of typical lipid droplets (LD) per cell, from 2 independent experiments Data in c, e and f are means ± SEM of 3 technical replicates from one experiment representative of 3. In d, g, and i, numbers represent % of macrophages falling within indicated gates; plots shown are from one representative experiment of 2, but numbers are mean ± SEM of data from both experiments. Data in bar graphs in h and i are of mean ± SEM values from 2-3 independent experiments. Data in j are from mean ± SEM values from a minimum of 2 independent mice. P values are from Student’s _t_-test (*P < 0.05; **P < 0.01; ***P < 0.0001).
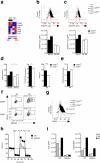
Figure 4
CD36 is critical for M2 activation**. (a)** RNA-Seq analysis of the relative expression in M2 vs. M1 macrophages of genes involved in the uptake of triacylglycerol-carrying proteins. (b, c) The uptake of BODIPY labeled LDL (a) and VLDL (b) by M0 and M2 WT (Cd36+/+) and Cd36-/- macrophages, as measured by flow cytometry. Top panels show histograms from one experiment, bottom panels show gMFI from duplicate experiments. Fluoresence staining was compared to unstained cells (US). (d) basal OCR, the ratio of basal OCR to basal ECAR, and SRC in M2 WT and Cd36-/- M2 macrophages, (e) basal OCR and the ratio of basal OCR to basal ECAR in WT and Cd36-/- M1 macrophages, (f) PD-L2 and RELMα expression by WT and Cd36-/- M2 macrophages, (g) iNOS expression by WT and Cd36-/- M1 macrophages. Data in b-g from M0 macrophages are shown for comparison. (h) OCR readings, in real time, for human control and CD36-deficient M0 and M2 macrophages (derived from monocytes that were cultured in M-CSF for 8 days prior to treatment with cytokine), at basal and following sequential treatments with oligomycin, FCCP, and rotenone/antimycin A. Data have been baselined relative to each other. (i) Expression of CD36 and CD206 in control and CD36 deficient human M0, M1 and M2 monocyte-derived macrophages. Data in a are from 2 separate experiments. In b-c data in histograms are from one experiment representative of 2, and data in bar graphs represent mean ± SEM values from 2 independent experiments. In d and e data are means ± SEM of 3 technical replicates from one experiment representative of 2 independent experiments. Numbers in f and g represent % of macrophages falling within the indicated gates. In f, plots are from 1 experiment representative of 2, but numbers represent mean ± SEM values from 2 independent experiments. In g graphs are from one experiment representative of 2, but numbers represent mean ± SEM values from 2 independent experiments. In h data are mean + SEM values from a minimum of 4 technical replicates from cells from one subject. P values are from Student's _t_-test (*P < 0.01; **P < 0.0001).
Figure 5
The peritoneal cavity is a site of M2 macrophage activation during infection with H. polygrus, and M2 macrophage activation is LAL-dependent. (a) Total numbers of CD11b+F4/80+ peritoneal macrophages in naïve mice and in infected mice at various days post-infection with H. polygyrus. (b) OCR readings, in real time, for macrophages from uninfected (Naïve) or infected mice (day 9) at basal and following sequential treatments with oligomycin, FCCP, and rotenone/antimycin A. SRC is depicted in the plot. (c) RELMα expression in peritoneal macrophages from naïve mice and from mice infected with H. polygyrus for 9 days. The graph to the right shows the % of all peritoneal cells that are RELMα+ macrophages. (d,f) Baseline OCR of ex vivo peritoneal macrophages from naïve mice, or from infected mice following treatment with control (siCtrl) or Lipa (si_Lipa_) siRNAs and culture for 12 h in the absence (d) or presence (f) of added IL-4. (e,g) RELMα expression by the macrophage populations described in d and f. In a data are means ± SEM for cells taken from 2 - 4 individual mice from one experiment representative of 3. In b, data are mean + SEM values for 5 technical replicates for cells from 2 – 4 mice per group from 1 experiment representative of 3. In c the histogram shows data from cells pooled from 2 individual mice and the bar graph shows mean ± SEM values from 2 – 3 individual mice per group from 1 experiment representative of 3. In d, and f, bar graphs show mean ± SEM values for 3 technical replicates for cells pooled from 2 mice per group from 1 experiment representative of 2. In e data in histograms are from 1 mouse, representative of 2 mice per group, representative of 2 experiments. In g, data are mean ± SEM values for data from 2 mice per group from one experiment representative of 2. P values are from Student's _t_-test (*P < 0.05; **P < 0.0001).
Figure 6
Inhibition of lipolysis suppresses IL-4 driven M2 macrophage activation in vivo and the elimination of a primary H. polygyrus infection. Mice were infected and at day 9 groups of infected mice were injected with PBS (Ctrl), IL-4c, or IL-4c plus Orlistat. IL-4c injections were repeated on day 14 post infection. Orlistat treatment was repeated on days 11, 14 and 16 post infection. The experiment was terminated at day 17 after infection. (a) Basal OCR readings of peritoneal macrophages isolated from naïve mice, and from infected mice treated as shown. (b) RELMα expression by peritoneal macrophages from the various treatment groups. Left panel shows mean fluorescence intensity (MFI) and right panel shows % of macrophages staining positive for RELMα. (c) Fecal egg counts over time in mice treated as indicated. (d) Adult worm counts at day 17 in mice treated as indicated. In a, data are means ± SEM from 5 technical replicates of cells from 3 – 6 mice per group from one experiment representative of 2. In b (bar graphs) c and d, data are means ± SEM from 3 - 6 mice per group from one experiment representative of 2. In b, the histograms are from cells from one mouse per group, representative of 3 – 6 mice per group from one experiment representative of 2. P values are from Student's _t_-test, NS = not significant. Data are from individual experiments representative of two independent experiments. (*P < 0.05; **P < 0.0001)
Figure. 7. Inhibition of lipolysis suppresses resistance to reinfection with H.polygyrus
Mice were infected with H. polygyrus and treated with the anti-helminthic pyrantel pamoate prior to receiving a secondary infection (2°Hp). At the time of secondary infection, additional groups of mice were infected for the first time to provide primary H. polygyrus infection controls (1°Hp). Infected mice were treated (or not) with Orlistat on the day of infection and on days 2, 4, 6 and 8 post infection. The experiment was terminated on day 9 post 1° or 2° infection. (a) Numbers of CD11b+F4/80+ peritoneal macrophages in mice treated as indicated.(b) Basal OCR readings of peritoneal macrophages isolated from mice treated as indicated. (c) RELMα expression by peritoneal macrophages from the various treatment groups. Left panel shows mean fluorescence intensity (MFI) and right panel shows % of macrophages staining positive for RELMα. (d) Adult worm counts in mice treated as indicated. In a, c,(bar graph) and d, data are means ± SEM from 4 – 10 independently assessed mice per group from 1 experiment representative of 2. In b, data represent mean + SEM values for 5 technical replicates from cells from 4 – 8 or more mice per group from one experiment representative of 2. In c, data in the histogram are from 1 mouse representative of 3 – 8 mice per group from 1 experiment representative of 2. The numbers in the key are MFI values. In d data are from 5 – 8 individually assessed mice per experimental group. Data are from individual experiments representative of two independent experiments. P values are from Student's _t_-test, NS = not significant (*P < 0.05; **P < 0.0001).
Similar articles
- Memory CD8(+) T cells use cell-intrinsic lipolysis to support the metabolic programming necessary for development.
O'Sullivan D, van der Windt GJ, Huang SC, Curtis JD, Chang CH, Buck MD, Qiu J, Smith AM, Lam WY, DiPlato LM, Hsu FF, Birnbaum MJ, Pearce EJ, Pearce EL. O'Sullivan D, et al. Immunity. 2014 Jul 17;41(1):75-88. doi: 10.1016/j.immuni.2014.06.005. Epub 2014 Jul 4. Immunity. 2014. PMID: 25001241 Free PMC article. - Critical role of p38 MAPK in IL-4-induced alternative activation of peritoneal macrophages.
Jiménez-Garcia L, Herránz S, Luque A, Hortelano S. Jiménez-Garcia L, et al. Eur J Immunol. 2015 Jan;45(1):273-86. doi: 10.1002/eji.201444806. Epub 2014 Nov 24. Eur J Immunol. 2015. PMID: 25328047 - IFN-γ-driven IDO production from macrophages protects IL-4Rα-deficient mice against lethality during Schistosoma mansoni infection.
Rani R, Jordan MB, Divanovic S, Herbert DR. Rani R, et al. Am J Pathol. 2012 May;180(5):2001-8. doi: 10.1016/j.ajpath.2012.01.013. Epub 2012 Mar 16. Am J Pathol. 2012. PMID: 22426339 Free PMC article. - Alternative activation of macrophages: an immunologic functional perspective.
Martinez FO, Helming L, Gordon S. Martinez FO, et al. Annu Rev Immunol. 2009;27:451-83. doi: 10.1146/annurev.immunol.021908.132532. Annu Rev Immunol. 2009. PMID: 19105661 Review. - Alternative activation of macrophages: immune function and cellular biology.
Varin A, Gordon S. Varin A, et al. Immunobiology. 2009;214(7):630-41. doi: 10.1016/j.imbio.2008.11.009. Epub 2009 Mar 5. Immunobiology. 2009. PMID: 19264378 Review.
Cited by
- Untangling Local Pro-Inflammatory, Reparative, and Regulatory Damage-Associated Molecular-Patterns (DAMPs) Pathways to Improve Transplant Outcomes.
Dwyer GK, Turnquist HR. Dwyer GK, et al. Front Immunol. 2021 Feb 23;12:611910. doi: 10.3389/fimmu.2021.611910. eCollection 2021. Front Immunol. 2021. PMID: 33708206 Free PMC article. Review. - Fa(c)t checking: How fatty acids shape metabolism and function of macrophages and dendritic cells.
Almeida L, Everts B. Almeida L, et al. Eur J Immunol. 2021 Jul;51(7):1628-1640. doi: 10.1002/eji.202048944. Epub 2021 Apr 19. Eur J Immunol. 2021. PMID: 33788250 Free PMC article. Review. - Cross-talk between macrophages and gut microbiota in inflammatory bowel disease: a dynamic interplay influencing pathogenesis and therapy.
Ning S, Zhang Z, Zhou C, Wang B, Liu Z, Feng B. Ning S, et al. Front Med (Lausanne). 2024 Sep 16;11:1457218. doi: 10.3389/fmed.2024.1457218. eCollection 2024. Front Med (Lausanne). 2024. PMID: 39355844 Free PMC article. Review. - Circulation of gut-preactivated naïve CD8+ T cells enhances antitumor immunity in B cell-defective mice.
Akrami M, Menzies R, Chamoto K, Miyajima M, Suzuki R, Sato H, Nishii A, Tomura M, Fagarasan S, Honjo T. Akrami M, et al. Proc Natl Acad Sci U S A. 2020 Sep 22;117(38):23674-23683. doi: 10.1073/pnas.2010981117. Epub 2020 Sep 9. Proc Natl Acad Sci U S A. 2020. PMID: 32907933 Free PMC article. - Autophagic lipid metabolism sustains mTORC1 activity in TSC-deficient neural stem cells.
Wang C, Haas MA, Yang F, Yeo S, Okamoto T, Chen S, Wen J, Sarma P, Plas DR, Guan JL. Wang C, et al. Nat Metab. 2019 Nov;1(11):1127-1140. doi: 10.1038/s42255-019-0137-5. Epub 2019 Nov 11. Nat Metab. 2019. PMID: 32577608 Free PMC article.
References
- Schulz C, et al. A lineage of myeloid cells independent of Myb and hematopoietic stem cells. Science. 2012;336:86–90. - PubMed
- Gordon S. Alternative activation of macrophages. Nat Rev Immunol. 2003;3:23–35. - PubMed
Publication types
MeSH terms
Substances
Grants and funding
- CA158823/CA/NCI NIH HHS/United States
- P30 DK056341/DK/NIDDK NIH HHS/United States
- DK060022/DK/NIDDK NIH HHS/United States
- AI091965/AI/NIAID NIH HHS/United States
- R01 HL087001/HL/NHLBI NIH HHS/United States
- R21 CA158823/CA/NCI NIH HHS/United States
- CA138759/CA/NCI NIH HHS/United States
- R01 CA138759/CA/NCI NIH HHS/United States
- R01 DK060022/DK/NIDDK NIH HHS/United States
- CA164062/CA/NCI NIH HHS/United States
- AI32573/AI/NIAID NIH HHS/United States
- R01 CA164062/CA/NCI NIH HHS/United States
- P30 CA082709/CA/NCI NIH HHS/United States
- HL087001/HL/NHLBI NIH HHS/United States
- R01 CA152099/CA/NCI NIH HHS/United States
- R01 DK033301/DK/NIDDK NIH HHS/United States
- R01 AI091965/AI/NIAID NIH HHS/United States
- CA152099/CA/NCI NIH HHS/United States
- P30 DK020579/DK/NIDDK NIH HHS/United States
LinkOut - more resources
Full Text Sources
Other Literature Sources
Molecular Biology Databases
Miscellaneous
