High-fat-diet-mediated dysbiosis promotes intestinal carcinogenesis independently of obesity - PubMed (original) (raw)
. 2014 Oct 23;514(7523):508-12.
doi: 10.1038/nature13398. Epub 2014 Aug 31.
Ciğdem Atay 1, Jessica Heringer 1, Franziska K Romrig 2, Sarah Schwitalla 2, Begüm Aydin 3, Paul K Ziegler 4, Julia Varga 4, Wolfgang Reindl 5, Claudia Pommerenke 6, Gabriela Salinas-Riester 6, Andreas Böck 7, Carl Alpert 8, Michael Blaut 9, Sara C Polson 10, Lydia Brandl 11, Thomas Kirchner 12, Florian R Greten 4, Shawn W Polson 10, Melek C Arkan 2
Affiliations
- PMID: 25174708
- PMCID: PMC4233209
- DOI: 10.1038/nature13398
High-fat-diet-mediated dysbiosis promotes intestinal carcinogenesis independently of obesity
Manon D Schulz et al. Nature. 2014.
Abstract
Several features common to a Western lifestyle, including obesity and low levels of physical activity, are known risk factors for gastrointestinal cancers. There is substantial evidence suggesting that diet markedly affects the composition of the intestinal microbiota. Moreover, there is now unequivocal evidence linking dysbiosis to cancer development. However, the mechanisms by which high-fat diet (HFD)-mediated changes in the microbial community affect the severity of tumorigenesis in the gut remain to be determined. Here we demonstrate that an HFD promotes tumour progression in the small intestine of genetically susceptible, K-ras(G12Dint), mice independently of obesity. HFD consumption, in conjunction with K-ras mutation, mediated a shift in the composition of the gut microbiota, and this shift was associated with a decrease in Paneth-cell-mediated antimicrobial host defence that compromised dendritic cell recruitment and MHC class II molecule presentation in the gut-associated lymphoid tissues. When butyrate was administered to HFD-fed K-ras(G12Dint) mice, dendritic cell recruitment in the gut-associated lymphoid tissues was normalized, and tumour progression was attenuated. Importantly, deficiency in MYD88, a signalling adaptor for pattern recognition receptors and Toll-like receptors, blocked tumour progression. The transfer of faecal samples from HFD-fed mice with intestinal tumours to healthy adult K-ras(G12Dint) mice was sufficient to transmit disease in the absence of an HFD. Furthermore, treatment with antibiotics completely blocked HFD-induced tumour progression, suggesting that distinct shifts in the microbiota have a pivotal role in aggravating disease. Collectively, these data underscore the importance of the reciprocal interaction between host and environmental factors in selecting a microbiota that favours carcinogenesis, and they suggest that tumorigenesis is transmissible among genetically predisposed individuals.
Conflict of interest statement
The authors declare no competing financial interests.
Figures
Extended Data Figure 1
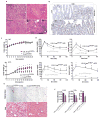
a, Primary tumors metastasized to liver, pancreas and spleen in K-rasG12Dint mice kept on HFD for 43 weeks. b, Immunohistochemistry staining on duodenum samples using antibody against BrdU showed increased proliferation in K-rasG12Dint mice. c, Weight curves for LSL-K-rasG12D/+ controls (n=4) and K-rasG12Dint (n=6) littermate animals showed no difference in weight gain under ND condition although K-rasG12Dint mice (n=7) remained significantly leaner when fed on a HFD (LSL-K-rasG12D/+ controls n=5). _P_-values were determined by t-test and adjusted for multiple testing. Error bars indicate s.e.m. *P ≤ 0.05, **P ≤ 0.001. d, In accordance with weight curves, response to glucose overload and insulin secretion during a GTT remained similar between the two groups under ND, however K-rasG12Dint mice remained insulin sensitive on HFD. (ND: LSL-K-rasG12D/+ controls n=3, K-rasG12Dint mice n=5; HFD: LSL-K-rasG12D/+ controls n=8, K-rasG12Dint mice n=5). _P_-values were determined by t-test and adjusted for multiple testing. Error bars indicate s.e.m. *P ≤ 0.05, **P ≤ 0.001. Results are representative of 2–3 independent experiments. e, Along with resistance to diet-induced obesity, K-rasG12Dint mice showed microvesicular steatosis in contrast to littermate controls that had macrovesicular steatosis suggesting decreased lipid accumulation in the liver. f, mRNA expression levels for F4/80 and TNFα were analyzed by RT-PCR (n=5). Plasma TNFα levels determined by ELISA showed decreased levels in K-rasG12Dint mice. _P_-values were determined by t-test. Error bars indicate s.e.m. *P ≤ 0.05.
Extended Data Figure 2
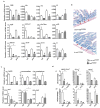
a, Relative mRNA expression levels for genes involved in immune responses were analyzed using duodenum samples by RT-PCR under ND and HFD condition (ND: LSL-K-rasG12D/+ controls n=3, K-rasG12Dint mice n=3; HFD: LSL-K-rasG12D/+ controls n=3, K-rasG12Dint mice n=6). _P_-values were determined by one-way ANOVA and adjusted for the number of comparisons with the Bonferroni method. Error bars indicate s.e.m. **P ≤ 0.001. #P ≤ 0.05, ##P ≤ 0.001 compared to littermate controls. b, Azure Eosin staining of duodenum samples showed decreased antimicrobial peptides in the crypts from K-rasG12Dint mice. c, Expression of differentiation markers for Paneth cells (cryptdin), epithelial cells (sucroisomaltase), and enteroendocrine cells (synaptophysin) as well as mucins in the duodenum was analyzed by RT-PCR under ND and HFD regimen (ND: LSL-K-rasG12D/+ controls n=3, K-rasG12Dint mice n=3; HFD: LSL-K-rasG12D/+ controls n=3, K-rasG12Dint mice n=4). _P_-values were determined by one-way ANOVA and adjusted for the number of comparisons with the Bonferroni method. Error bars indicate s.e.m. *P ≤ 0.05. ###P ≤ 0.0001 compared to littermate controls. d, FACS analysis of cells from lamina propria (LP) and Peyer’s Patches (PP) indicated CD11c+ DCs and MHC-II expression in K-rasG12Dint mice and littermate controls after ND or HFD regimen (n=2). _P_-values were determined by one-way ANOVA and adjusted for the number of comparisons with the Bonferroni method. Error bars indicate s.e.m. *P ≤ 0.05, **P ≤ 0.001. #P ≤ 0.05 compared to littermate controls.
Extended Data Figure 3
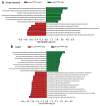
a, LEfSe results showed bacteria that were statistically different among K-rasG12Dint mice and littermate controls on HFD and indicated the effect size of each differentially abundant bacteria in the small intestine (LSL-K-rasG12D/+ controls n=3, K-rasG12Dint mice n=8) and b, the colon (LSL-K-rasG12D/+ controls n=5, K-rasG12Dint mice n=7). c, Relative abundance of Escherichia/Shigella and Helicobacter in the small intestine of K-rasG12Dint mice on ND and HFD.
Extended Data Figure 4
a, Histological scores of the small intestine showed complete lack of tumor progression in K-rasG12Dint mice with Myd88 deletion after HFD. However, tissue-specific deletion of Myd88 did not confer any protection in K-rasG12Dint mice (Myd88−/−-LSL-K-rasG12D/+ controls n=19, Myd88−/−-K-rasG12Dint mice n=15; Myd88fl/fl-LSL-K-rasG12D/+ controls n=5, Myd88IEC-K-rasG12Dint mice n=7; K-rasG12Dint+WT BM mice n=7, K-rasG12Dint+MyD88−/− BM mice n=8). Each point represents one animal and lines indicate means. Two-sided Fisher test was applied. Adjustments on pairwise t-tests were made using the single-step method. ***P ≤ 0.0001. not significant, ns. b, LEfSe results showed bacteria that were statistically different among K-rasG12Dint mice with (n=8) or without (n=4) Myd88 deletion on HFD. Peptostreptococcaceae, Deferribacteraceae, and Ruminococcaceae in the small intestine and Peptostreptococcaceae, and Deferribacteraceae in the colon, became abundant after Myd88 deficiency (K-rasG12Dint mice n=7, Myd88−/−-K-rasG12Dint mice n=4). c, FACS analysis of lamina propria (LP) cells indicated decreased recruitment and surface antigen presentation in CD11c+ DCs following HFD was partially attenuated after MyD88 deletion (Myd88−/−-LSL-K-rasG12D/+ controls n=8, Myd88−/−-K-rasG12Dint mice n=4). _P_-values were determined by one-way ANOVA and adjusted for the number of comparisons with the Bonferroni method. Error bars indicate s.e.m. *P ≤ 0.05, **P ≤ 0.001.
Extended Data Figure 5
a, LEfSe results showed small intestinal bacteria that were significantly different among K-rasG12Dint mice with and without Myd88 deletion in the IECs or b and c, hematopoietic cells on HFD (Myd88IEC-K-rasG12Dint mice n=4; K-rasG12Dint+WT BM mice n=4, K-rasG12Dint+MyD88−/− BM mice n=4, K-rasG12Dint mice n=8).
Extended Data Figure 6
**a,**HFD decreased acetate, butyrate, and propionate concentration, whereas iso-Valeric acid and Valeric acid increased in stool samples from K-rasG12Dint mice and littermate controls (ND: LSL-K-rasG12D/+ controls n=6, K-rasG12Dint mice n=8; HFD: LSL-K-rasG12D/+ controls n=7, K-rasG12Dint mice n=11). _P_-values were determined by one-way ANOVA and adjusted for the number of comparisons with the Bonferroni method. Error bars indicate s.e.m. *P ≤ 0.05, **P ≤ 0.001, ***P ≤ 0.0001. b, SCFA concentrations of small intestinal (LSL-K-rasG12D/+ controls n=4, K-rasG12Dint mice n=4) and colonic samples (LSL-K-rasG12D/+ controls n=3, K-rasG12Dint mice n=5) from K-rasG12Dint and control littermates on HFD supplemented with arabinogalactan. _P_-values were determined by one-way ANOVA followed by Bonferroni’s multiple comparison test. Error bars indicate s.e.m. *P ≤ 0.05, **P ≤ 0.001, ***P ≤ 0.0001. c, FACS analysis of cells from lamina propria (LP) and mesenteric lymph nodes (MLN) revealed compromised DC recruitment and decreased surface antigen presentation on HFD following supplementation with GOS. (HFD: LSL-K-rasG12D/+ controls n=2, K-rasG12Dint mice n=2; HFD+GOS: LSL-K-rasG12D/+ controls n=5, K-rasG12Dint mice n=3). _P_-values were determined by one-way ANOVA and adjusted for the number of comparisons with the Bonferroni method. Error bars indicate s.e.m. The differences were not significant.
Extended Data Figure 7
a, Relative mRNA expression levels for genes involved in immune responses, mucins and differentiation markers for Paneth, enteroendocrine, and epithelial cells using duodenum samples (HFD+GOS: LSL-K-rasG12D/+ controls n=5, K-rasG12Dint mice n=6; HFD+Abx: LSL-K-rasG12D/+ controls n=5, K-rasG12Dint mice n=6). _P_-values were determined by one-way ANOVA and adjusted for the number of comparisons with the Bonferroni method. Error bars indicate s.e.m. *P ≤ 0.05. #P ≤ 0.05, ##P ≤ 0.001, ###P ≤ 0.0001, compared to littermate controls. b, Prebiotic supplementation had very little or no effect on stool SCFA concentrations. (HFD: LSL-K-rasG12D/+ controls n=7, K-rasG12Dint mice n=11; HFD+GOS: LSL-K-rasG12D/+ controls n=5, K-rasG12Dint mice n=6). _P_-values were determined by one-way ANOVA and adjusted for the number of comparisons with the Bonferroni method. Error bars indicate s.e.m. *P ≤ 0.05, ***P ≤ 0.0001. ##P ≤ 0.001, ###P ≤ 0.0001, compared to littermate controls.
Extended Data Figure 8
a, Sodium butyrate treatment affected butyrate and propionate concentrations in the stool only slightly when compared to prebiotic supplementation. (HFD: LSL-K-rasG12D/+ controls n=7, K-rasG12Dint mice n=11; HFD+Butyrate: LSL-K-rasG12D/+ controls n=6, K-rasG12Dint mice n=5). _P_-values were determined by one-way ANOVA and adjusted for the number of comparisons with the Bonferroni method. Error bars indicate s.e.m. *P ≤ 0.05, **P ≤ 0.001, ***P ≤ 0.0001. #P ≤ 0.05, ##P ≤ 0.001, ###P ≤ 0.0001, compared to littermate controls. b, Increased proliferation observed in the duodenum of K-rasG12Dint mice was decreased following butyrate supplementation. c, Expression of differentiation markers and mucins in the duodenum (HFD: LSL-K-rasG12D/+ controls n=3, K-rasG12Dint mice n=4; HFD+Butyrate: LSL-K-rasG12D/+ controls n=3, K-rasG12Dint mice n=3). _P_-values were determined by one-way ANOVA and adjusted for the number of comparisons with the Bonferroni method. Error bars indicate s.e.m. *P ≤ 0.05, **P ≤ 0.001. #P ≤ 0.05, ##P ≤ 0.001, compared to littermate controls. d, Butyrate employed systemic effects and protected K-rasG12Dint mice and littermate controls against HFD-induced hyperinsulinemia (n=5 per group). Data were assessed by t-test and _P_-values were adjusted for multiple testing. Error bars indicate s.e.m. *P ≤ 0.05, **P ≤ 0.001, ***P ≤ 0.0001. e, Butyrate treatment did not affect H3 or H4 acetylation (n= 3–8). Data was assessed with one-way ANOVA and _P_-values were adjusted for the number of comparisons with the Bonferroni method. Error bars indicate s.e.m. Results were not significant.
Extended Data Figure 9
a, Following one week of antibiotic cocktail treatment, approximately 7 week-old K-rasG12Dint mice and littermate controls were gavaged three times a week with fresh stool pellets from HFD-fed mutants (24 weeks on HFD on the day of first transfer) for a total of 15 weeks on ND. H&E staining of duodenum samples from three gavaged K-rasG12Dint mice show mSA-LGD and HGD, as well as invasive carcinoma development. b, LEfSe results showed bacteria that were statistically different among K-rasG12Dint mice fed on ND, gavaged or not with stool samples from HFD K-rasG12Dint donors. Helicobacteraceae, Enterococcaceae and Deferribacteraceae became more abundant in the colon following stool transfer (K-rasG12Dint mice+ND n=3, K-rasG12Dint mice+ND+Stool n=6). c, FACS analysis of cells from PP and MLN showed antigen presentation on CD11c+ DCs. (ND: LSL-K-rasG12D/+ controls n=2, K-rasG12Dint mice n=2; ND+Stool: LSL-K-rasG12D/+ controls n=3, K-rasG12Dint mice n=8). _P_-values were determined by one-way ANOVA and adjusted for the number of comparisons with the Bonferroni method. Error bars indicate s.e.m. #P ≤ 0.05, compared to littermate controls. d, Glucose clearance in K-rasG12Dint mice and littermate controls (n=5 per group) on ND transferred with stool samples from HFD-fed K-rasG12Dint donors during a GTT. Results were analyzed by t-test. _P_-values were adjusted for multiple testing. Error bars indicate s.e.m. The differences were not significant.
Extended Data Figure 10
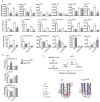
a, The expression profiles of selected genes involved in antigen recognition, immune response, immune cell recruitment, differentiation markers and mucins in duodenum samples from LSL-K-rasG12D/+ and K-rasG12Dint littermate animals. (ND: LSL-K-rasG12D/+ controls n=3, K-rasG12Dint mice n=3; ND+Stool: LSL-K-rasG12D/+ controls n=3, K-rasG12Dint mice n=5). _P_-values were determined by one-way ANOVA and adjusted for the number of comparisons with the Bonferroni method. Error bars indicate s.e.m. ***P ≤ 0.0001. #P ≤ 0.05, ##P ≤ 0.001, ###P ≤ 0.0001, compared to littermate controls. b, FACS analysis of MLN cells indicates recruitment and antigen presentation on CD11c+ DCs following treatment with antibiotics. (HFD: LSL-K-rasG12D/+ controls n=2, K-rasG12Dint mice n=2; HFD+Abx: LSL-K-rasG12D/+ controls n=5, K-rasG12Dint mice n=7). _P_-values were determined by one-way ANOVA and adjusted for the number of comparisons with the Bonferroni method. Error bars indicate s.e.m. ***P = 0.0001. Results are not significant. c, Mechanistic scheme suggests HFD-induced changes in bacterial community, SCFA levels, and alterations in mucin profiles cooperate with oncogene-associated decreased host immunity, which collectively enhance carcinogenesis in the small intestine.
Figure 1. HFD accelerates cancer progression
a, Experimental scheme shows when and how long special diet was applied before final analysis. b, Histological scores show tumor incidence in the small intestine under HFD regimen. Each point represents one animal and lines indicate mean (ND: LSL-K-rasG12D/+ controls n=5, K-rasG12Dint mice n=6; HFD: LSL-K-rasG12D/+ controls n=13, K-rasG12Dint mice n=16). The scores were assessed using two-sided Fisher test and adjustments on pairwise t-tests were made using the single-step method. *P = 0.05. c, Histology of small intestine from K-rasG12Dint mice during mSA development and comparison to human serrated route. TSA-LGIEN, typical serrated adenoma with low-grade intraepithelial neoplasm; TSA-HGIEN, typical serrated adenoma with high-grade intraepithelial neoplasm. d, Gene expression profiles of representative top candidate genes analyzed by microarray analysis in duodenum samples from littermate LSL-K-rasG12D/+ controls and K-rasG12Dint mutants after ND or HFD (n=3 per group). _P_-values were obtained from the moderated t-statistic and corrected for multiple testing with the Benjamini–Hochberg method. e, Representative flow cytometric analysis showing MHC class II expression in CD11c+ and CD11b+ cell populations from lamina propria (LP) in littermate mice.
Figure 2. Diet-induced tumor progression is associated with altered microbial community
a, LEfSe results show bacteria that were statistically different among K-rasG12Dint mice on ND and HFD and indicated the effect size of each differentially abundant bacteria in the small intestine (ND: n=3; HFD: n=8) and b, colon (ND: n=3; HFD: n=7).
Figure 3. Butyrate supplementation, but not prebiotics, confers protection against HFD-induced tumorigenesis
a, Experimental scheme indicates additional nutritional supplementation during HFD and the time point for data analysis. Histological scores of the small intestine in K-rasG12Dint mice on HFD (n=16) compared to that of after arabinogalactan (LSL-K-rasG12D/+ controls n=5, K-rasG12Dint mice n=5), GOS (LSL-K-rasG12D/+ controls n=10, K-rasG12Dint mice n=12) and butyrate (LSL-K-rasG12D/+ controls n=6, K-rasG12Dint mice n=7) supplementation. Each point represents one animal and lines indicate mean. The scores were assessed using one-way ANOVA and adjustments on pairwise t-tests were made using the single-step method. *P ≤ 0.05. not significant, ns. b, LEfSe results show bacteria that were statistically different among K-rasG12Dint mice on HFD treated (n=5) or not (n=8) with butyrate and indicated the effect size of each differentially abundant bacteria in the small intestine. c, The expression profiles of selected top candidate genes involved in antigen recognition, immune response, and immune cell recruitment in duodenum samples from LSL-K-rasG12D/+ controls and littermate K-rasG12Dint animals (n=3 per group). _P_-values were obtained from the moderated t-statistic and corrected for multiple testing with the Benjamini–Hochberg method. d, FACS analysis of LP cells from LSL-K-rasG12D/+ control and K-rasG12Dint littermate animals on HFD treated with (LSL-K-rasG12D/+ controls n=4, K-rasG12Dint mice n=7) or without (LSL-K-rasG12D/+ controls n=2, K-rasG12Dint mice n=2) butyrate. _P_-values were determined by one-way ANOVA and adjusted for the number of comparisons with the Bonferroni method. Error bars indicate s.e.m. *P ≤ 0.05.
Figure 4. Disease-associated bacteria can be transmitted to healthy K-rasG12Dint animals and antibiotic treatment completely abolishes tumorigenesis
a, Experimental scheme indicates stool transfer from HFD-fed donors, that were on the diet regimen for already 24 weeks at the time of experiment, to healthy 7-week old K-rasG12Dint recipients on ND following one week of antibiotic treatment. Histological score of the small intestine suggested delivery of disease-associated microbiota and increased tumor incidence in the recipient K-rasG12Dint mice (LSL-K-rasG12D/+ controls n=6, K-rasG12Dint mice n=11). Each point represents one animal and lines indicate means. The scores were assessed using two-sided Fisher test and adjustments on pairwise t-tests were made using the single-step method. b, LEfSe results show bacteria that were statistically different among K-rasG12Dint mice that have received (n=6) or not (n=3) stool transfer on ND. Increased and decreased abundance of bacteria in K-rasG12Dint mice that received stool transfer are shown in green and red, respectively. c, FACS analysis of LP cells after stool transfer. _P_-values were determined by one-way ANOVA and adjusted for the number of comparisons with the Bonferroni method. Error bars indicate s.e.m. *P = 0.05, **P = 0.001, ***P = 0.0001. #P = 0.05, compared to littermate controls. d, Experimental scheme indicating the application of antibiotic regimen during the course of HFD and the time point for data analysis. Histological scores of the small intestine samples showed complete protection from tumor incidence in the K-rasG12Dint mice (HFD+Abx: LSL-K-rasG12D/+ controls n=7, K-rasG12Dint mice n=7). Each point represents one animal and lines indicate means. The scores were assessed using two-sided Fisher test and adjustments on pairwise t-tests were made using the single-step method. **P = 0.001. e, FACS analysis of cells from the LP showed recruitment and surface antigen presentation on CD11c+ DCs in disease-free K-rasG12Dint mice after treatment with antibiotics (LSL-K-rasG12D/+ controls n=5, K-rasG12Dint mice n=7). _P_-values were determined by one-way ANOVA and adjusted for the number of comparisons with the Bonferroni method. Error bars indicate s.e.m. The differences were not significant.
Comment in
- Nutrition: high-fat diet and dysbiosis accelerate tumorigenesis in mice.
Greenhill C. Greenhill C. Nat Rev Endocrinol. 2014 Nov;10(11):638. doi: 10.1038/nrendo.2014.164. Epub 2014 Sep 16. Nat Rev Endocrinol. 2014. PMID: 25223646 No abstract available. - Bugs and food: a recipe for cancer?
Ohland CL, Jobin C. Ohland CL, et al. Cell Metab. 2014 Dec 2;20(6):937-8. doi: 10.1016/j.cmet.2014.11.010. Cell Metab. 2014. PMID: 25470545 Free PMC article.
Similar articles
- Bugs and food: a recipe for cancer?
Ohland CL, Jobin C. Ohland CL, et al. Cell Metab. 2014 Dec 2;20(6):937-8. doi: 10.1016/j.cmet.2014.11.010. Cell Metab. 2014. PMID: 25470545 Free PMC article. - Nutrition: high-fat diet and dysbiosis accelerate tumorigenesis in mice.
Greenhill C. Greenhill C. Nat Rev Endocrinol. 2014 Nov;10(11):638. doi: 10.1038/nrendo.2014.164. Epub 2014 Sep 16. Nat Rev Endocrinol. 2014. PMID: 25223646 No abstract available. - High-fat diet-induced dysbiosis mediates MCP-1/CCR2 axis-dependent M2 macrophage polarization and promotes intestinal adenoma-adenocarcinoma sequence.
Liu T, Guo Z, Song X, Liu L, Dong W, Wang S, Xu M, Yang C, Wang B, Cao H. Liu T, et al. J Cell Mol Med. 2020 Feb;24(4):2648-2662. doi: 10.1111/jcmm.14984. Epub 2020 Jan 19. J Cell Mol Med. 2020. PMID: 31957197 Free PMC article. - Impact of high-fat diet on the intestinal microbiota and small intestinal physiology before and after the onset of obesity.
Araújo JR, Tomas J, Brenner C, Sansonetti PJ. Araújo JR, et al. Biochimie. 2017 Oct;141:97-106. doi: 10.1016/j.biochi.2017.05.019. Epub 2017 May 29. Biochimie. 2017. PMID: 28571979 Review. - [Physiological patterns of intestinal microbiota. The role of dysbacteriosis in obesity, insulin resistance, diabetes and metabolic syndrome].
Halmos T, Suba I. Halmos T, et al. Orv Hetil. 2016 Jan 3;157(1):13-22. doi: 10.1556/650.2015.30296. Orv Hetil. 2016. PMID: 26708682 Review. Hungarian.
Cited by
- Metabolism and Colorectal Cancer.
Sedlak JC, Yilmaz ÖH, Roper J. Sedlak JC, et al. Annu Rev Pathol. 2023 Jan 24;18:467-492. doi: 10.1146/annurev-pathmechdis-031521-041113. Epub 2022 Nov 2. Annu Rev Pathol. 2023. PMID: 36323004 Free PMC article. Review. - High Fat Diets Induce Colonic Epithelial Cell Stress and Inflammation that is Reversed by IL-22.
Gulhane M, Murray L, Lourie R, Tong H, Sheng YH, Wang R, Kang A, Schreiber V, Wong KY, Magor G, Denman S, Begun J, Florin TH, Perkins A, Cuív PÓ, McGuckin MA, Hasnain SZ. Gulhane M, et al. Sci Rep. 2016 Jun 28;6:28990. doi: 10.1038/srep28990. Sci Rep. 2016. PMID: 27350069 Free PMC article. - A Transcriptomic Study of the Tail Fat Deposition in Two Types of Hulun Buir Sheep According to Tail Size and Sex.
Fan H, Hou Y, Sahana G, Gao H, Zhu C, Du L, Zhao F, Wang L. Fan H, et al. Animals (Basel). 2019 Sep 5;9(9):655. doi: 10.3390/ani9090655. Animals (Basel). 2019. PMID: 31491862 Free PMC article. - The Gut Microbiota (Microbiome) in Cardiovascular Disease and Its Therapeutic Regulation.
Rahman MM, Islam F, -Or-Rashid MH, Mamun AA, Rahaman MS, Islam MM, Meem AFK, Sutradhar PR, Mitra S, Mimi AA, Emran TB, Fatimawali, Idroes R, Tallei TE, Ahmed M, Cavalu S. Rahman MM, et al. Front Cell Infect Microbiol. 2022 Jun 20;12:903570. doi: 10.3389/fcimb.2022.903570. eCollection 2022. Front Cell Infect Microbiol. 2022. PMID: 35795187 Free PMC article. Review. - Effects of XIAP on high fat diet-induced hepatic steatosis: a mechanism involving NLRP3 inflammasome and oxidative stress.
Zilu S, Qian H, Haibin W, Chenxu G, Deshuai L, Qiang L, Linfeng H, Jun T, Minxuan X. Zilu S, et al. Aging (Albany NY). 2019 Dec 16;11(24):12177-12201. doi: 10.18632/aging.102559. Epub 2019 Dec 16. Aging (Albany NY). 2019. PMID: 31841118 Free PMC article.
References
- Giovannucci E, Michaud D. The role of obesity and related metabolic disturbances in cancers of the colon, prostate, and pancreas. Gastroenterology. 2007;132:2208–2225. - PubMed
- Zimmet P, Alberti KG, Shaw J. Global and societal implications of the diabetes epidemic. Nature. 2001;414:782–787. - PubMed
Publication types
MeSH terms
Substances
LinkOut - more resources
Full Text Sources
Other Literature Sources
Medical
Molecular Biology Databases
Research Materials
Miscellaneous


