Hippocampal proliferation is increased in presymptomatic Parkinson's disease and due to microglia - PubMed (original) (raw)
Hippocampal proliferation is increased in presymptomatic Parkinson's disease and due to microglia
Karlijn J Doorn et al. Neural Plast. 2014.
Abstract
Besides dopamine-deficiency related motor symptoms, nonmotor symptoms, including cognitive changes occur in Parkinson's disease (PD) patients, that may relate to accumulation of α-synuclein in the hippocampus (HC). This brain region also contains stem cells that can proliferate. This is a well-regulated process that can, for example, be altered by neurodegenerative conditions. In contrast to proliferation in the substantia nigra and subventricular zone, little is known about the HC in PD. In addition, glial cells contribute to neurodegenerative processes and may proliferate in response to PD pathology. In the present study, we questioned whether microglial cells proliferate in the HC of established PD patients versus control subjects or incidental Lewy body disease (iLBD) cases as a prodromal state of PD. To this end, proliferation was assessed using the immunocytochemical marker minichromosome maintenance protein 2 (MCM2). Colocalization with Iba1 was performed to determine microglial proliferation. MCM2-positive cells were present in the HC of controls and were significantly increased in the presymptomatic iLBD cases, but not in established PD patients. Microglia represented the majority of the proliferating cells in the HC. This suggests an early microglial response to developing PD pathology in the HC and further indicates that neuroinflammatory processes play an important role in the development of PD pathology.
Figures
Figure 1
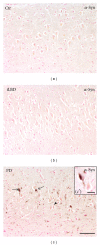
_α_-Synuclein pathology present in the hippocampus of PD cases. (a-b) _α_-Synuclein immunoreactivity (IR) in CA of control and iLBD subjects is absent compared to (c) _α_-synuclein IR (LBs: arrow, LNs: arrowhead) in the CA region of PD patients; bar (a–c) = 100 _μ_m; higher magnification (c′) bar = 20 _μ_m.
Figure 2
MCM2-positive cells in the hippocampal CA3 region of an iLBD case. High magnification of MCM2 IR reveals clear examples of doublets (arrows). The MCM2-positive cell indicated with the arrowhead is closely opposed to a large pyramidal neuron; bar = 25 _μ_m.
Figure 3
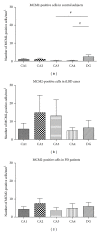
MCM2-positive cell numbers in control subjects, iLBD cases, and PD patients. Semiquantitative analysis revealed that in (a) control subjects, a significant main effect was present (P = 0.034; related nonparametric Friedman's analysis) with higher numbers of MCM2-positive cells in the DG compared to the hippocampal subregions (DG versus CA3 and CA4 # P = 0.043; DG versus CA1 P = 0.08 n.s.; DG versus CA2 P = 0.225 n.s.; nonparametric paired Wilcoxon post hoc test). (b, c) In the iLBD and PD cases, no differences were present between any of the subregions. Significance reached at alpha of P ≤ 0.02, FWE-corrected. Data represent mean ± SEM.
Figure 4
MCM2-positive cell numbers in the total HC and different hippocampal subregions. (a) The total number of MCM2-positive cells in the HC was significantly higher in iLBD cases compared to control subjects (*P = 0.004; nonparametric Mann-Whitney U test). (b–f) Comparing MCM2 IR per HC subregion between the 3 different groups revealed a significant increase in number of proliferating cells in hippocampal areas (d) CA3 and (e) CA4 (resp., *P = 0.001, *P = 0.003; nonparametric Mann-Whitney U test) of iLBD cases versus control subjects. Significance reached at alpha of P ≤ 0.016, Bonferroni-corrected. Data represent mean ± SEM.
Figure 5
Colocalization of the majority of MCM2-positive cells with Iba1 in the hippocampal CA3 region of control subjects, iLBD cases and PD patients. (a–f) Representative confocal laser scanning microscopical images of double-immunofluorescent stained sections revealed that the majority of the MCM2-positive cells show colocalization with the microglial marker Iba1 (arrows in (c), (f), (i) and (j), and (k) and (l)). Iba1-positive microglia are depicted in green (a, d, and g) and MCM2 in red (b, e, and h). (j–l) Higher magnification of colocalization (l) between Iba1-positive microglia ((j), green) and MCM2 ((k), red); bar (a–i) = 40 _μ_m; (j–l) = 10 _μ_m.
Figure 6
Colocalization of the majority of MCM2-positive cells with Iba1 in the hippocampal DG region of control subjects, iLBD cases, and PD patients. (a–f) Representative confocal laser scanning microscopical images of double-immunofluorescent stained sections revealed that the majority of the MCM2-positive cells show colocalization with the microglial marker Iba1 (arrows in (c), (f), and (i)). (b, d) Control subject shows one MCM2-positive cell with no colocalization with Iba1 (arrowhead). Iba1-positive microglia are depicted in green (a, d, and g) and MCM2 in red (b, e, and h); bar (a–i) = 40 _μ_m.
Similar articles
- Microglial phenotypes and toll-like receptor 2 in the substantia nigra and hippocampus of incidental Lewy body disease cases and Parkinson's disease patients.
Doorn KJ, Moors T, Drukarch B, van de Berg WDj, Lucassen PJ, van Dam AM. Doorn KJ, et al. Acta Neuropathol Commun. 2014 Aug 7;2:90. doi: 10.1186/s40478-014-0090-1. Acta Neuropathol Commun. 2014. PMID: 25099483 Free PMC article. - Nitrated alpha-synuclein-activated microglial profiling for Parkinson's disease.
Reynolds AD, Glanzer JG, Kadiu I, Ricardo-Dukelow M, Chaudhuri A, Ciborowski P, Cerny R, Gelman B, Thomas MP, Mosley RL, Gendelman HE. Reynolds AD, et al. J Neurochem. 2008 Mar;104(6):1504-25. doi: 10.1111/j.1471-4159.2007.05087.x. Epub 2007 Nov 22. J Neurochem. 2008. PMID: 18036154 - Loss of fragile X mental retardation protein precedes Lewy pathology in Parkinson's disease.
Tan Y, Sgobio C, Arzberger T, Machleid F, Tang Q, Findeis E, Tost J, Chakroun T, Gao P, Höllerhage M, Bötzel K, Herms J, Höglinger G, Koeglsperger T. Tan Y, et al. Acta Neuropathol. 2020 Feb;139(2):319-345. doi: 10.1007/s00401-019-02099-5. Epub 2019 Nov 25. Acta Neuropathol. 2020. PMID: 31768670 - Role of cytokines in inflammatory process in Parkinson's disease.
Sawada M, Imamura K, Nagatsu T. Sawada M, et al. J Neural Transm Suppl. 2006;(70):373-81. doi: 10.1007/978-3-211-45295-0_57. J Neural Transm Suppl. 2006. PMID: 17017556 Review. - [Clinical and pathological study on early diagnosis of Parkinson's disease and dementia with Lewy bodies].
Orimo S. Orimo S. Rinsho Shinkeigaku. 2008 Jan;48(1):11-24. doi: 10.5692/clinicalneurol.48.11. Rinsho Shinkeigaku. 2008. PMID: 18386627 Review. Japanese.
Cited by
- An assessment of the existence of adult neurogenesis in humans and value of its rodent models for neuropsychiatric diseases.
Duque A, Arellano JI, Rakic P. Duque A, et al. Mol Psychiatry. 2022 Jan;27(1):377-382. doi: 10.1038/s41380-021-01314-8. Epub 2021 Oct 19. Mol Psychiatry. 2022. PMID: 34667259 Free PMC article. Review. - Selective Upregulation by Theanine of Slc38a1 Expression in Neural Stem Cell for Brain Wellness.
Yoneda Y, Kawada K, Kuramoto N. Yoneda Y, et al. Molecules. 2020 Jan 15;25(2):347. doi: 10.3390/molecules25020347. Molecules. 2020. PMID: 31952134 Free PMC article. Review. - A balanced evaluation of the evidence for adult neurogenesis in humans: implication for neuropsychiatric disorders.
Duque A, Spector R. Duque A, et al. Brain Struct Funct. 2019 Sep;224(7):2281-2295. doi: 10.1007/s00429-019-01917-6. Epub 2019 Jul 5. Brain Struct Funct. 2019. PMID: 31278571 Free PMC article. Review. - Indomethacin promotes survival of new neurons in the adult murine hippocampus accompanied by anti-inflammatory effects following MPTP-induced dopamine depletion.
Hain EG, Sparenberg M, Rasińska J, Klein C, Akyüz L, Steiner B. Hain EG, et al. J Neuroinflammation. 2018 May 26;15(1):162. doi: 10.1186/s12974-018-1179-4. J Neuroinflammation. 2018. PMID: 29803225 Free PMC article. - Microglia in Alzheimer's disease.
Sarlus H, Heneka MT. Sarlus H, et al. J Clin Invest. 2017 Sep 1;127(9):3240-3249. doi: 10.1172/JCI90606. Epub 2017 Sep 1. J Clin Invest. 2017. PMID: 28862638 Free PMC article. Review.
References
- Alves G, Forsaa EB, Pedersen KF, Dreetz Gjerstad M, Larsen JP. Epidemiology of Parkinson’s disease. Journal of Neurology. 2008;255(5):18–32. - PubMed
- Grinberg LT, Rueb U, Alho ATDL, Heinsen H. Brainstem pathology and non-motor symptoms in PD. Journal of the Neurological Sciences. 2010;289(1-2):81–88. - PubMed
- Braak H, Rüb U, Del Tredici K. Cognitive decline correlates with neuropathological stage in Parkinson’s disease. Journal of the Neurological Sciences. 2006;248(1-2):255–258. - PubMed
Publication types
MeSH terms
Substances
LinkOut - more resources
Full Text Sources
Other Literature Sources
Medical
Miscellaneous


