Transforming growth factor β1 (TGF-β1) enhances expression of profibrotic genes through a novel signaling cascade and microRNAs in renal mesangial cells - PubMed (original) (raw)
Transforming growth factor β1 (TGF-β1) enhances expression of profibrotic genes through a novel signaling cascade and microRNAs in renal mesangial cells
Nancy E Castro et al. J Biol Chem. 2014.
Abstract
Increased expression of transforming growth factor-β1 (TGF-β1) in glomerular mesangial cells (MC) augments extracellular matrix accumulation and hypertrophy during the progression of diabetic nephropathy (DN), a debilitating renal complication of diabetes. MicroRNAs (miRNAs) play key roles in the pathogenesis of DN by modulating the actions of TGF-β1 to enhance the expression of profibrotic genes like collagen. In this study, we found a significant decrease in the expression of miR-130b in mouse MC treated with TGF-β1. In parallel, there was a down-regulation in miR-130b host gene 2610318N02RIK (RIK), suggesting host gene-dependent expression of this miRNA. TGF-β receptor 1 (TGF-βR1) was identified as a target of miR-130b. Interestingly, the RIK promoter contains three NF-Y binding sites and was regulated by NF-YC. Furthermore, NF-YC expression was inhibited by TGF-β1, suggesting that a signaling cascade, involving TGF-β1-induced decreases in NF-YC, RIK, and miR-130b, may up-regulate TGF-βR1 to augment expression of TGF-β1 target fibrotic genes. miR-130b was down-regulated, whereas TGF-βR1, as well as the profibrotic genes collagen type IV α 1 (Col4a1), Col12a1, CTGF, and PAI-1 were up-regulated not only in mouse MC treated with TGF-β1 but also in the glomeruli of streptozotocin-injected diabetic mice, supporting in vivo relevance. Together, these results demonstrate a novel miRNA- and host gene-mediated amplifying cascade initiated by TGF-β1 that results in the up-regulation of profibrotic factors, such as TGF-βR1 and collagens associated with the progression of DN.
Keywords: Collagen; Diabetes; Kidney; MicroRNA (miRNA); Signaling.
© 2014 by The American Society for Biochemistry and Molecular Biology, Inc.
Figures
FIGURE 1.
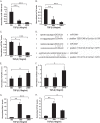
Decreased expression of miR-130b and let-7b in TGF-β1-treated MMC. A–C, quantitative PCR analysis of miR-130b, let-7b, and miR-30e* expression levels in SD MMC treated without or with 10 ng/ml TGF-β1 for 6 and 24 h. D, schematic representation of miR-30e* seed sequence alignment and Col12a1 3′-UTR. E–H, _TGF-β_R1, Col12a1, PAI-1, and CTGF mRNA levels were measured in MMC at 6 and 24 h of TGF-β1 treatment. _TGF-β_R1 and Col12a1 expression levels were significantly increased at 24 h of TGF-β1 treatment, whereas PAI-1 and CTGF mRNA levels were increased at both time periods. Results for miRNAs were normalized with internal control 18 S. *, **, and ***, p < 0.05, p < 0.005, and p < 0.0005, respectively, versus SD control condition. Expression of other genes were normalized to CypA internal control. Results shown are mean ± S.E. (error bars) (n = 3). *, **, and ***, p < 0.05, p < 0.005, and p < 0.0005, respectively, versus SD control condition.
FIGURE 2.
TGF-β1 induces TGF-βR1 expression via down-regulation of miR-130b and let-7b. A, schematic diagram showing several 3′-UTR luciferase reporter constructs, which include WT-TGF-βR1 3′-UTR (with WT intact let-7b and miR-130b target sites), Mut-miR-130b binding site, Mut-let-7b binding site, and double mutant (DM; where both miR-130b and let-7b binding sites have been mutated). B, schematic representation of miR-130b seed sequence alignment to the TGF-βR1 3′-UTR. C, luciferase reporter assays using WT-TGF-βR1 3′-UTR in MMC transfected with miR-130b mimic (M) or miR-130b inhibitor (I). Transfection with miR-130b-M decreased WT-TGF-βR1 3′-UTR activity; conversely, WT-TGF-βR1 3′-UTR reporter activity was increased with miR-130b-I relative to negative control (NC). D, luciferase reporter assay in cells co-transfected with WT-TGF-βR1 3′-UTR or Mut-let-7b with either negative control mimic (NC-M) or let-7b mimic (M) in the presence or absence of 10 ng/ml TGF-β1 for 24 h in MMC. E, luciferase reporter assays in MMC transfected with WT-TGF-βR1 3′-UTR, Mut-let7b, Mut-130b, or double mutant in the presence or absence of TGF-β1 for 24 h. F, MMC transfected with miR-130del mutant elicited higher basal activity and greater TGF-β1-induced activity compared with WT- TGF-βR1. G, luciferase reporter assay in cells co-transfected with WT-TGF-βR1 3′-UTR and either NC-M, let-7b-M, 130b-M, or double mimic (D-M; where both let-7b-M and 130b-M were transfected) and in cells with Mut-let-7b co-transfected with NC-M or 130b-M. H, luciferase reporter assays showing increased basal and TGF-β1-induced TGF-βR1 3′-UTR activity in MMC co-transfected with the double mutant construct and either NC-M, 130b-M, or let-7b-M compared with WT control. Results shown are mean ± S.E. (error bars) (n = 3). *, **, and ***, p < 0.05, p < 0.005, and p < 0.0005, respectively, versus WT or NC-M conditions.
FIGURE 3.
miR-130b and let-7b down-regulate endogenous TGF-βR1 and Col4a1. A and C, MMC transfected with 130b-M, let-7b-M, or double mimic (Double-M) display a TGF-β1-induced decrease of _TGF-β_R1 (A) and Col4a1 mRNA (C) expression compared with NC-M. B, similar to mRNA results, TGF-βR1 protein expression levels were significantly reduced with exogenous miR-130b-M, let-7b-M, and double-mimic conditions. D, TGF-β1-induced _TGF-β_R1 and Col4a1 mRNA levels were reduced in MMC transfected with TGF-βR1 siRNA oligonucleotides compared with NC siRNA oligonucleotides. E, MMC transfected with NC-I, 130b-I, let-7b-I, or double inhibitor (Double-I; where 130-I and let-7b-I were both transfected) resulted in increased _TGF-β_R1 mRNA expression when miR-130b alone or in combination with let-7b (double inhibitor condition) was blocked. F, schematic model depicting miR-130b and let-7b directly binding to TGF-βR1 3′-UTR to regulate _TGF-β_R1 and other downstream profibrotic genes, such as Col4a1, CTGF, and PAI-1. Results shown are mean ± S.E. (error bars) (n = 3 except Western blot (n = 2)). * and **, p < 0.05 and p < 0.005, respectively, versus NC conditions.
FIGURE 4.
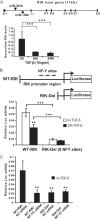
NF-YC regulates the promoter of the miR-130b host gene. A, quantitative PCR analysis of RIK expression levels in SD MMC treated without or with 10 ng/ml TGF-β1 for 6 and 24 h. RIK mRNA levels were significantly decreased throughout the time course. miR-130b gene location reveals that it forms a cluster with miR-301b between exon 1 and exon 2 of the RIK host gene. B, WT-RIK luciferase promoter construct depicting three NF-Y sites located −200, −240, and −285 bp upstream of the transcription start site of the RIK gene. The RIK-Del construct lacks these three NF-Y sites. MMC were transfected with WT-RIK or RIK-Del constructs and treated with or without TGF-β1 for 24 h. C, MMC were co-transfected with WT-RIK or RIK-Del and either NC siRNA (20 n
m
) or NF-YC siRNA (20 n
m
) oligonucleotides. WT-RIK promoter activity was significantly reduced with NF-YC siRNA compared with the NC siRNA condition. The RIK-Del construct showed very little activity with or without NF-YC siRNA. Mean ± S.E. (error bars) (n = 3). ** and ***, p < 0.005 and p < 0.0005, respectively, versus WT, NC, or SD conditions.
FIGURE 5.
NF-YC regulates RIK and other downstream components. A–C, MMC transfected with NF-YC siRNA showed a significant decrease in basal and TGF-β1-induced mRNA expression of NF-YC and other downstream components (namely RIK and miR-130b) compared with the NC siRNA condition. D, conversely, basal levels of _TGF-β_R1 mRNA expression were up-regulated in the presence of NF-YC siRNA. E, schematic diagram depicting how decreased expression of NF-YC in response to TGF-β1 leads to reduced binding of NF-YC to the CCAAT domains (NF-Y sites) within the RIK promoter, thereby decreasing RIK transcriptional activity and consequently decreasing the expression of miR-130b located within the RIK gene, ultimately resulting in increased TGF-βR1 expression. Mean ± S.E. (error bars) (n = 3). *, **, and ***, p < 0.05, p < 0.005, and p < 0.0005, respectively, versus NC conditions.
FIGURE 6.
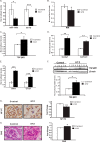
Expression of miR-130b and key parameters of DN in glomeruli of diabetic mice. A and B, glomeruli were isolated from kidney cortical tissues from six mice in the control group and nine mice in the STZ-diabetic group. miR-130b, let-7b, and RIK mRNA expression levels were significantly decreased in glomeruli of STZ-injected diabetic mice (STZ) (4 weeks of diabetes) compared with vehicle-injected (Control) mice. C–E, conversely, _TGF-β_R1, Col4a1, Col12a1, PAI-1, and CTGF mRNA expression levels were significantly increased in glomeruli of these diabetic mice compared with control non-diabetic mice. Results shown are mean ± S.E. (error bars) (n = 3). *, **, and ***, p < 0.05, p < 0.005, and p < 0.0005, respectively, versus control conditions. Results were normalized to CypA internal control for regular genes and 18 S internal control for miRNAs. F, protein lysates were made from renal cortical tissues of STZ mice and control mice. TGF-βR1 protein expression levels were increased under diabetic conditions compared with control. β-Actin was used as a loading control for protein lysates. G, representative NF-YC immunostaining images and quantification using NF-YC antibody in cortical tissue from STZ-injected diabetic mice and control mice. NF-YC protein expression was significantly reduced in the STZ mice glomeruli compared with control mice. H, representative PAS staining images and quantification using cortical tissue from STZ-injected diabetic mice and control mice. Significantly increased PAS staining was observed in diabetic mice compared with control mice. Results shown are mean ± S.E. * and ***, p < 0.05 and p < 0.0005 (n = 50 glomeruli counted/condition). Scale bar, 20 μm.
FIGURE 7.
Schematic model. Under diabetic conditions where TGF-β1 levels are increased, NF-YC expression is down-regulated (possibly via up-regulated miR-216a), resulting in reduced binding of NF-YC to the NF-Y sites (CCAAT) within the RIK promoter. Alternatively, miR-216a can target and down-regulate Ybx1, which can result in reduced binding of Ybx1 to Y-box (CCAAT) within the RIK promoter. Decreased RIK promoter activity leads to reduced transcriptional activity of the RIK gene, thereby attenuating miR-130b expression, because miR-130b expression is dependent upon transcriptional activity of the host gene, RIK. This feed-forward amplifying cascade results in elevated expression of TGF-βR1 and subsequently other downstream profibrotic and ECM genes involved in mediating the progression of diabetic nephropathy, such as Col4a1, CTGF, and PAI-1. Down-regulation of miR-30e* might be a consequence of reduced NF-YC, a putative host gene for miR-30e* that can potentially target Col12a1.
Similar articles
- Repression of let-7 by transforming growth factor-β1-induced Lin28 upregulates collagen expression in glomerular mesangial cells under diabetic conditions.
Park JT, Kato M, Lanting L, Castro N, Nam BY, Wang M, Kang SW, Natarajan R. Park JT, et al. Am J Physiol Renal Physiol. 2014 Dec 15;307(12):F1390-403. doi: 10.1152/ajprenal.00458.2014. Epub 2014 Oct 29. Am J Physiol Renal Physiol. 2014. PMID: 25354942 Free PMC article. - A microRNA circuit mediates transforming growth factor-β1 autoregulation in renal glomerular mesangial cells.
Kato M, Arce L, Wang M, Putta S, Lanting L, Natarajan R. Kato M, et al. Kidney Int. 2011 Aug;80(4):358-68. doi: 10.1038/ki.2011.43. Epub 2011 Mar 9. Kidney Int. 2011. PMID: 21389977 Free PMC article. - Transforming growth factor-β1-mediated renal fibrosis is dependent on the regulation of transforming growth factor receptor 1 expression by let-7b.
Wang B, Jha JC, Hagiwara S, McClelland AD, Jandeleit-Dahm K, Thomas MC, Cooper ME, Kantharidis P. Wang B, et al. Kidney Int. 2014 Feb;85(2):352-61. doi: 10.1038/ki.2013.372. Epub 2013 Oct 2. Kidney Int. 2014. PMID: 24088962 - TGF-β1-p53 cooperativity regulates a profibrotic genomic program in the kidney: molecular mechanisms and clinical implications.
Higgins CE, Tang J, Mian BM, Higgins SP, Gifford CC, Conti DJ, Meldrum KK, Samarakoon R, Higgins PJ. Higgins CE, et al. FASEB J. 2019 Oct;33(10):10596-10606. doi: 10.1096/fj.201900943R. Epub 2019 Jul 6. FASEB J. 2019. PMID: 31284746 Free PMC article. Review. - MicroRNA circuits in transforming growth factor-β actions and diabetic nephropathy.
Kato M, Natarajan R. Kato M, et al. Semin Nephrol. 2012 May;32(3):253-60. doi: 10.1016/j.semnephrol.2012.04.004. Semin Nephrol. 2012. PMID: 22835456 Free PMC article. Review.
Cited by
- Krüppel-like factor 4 modulates the miR-101/COL10A1 axis to inhibit renal fibrosis after AKI by regulating epithelial-mesenchymal transition.
Zhao J, Wang X, Wu Y, Zhao C. Zhao J, et al. Ren Fail. 2024 Dec;46(1):2316259. doi: 10.1080/0886022X.2024.2316259. Epub 2024 Feb 12. Ren Fail. 2024. PMID: 38345033 Free PMC article. - Nox4-SH3YL1 complex is involved in diabetic nephropathy.
Lee SR, Lee HE, Yoo JY, An EJ, Song SJ, Han KH, Cha DR, Bae YS. Lee SR, et al. iScience. 2024 Jan 11;27(2):108868. doi: 10.1016/j.isci.2024.108868. eCollection 2024 Feb 16. iScience. 2024. PMID: 38318360 Free PMC article. - Neonatal hyperoxia induces activated pulmonary cellular states and sex-dependent transcriptomic changes in a model of experimental bronchopulmonary dysplasia.
Xia S, Vila Ellis L, Winkley K, Menden H, Mabry SM, Venkatraman A, Louiselle D, Gibson M, Grundberg E, Chen J, Sampath V. Xia S, et al. Am J Physiol Lung Cell Mol Physiol. 2023 Feb 1;324(2):L123-L140. doi: 10.1152/ajplung.00252.2022. Epub 2022 Dec 20. Am J Physiol Lung Cell Mol Physiol. 2023. PMID: 36537711 Free PMC article. - Novel biomarkers for prognosticating diabetic kidney disease progression.
Swaminathan SM, Rao IR, Shenoy SV, Prabhu AR, Mohan PB, Rangaswamy D, Bhojaraja MV, Nagri SK, Nagaraju SP. Swaminathan SM, et al. Int Urol Nephrol. 2023 Apr;55(4):913-928. doi: 10.1007/s11255-022-03354-7. Epub 2022 Oct 22. Int Urol Nephrol. 2023. PMID: 36271990 Free PMC article. Review. - STAT3/miR-130b-3p/MBNL1 feedback loop regulated by mTORC1 signaling promotes angiogenesis and tumor growth.
Li H, Liu P, Li D, Wang Z, Ding Z, Zhou M, Chen X, Miao M, Ding J, Lin W, Liu Y, Zha X. Li H, et al. J Exp Clin Cancer Res. 2022 Oct 11;41(1):297. doi: 10.1186/s13046-022-02513-z. J Exp Clin Cancer Res. 2022. PMID: 36217202 Free PMC article.
References
- Inui M., Martello G., Piccolo S. (2010) MicroRNA control of signal transduction. Nat. Rev. Mol. Cell Biol. 11, 252–263 - PubMed
- Ziyadeh F. N. (1993) The extracellular matrix in diabetic nephropathy. Am. J. Kidney Dis. 22, 736–744 - PubMed
Publication types
MeSH terms
Substances
LinkOut - more resources
Full Text Sources
Other Literature Sources
Medical
Molecular Biology Databases
Miscellaneous


