A breast cancer stem cell niche supported by juxtacrine signalling from monocytes and macrophages - PubMed (original) (raw)
. 2014 Nov;16(11):1105-17.
doi: 10.1038/ncb3041. Epub 2014 Sep 28.
Affiliations
- PMID: 25266422
- PMCID: PMC4296514
- DOI: 10.1038/ncb3041
A breast cancer stem cell niche supported by juxtacrine signalling from monocytes and macrophages
Haihui Lu et al. Nat Cell Biol. 2014 Nov.
Erratum in
- Addendum: A breast cancer stem cell niche supported by juxtacrine signalling from monocytes and macrophages.
Lu H, Clauser KR, Tam WL, Fröse J, Ye X, Eaton EN, Reinhardt F, Donnenberg VS, Bhargava R, Carr SA, Weinberg RA. Lu H, et al. Nat Cell Biol. 2015 Dec;17(12):1607. doi: 10.1038/ncb3281. Nat Cell Biol. 2015. PMID: 26612575 No abstract available.
Abstract
The cell-biological program termed the epithelial-mesenchymal transition (EMT) confers on cancer cells mesenchymal traits and an ability to enter the cancer stem cell (CSC) state. However, the interactions between CSCs and their surrounding microenvironment are poorly understood. Here we show that tumour-associated monocytes and macrophages (TAMs) create a CSC niche through juxtacrine signalling with CSCs. We performed quantitative proteomic profiling and found that the EMT program upregulates the expression of CD90, also known as Thy1, and EphA4, which mediate the physical interactions of CSCs with TAMs by directly binding with their respective counter-receptors on these cells. In response, the EphA4 receptor on the carcinoma cells activates Src and NF-κB. In turn, NF-κB in the CSCs induces the secretion of a variety of cytokines that serve to sustain the stem cell state. Indeed, admixed macrophages enhance the CSC activities of carcinoma cells. These findings underscore the significance of TAMs as important components of the CSC niche.
Figures
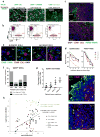
Figure 1. Quantitative proteomic profiling identified EMT-induced membrane protein changes in HMECs
(a) Expression ratios of proteins detected in the mesenchymal HMLE-Twist cells over the epithelial HMLE-vector cells plotted for two biological replicate experiments. Ratios highlighted in red were found to be significantly differentially expressed (p<0.05) after standardizing and applying a moderated T-test corrected by the Benjamini Hochberg method. Gene names were labeled for known EMT marker proteins and candidates that were followed up in this study. (b) The HMLE, HMLE-Twist and HMLE-Snail cells were stained with anti-CD90 and anti-CD24 antibodies and analyzed by flow cytometry. The percentage of the CD90hiCD24− population was shown on each plot. (c,d) The cells were FACS sorted based on CD90 and CD24 levels and seeded into 3D mammosphere medium. The numbers of mammospheres were plotted (c), and representative pictures of mammospheres formed by the indicated cell populations are shown (d). n= 3 independent experiments. *** p<0.001; **** p<0.0001 (Student’s t-test). Source data provided in Supplementary Table 7.
Figure 2. Enrichment of CD90 protein on the cell surface of EMT/stem-like cells
(a) HMLE-Ras cells were FACS-separated and then injected orthotopically into NOD-SCID mice in a limiting dilution assay. The tumor initiation rates are shown, with the estimated CSC-frequency displayed for the bulk and the CD90hiCD24− populations. N.D., not determined. (b,c) H&E staining comparing xenograft tumors (b) and lungs (c) of mice receiving injections from the bulk and CD90hiCD24− HMLER cells. Black arrows (c) indicate macro-metastasis from the CD90hiCD24− tumors. The numbers of macro-metastases per lung are shown in (d; n=5 mice). (e,f) Correlation of CD90 level in patient tumors with relapse-free survival. High CD90 expression (red line) was significantly correlated with poor prognosis in ER− (H; n=457, p=1.7×10⁻⁵) and ER+ (I; n=1413, p=0.013) breast cancer patients. The plots were generated using
(probe: 213869_x_at). (g) HMLER90hi cells with or without shCD90 were injected orthotopically into mice and the tumor size were measured weekly during a course of 50 days. n=10 mice. Knockdown of CD90 by the shRNA was confirmed by flow cytometry analysis (Supplementary Fig. 2h). All error bars shown indicate S.E.M. * p<0.05; ** p<0.01; *** p<0.001 (Student’s t-test).
Figure 3. CD90 serves as an anchor for the adherence of monocytes and macrophages
(a) THP1-RFP monocytes were cocultured with monolayer HMLER-GFP cells. Monocytes that did not adhere to the HMLER monolayer were washed away after 1 hr and the adherent cells were imaged and then quantified by flow cytometry based on GFP and RFP expression. Representative images (a) and flow cytometry profiles (b) are shown. The ratios of the adhered monocytes to the HMLER cells were calculated from the flow-cytometry quantitation in panel (b); data presented as mean ± s.e.m. (c) Immunofluorescence (IF) staining of CD90 (red) and F4/80 (green) in HMLER90hi xenograft tumors. The dotted lines delineate the border between the tumor cells and stroma. Scale bar: 0.1mm. (d) Quantitation of CD90 signal and F4/80 signal intensity from tumor edge to center. n=5 tumors. (e) 60x confocal images of primary patient breast tumor sections co-stained for CD90+ CSCs (red) and CD68+ TAMs (green) showed juxtaposed CSC-TAM pairs. (f,g) Numbers of CD90high CSCs (f) or CD90−CTK+ non-CSCs with or without adjacent TAMs were counted from 3–6 representative fields of 20x or 25x images (n=4 patients). The percentages shown indicate the proportion of cancer cells with adjacent TAMs. Error bars indicate S.E.M. Source data for g provided in Supplementary Table 7. (h) The numbers of CD90+CTK+, CD90+CTK−, CD90−CTK+ cancer cells and CD68+ macrophages in the same microscopic field (0.6 mm2) were quantified from 25 core biopsy sections. The number of CD90+CTK− CSCs correlates with the number of CD68+ TAMs. The CD90+ endothelial cells and fibroblasts were excluded from the cancer cell counts based on morphology. (i) Typical images showing infiltration of CD68+ TAMs into the CD90+ CSC-rich areas but not the CD90−CTK+ cancer cell islands.
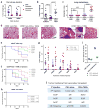
Figure 4. Macrophages enhance tumor initiation by the CD90hi CSC-like cells
(a) CD90hi CSCs were mixed with PBS- or clodronate- liposomes and orthotopically implanted into Nude mice (n=10 per group). Data were pooled from 2 independent experiments, each assessing 5 mice per group. The tumors were harvested 50 days later and weighed. (b) 105 HMLER90hi cells were injected either alone or co-mixed with 5×10⁴ human monocytes (huMono) or mice TAMs, into the mammary fat pads of female Nude mice. n=9,12,12 mice (left to right). Reduced amount of Matrigel was used for the injection mix. The tumor weight was measured after 5 weeks. Data from 3 independent experiments were pooled and plotted. (c,d) Naturally arising MMTV-PyMT tumors were dissociated and tumor cells were sorted based on CD90 expression, whereas TAMs were isolated by F4/80 expression. 3x10⁵ CD90+ or CD90− tumor cells were orthotopically transplanted into syngeneic wildtype Fvb mice with or without comixed 1.5x10⁵ TAMs. (c) The numbers of lung macro-metastases from tumor-bearing mice were quantified and normalized to primary tumor weight (per gram), shown as metastatic index. Data were pooled from 3 independent experiments. n=13,14,14,14 mice from left to right (15 mice were injected for each group, but not all mice developed tumors; see Supplementary Fig. 4d). (d) H&E staining of the lungs of tumor-bearing mice. (e–g) CD90hi CSCs were injected alone (e) or with admixed TAMs (f) at limiting dilution orthotopically (n=10 mice per group). Data were pooled from 2 independent experiments, each assessing 5 mice per group. Tumor incidence was determined by weekly palpation, and tumors were harvested and weighed at 50 days post injection (g). (h) CD90lo non-CSCs were injected alone or with admixed TAMs orthotopically but no tumor formed. Data were pooled from 2 independent experiments, each assessing 5 mice per group. (i,j) HMLER90hi cells injected alone or together with TAMs were allowed to grow in the mammary fat pads of NOD-SCID mice for 3 weeks; the tumor cells were then harvested and seeded for tumorsphere forming assay (i; presents data from 4 technical replicates) or injected as secondary tumor transplants into recipient NOD-SCID mice (j) to measure tumor-initiating capability. Data shown are from one experiment out of two biological replicates; source data provided in Supplementary Table 7 (i,j). Error bars indicate S.E.M. * p<0.05; *** p<0.001; *** p<0.0001 (Student’s t-test for a,b,g and one way ANOVA for c).
Figure 5. Monocytes induce cytokine production in the CSCs upon contact
(a) Induction of cytokine mRNA in the HMLER90hi or HMLER90lo cells when cocultured with the THP1 monocytes for indicated time. HMLER90hi-memb, an indirect coculture where the two cell types were separated by a cell-impermeable insert. Data from one experiment was shown as averages of three technical replicates. Two biological replicates were performed. (b) ELISA measurement of the secreted cytokines from the coculture. n=3 independent experiments. Error bars indicate S.E.M. Source data shown in Supplementary Table 7. (c) Cytokine mRNA fold-change stimulated by THP1 monocytes (relative to corresponding no monocytes control) in the epithelial HMLE, mesenchymal HMLE-Twist, HMLE-Slug CD90hiCD24−, HMLER90hi cells and HMLER90hi with shCD90. (d,e) Cytokine mRNA fold-changes in the HMLE-derived cells stimulated by mouse primary macrophages (d) or human blood monocytes (e). The HMLER90hi-IκBmut cells lacking NF-κB activation showed no cytokine production. Typical data shown from one experiment out of 3 (a,b) and 2 (c–e) biological replicates, only technical replicate data are plotted. Source data provided in Supplementary Table 7.
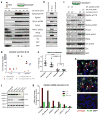
Figure 6. EphA4 mediates signal transduction in the CSCs upon stimulation by the monocytes
(a) Phospho- and total-protein levels of EphA4 as well as downstream proteins PLCγ1, PKCδ and Src in the two cocultured cell types were detected by western blot. GFP and RFP were only detected in the corresponding cell populations with minimum cross-contamination. Numbers above each lane indicate minutes of coculture. Phospho-EphA4 was detected with an antibody that non-discriminatively recognizes the phosphorylated forms of EphA3, 4 and 5. (b) Indirect coculture (membrane) with monocytes did not lead to activation of EphA4 and downstream proteins in the CSCs. (c) Treatment of HMLER90hi cells with an EphA4-specific inhibitor peptide KYL prior to and during coculture with monocytes resulted in decreased phosphorylation. A scrambled peptide (KYL-P7A) served as control. The largely diminished phosphorylation level with KYL treatment indicated that the signals detected by the phospho-EphA3/4/5 antibody were mostly from activated EphA4. The numbers below each panel are the intensities of the bands quantified using Fiji software and normalized to GFP (bottom panel) of the corresponding samples. (d) Cytokine secretion from coculture treated with KYL or KYL-P7A was measured by ELISA. Technical replicate data are plotted. Source data provided in Supplementary Table 7. (e) 1x10⁵ HMLER90hi parental cells or HMLER90hi with sh-Luciferase or sh-EphA4 were orthotopically implanted into NOD-SCID mice. n=8 mice (Data were pooled from 2 independent experiments, each assessing 4 mice per group). The tumors were harvested 40 days after implantation and weighed. **** p<0.0001 (One way ANOVA). Error bars indicate S.D. (f) Western blots measuring levels of knockdown with 2 pairs of shRNA each for PLCγ1 and PKCδ in the HMLER90hi cells. (g) Cytokine mRNA induction in the HMLER90hi cells with PLCγ1 and PKCδ knockdown. Technical replicate data are presented as mRNA fold-changes in the HMLER90hi cells upon monocyte coculture. Source data provided in Supplementary Table 7. (h) IF staining of xenograft tumors with antibodies against phopho-PLCγ1 (Tyr783) and F4/80. White arrowheads point to the phospho-PLCγ1+ cells (red) surrounded by F4/80+ TAMs (green). Areas with no TAMs showed no phopho-PLCγ1 signals (bottom panel).
Figure 7. NF-κB activation is required for monocytes-stimulated cytokine production in the CSCs
(a) The mRNA levels and (b) secreted cytokine concentrations of IL-6, IL-8 and GM-CSF in the HMLER90hi parental cells and the NF-κB super-repressor-expressing cells (HMLER90hi-IκB-mut) with or without monocyte coculture were measured by Q-PCR and ELISA. n=3 biological replicates (with 3 technical repeats each). Source data provided in Supplementary Table 7. Error bars indicate S.E.M. (c) The HMLER90hi cells, alone or in coculture with monocytes (the latter was removed prior to cell harvest), were lysed and fractionated to obtain the cytosolic and nucleus extracts. NF-κB subunits were immunoblotted to show the nuclear translocation. GAPDH and SV40-LgT served as cytosolic and nucleus protein controls. (d) The IκBα mutant-expressing HMLER90hi cells (CSC-Ikb-mut) were injected, either alone (□) or co-mixed with human monocytes (huMono, □) or with mice TAMs (□), into the mammary fat pads of female Nude mice. Tumor weight was measured after 7 weeks and data from 2 independent experiments were pooled. n=8,12,12,10,10 mice (left to right). Error bars indicate S.E.M. (e) IF staining of tumors from HMLER90hi CSCs alone or CSCs+TAMs with antibodies against cleaved caspase 3 (apoptosis marker) and Ki67 (proliferation marker). (f) The endogenous Twist proteins were immunoprecipitated from the HMLER90hi cells, and then immunoblotted for NF-κB subunit p50 to demonstrate complex formation. (g) Binding of both Twist and NF-κB at the promoters of IL6, IL8 and CSF2 (GM-CSF) in the HMLER90hi cells alone or in coculture was measured by ChIP-PCR. Data was represented as fold-enrichment of binding to the specific segments relative to background average. The positions of probes were illustrated below the graphs. Data plotted are technical replicates. Source data from two biological replicates are provided in Supplementary Table 7. (h) A depiction of the signaling transduction pathway in a CSC when stimulated by a monocyte/macrophage.
Similar articles
- Induction of protumoral CD11c(high) macrophages by glioma cancer stem cells through GM-CSF.
Kokubu Y, Tabu K, Muramatsu N, Wang W, Murota Y, Nobuhisa I, Jinushi M, Taga T. Kokubu Y, et al. Genes Cells. 2016 Mar;21(3):241-51. doi: 10.1111/gtc.12333. Epub 2016 Jan 25. Genes Cells. 2016. PMID: 26805963 - Basal/HER2 breast carcinomas: integrating molecular taxonomy with cancer stem cell dynamics to predict primary resistance to trastuzumab (Herceptin).
Martin-Castillo B, Oliveras-Ferraros C, Vazquez-Martin A, Cufí S, Moreno JM, Corominas-Faja B, Urruticoechea A, Martín ÁG, López-Bonet E, Menendez JA. Martin-Castillo B, et al. Cell Cycle. 2013 Jan 15;12(2):225-45. doi: 10.4161/cc.23274. Epub 2012 Jan 15. Cell Cycle. 2013. PMID: 23255137 Free PMC article. - Pterostilbene, a bioactive component of blueberries, suppresses the generation of breast cancer stem cells within tumor microenvironment and metastasis via modulating NF-κB/microRNA 448 circuit.
Mak KK, Wu AT, Lee WH, Chang TC, Chiou JF, Wang LS, Wu CH, Huang CY, Shieh YS, Chao TY, Ho CT, Yen GC, Yeh CT. Mak KK, et al. Mol Nutr Food Res. 2013 Jul;57(7):1123-34. doi: 10.1002/mnfr.201200549. Epub 2013 Mar 15. Mol Nutr Food Res. 2013. PMID: 23504987 - Concise review: breast cancer stem cells: regulatory networks, stem cell niches, and disease relevance.
Guo W. Guo W. Stem Cells Transl Med. 2014 Aug;3(8):942-8. doi: 10.5966/sctm.2014-0020. Epub 2014 Jun 5. Stem Cells Transl Med. 2014. PMID: 24904174 Free PMC article. Review. - Cancer Stem Cells and Macrophages: Implications in Tumor Biology and Therapeutic Strategies.
Sainz B Jr, Carron E, Vallespinós M, Machado HL. Sainz B Jr, et al. Mediators Inflamm. 2016;2016:9012369. doi: 10.1155/2016/9012369. Epub 2016 Feb 14. Mediators Inflamm. 2016. PMID: 26980947 Free PMC article. Review.
Cited by
- Signaling pathways in the regulation of cancer stem cells and associated targeted therapy.
Manni W, Min W. Manni W, et al. MedComm (2020). 2022 Oct 5;3(4):e176. doi: 10.1002/mco2.176. eCollection 2022 Dec. MedComm (2020). 2022. PMID: 36226253 Free PMC article. Review. - Functional and prognostic significance of long non-coding RNA MALAT1 as a metastasis driver in ER negative lymph node negative breast cancer.
Jadaliha M, Zong X, Malakar P, Ray T, Singh DK, Freier SM, Jensen T, Prasanth SG, Karni R, Ray PS, Prasanth KV. Jadaliha M, et al. Oncotarget. 2016 Jun 28;7(26):40418-40436. doi: 10.18632/oncotarget.9622. Oncotarget. 2016. PMID: 27250026 Free PMC article. - Identification of key pathways and genes shared between Crohn's disease and breast cancer using bioinformatics analysis.
Zhou J, Yang R. Zhou J, et al. Oncol Lett. 2020 Oct;20(4):119. doi: 10.3892/ol.2020.11981. Epub 2020 Aug 13. Oncol Lett. 2020. PMID: 32863932 Free PMC article. - The soluble glycoprotein NMB (GPNMB) produced by macrophages induces cancer stemness and metastasis via CD44 and IL-33.
Liguori M, Digifico E, Vacchini A, Avigni R, Colombo FS, Borroni EM, Farina FM, Milanesi S, Castagna A, Mannarino L, Craparotta I, Marchini S, Erba E, Panini N, Tamborini M, Rimoldi V, Allavena P, Belgiovine C. Liguori M, et al. Cell Mol Immunol. 2021 Mar;18(3):711-722. doi: 10.1038/s41423-020-0501-0. Epub 2020 Jul 29. Cell Mol Immunol. 2021. PMID: 32728200 Free PMC article. - Tumor-associated macrophages in anti-PD-1/PD-L1 immunotherapy for hepatocellular carcinoma: recent research progress.
Li Z, Duan D, Li L, Peng D, Ming Y, Ni R, Liu Y. Li Z, et al. Front Pharmacol. 2024 Jun 18;15:1382256. doi: 10.3389/fphar.2024.1382256. eCollection 2024. Front Pharmacol. 2024. PMID: 38957393 Free PMC article. Review.
References
- Huber MA, Kraut N, Beug H. Molecular requirements for epithelial-mesenchymal transition during tumor progression. Curr Opin Cell Biol. 2005;17:548–558. - PubMed
- Thiery JP, Acloque H, Huang RY, Nieto MA. Epithelial-mesenchymal transitions in development and disease. Cell. 2009;139:871–890. - PubMed
Publication types
MeSH terms
Substances
Grants and funding
- P01 CA080111/CA/NCI NIH HHS/United States
- P30 CA047904/CA/NCI NIH HHS/United States
- P30 CA014051/CA/NCI NIH HHS/United States
- P30CA047904/CA/NCI NIH HHS/United States
- U54 CA163109/CA/NCI NIH HHS/United States
- P01-CA080111/CA/NCI NIH HHS/United States
- R01 CA078461/CA/NCI NIH HHS/United States
- U24CA160034/CA/NCI NIH HHS/United States
- U54-CA163109/CA/NCI NIH HHS/United States
- R01-CA078461/CA/NCI NIH HHS/United States
- U24 CA160034/CA/NCI NIH HHS/United States
LinkOut - more resources
Full Text Sources
Other Literature Sources
Medical
Molecular Biology Databases
Research Materials
Miscellaneous


