Nanoscale stiffness topography reveals structure and mechanics of the transport barrier in intact nuclear pore complexes - PubMed (original) (raw)
Nanoscale stiffness topography reveals structure and mechanics of the transport barrier in intact nuclear pore complexes
Aizhan Bestembayeva et al. Nat Nanotechnol. 2015 Jan.
Abstract
The nuclear pore complex (NPC) is the gate for transport between the cell nucleus and the cytoplasm. Small molecules cross the NPC by passive diffusion, but molecules larger than ∼5 nm must bind to nuclear transport receptors to overcome a selective barrier within the NPC. Although the structure and shape of the cytoplasmic ring of the NPC are relatively well characterized, the selective barrier is situated deep within the central channel of the NPC and depends critically on unstructured nuclear pore proteins, and is therefore not well understood. Here, we show that stiffness topography with sharp atomic force microscopy tips can generate nanoscale cross-sections of the NPC. The cross-sections reveal two distinct structures, a cytoplasmic ring and a central plug structure, which are consistent with the three-dimensional NPC structure derived from electron microscopy. The central plug persists after reactivation of the transport cycle and resultant cargo release, indicating that the plug is an intrinsic part of the NPC barrier. Added nuclear transport receptors accumulate on the intact transport barrier and lead to a homogenization of the barrier stiffness. The observed nanomechanical properties in the NPC indicate the presence of a cohesive barrier to transport and are quantitatively consistent with the presence of a central condensate of nuclear pore proteins in the NPC channel.
Figures
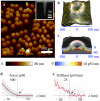
Figure 1. NPCs imaged and probed by AFM
a, Tapping-mode AFM image of the cytoplasmic side of an isolated nuclear envelope. Inset: Electron microscopy image of a supersharp AFM tip. b, AFM-image representing the un-indented cytoplasmic surface of a single NPC, reconstructed from a force spectroscopy measurement. The red line marks the cytoplasmic ring structure, and yellow lines define shells that are concentric with it. c, Rotationally symmetrized surface (grey scale) based on the image in b. The blue-to-red colour scale represents a vertical cross section showing the rotationally averaged local stiffness −∂F(r, z)/∂z that was experienced by the probe on and in the NPC. The plain grey area denotes indentation depths for which insufficient force data were available. d, Force (grey dots) as a function of tip-sample separation for lateral positions with radii r < 0.2 R inside the NPC, where R is the average radius of the cytoplasmatic ring. The red curve is the average of the force data, and the arrow indicates the contact point. The blue and black dashed lines correspond to fits with indentation models for a spherical and a conical tip, respectively (see Supplementary Eqs. 2-3). e, Stiffness as a function of tip-sample separation for radial positions r < 0.2 R inside the NPC.
Figure 2. Structure and nanomechanical properties of NPCs
a, Confocal microscopy of isolated Xenopus laevis nuclei washed in buffer without (Control) or with Ran-/E-mix. Rch1-IBB-MBP-GFP (“IBB-GFP”) was added to the nuclei before treatment, and accumulated in the nuclei upon addition of Ran-/E-mix, while 70 kDa dextran remained excluded, indicating that the nuclei were intact. b, Confocal microscopy images of nuclear envelopes isolated from nuclei washed in buffer without (Control) or with Ran-/E-mix, and (the nuclear envelopes) subsequently exposed to Benzonase (“Benz.”). Nucleic acids were labelled with SYBR Gold, and fluorescent wheat germ agglutinin (WGA) was used to label NPCs. Scale bars in a, b: 400 μm. c, Quantification of IBB-GFP fluorescent signal in the nuclei (n = 15 for control and n = 16 for Ran-/E-mix data, with standard errors of the mean). d, Quantification of the SYBR Gold fluorescent signal at the nuclear envelopes, normalized to the WGA signal (n = 11 for control and n = 10 for Ran-/E-mix+Benz. data, with standard errors of the mean) for samples treated as described in a, b. e, Western blot from isolated nuclear envelopes showing a reduction of RNP K/J and IBB-GFP following Ran-/E-mix and Benzonase treatment; Nup153 was used as a loading control. f, Averaged stiffness cross sections of NPCs following washes without (Control) and with Ran-/E-mix and Benzonase. Black, dashed lines indicate the averaged profiles of the un-indented NPC surface. The same data are also shown as stiffness (in pN/nm) versus vertical position (z), for different radial positions, offset for clarity. g, Averaged stiffness cross sections of NPCs measured before (Control) and after 10 minutes incubation of the isolated nuclear envelopes with 0.5 μM importin β (Impβ). Number of NPCs in each data set: n = 33 (f, Control); n = 36 (f, Ran-/E-mix+Benz.); n = 35 (g, Control); n = 40 (g, Impβ). Colour scale: 0-10 pN/nm (f); 0-16 pN/nm (g).
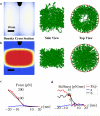
Figure 3. Nups modelled as interacting polymers in a cylindrical geometry
a-b, Left column: Density cross sections for interacting polymers (see text) in a nanopore configuration that approximately mimics the NPC channel geometry (with AFM tip in black). Results are shown for interpolymer bead-bead pair attractions with decay length 1 nm and strengths of 0.02 and 0.05 kBT for a and b, respectively. Centre and right columns: Side and top views of the approximate polymer configurations corresponding to the calculated polymer density profiles. c-d, Calculated force and stiffness curves for a supersharp AFM tip indenting the polymer assemblies as displayed in a (blue curve) and b (black curve), compared to the experimental curves averaged from control data (red, “Exp”, n = 107 NPCs). z = 0 refers to the contact point in the experimental data; the z offset of the theoretical data was adjusted to achieve the best match to the experimental data.
Similar articles
- Cryo-electron tomography provides novel insights into nuclear pore architecture: implications for nucleocytoplasmic transport.
Stoffler D, Feja B, Fahrenkrog B, Walz J, Typke D, Aebi U. Stoffler D, et al. J Mol Biol. 2003 Apr 18;328(1):119-30. doi: 10.1016/s0022-2836(03)00266-3. J Mol Biol. 2003. PMID: 12684002 - Atomic force microscopy visualises a hydrophobic meshwork in the central channel of the nuclear pore.
Kramer A, Liashkovich I, Ludwig Y, Shahin V. Kramer A, et al. Pflugers Arch. 2008 Apr;456(1):155-62. doi: 10.1007/s00424-007-0396-y. Epub 2007 Dec 4. Pflugers Arch. 2008. PMID: 18060562 - Activation of ryanodine receptors in the nuclear envelope alters the conformation of the nuclear pore complex.
Erickson ES, Mooren OL, Moore-Nichols D, Dunn RC. Erickson ES, et al. Biophys Chem. 2004 Dec 1;112(1):1-7. doi: 10.1016/j.bpc.2004.06.010. Biophys Chem. 2004. PMID: 15501570 - Biomechanics of the transport barrier in the nuclear pore complex.
Stanley GJ, Fassati A, Hoogenboom BW. Stanley GJ, et al. Semin Cell Dev Biol. 2017 Aug;68:42-51. doi: 10.1016/j.semcdb.2017.05.007. Epub 2017 May 12. Semin Cell Dev Biol. 2017. PMID: 28506890 Review. - Structural dynamics of the nuclear pore complex.
Sakiyama Y, Panatala R, Lim RYH. Sakiyama Y, et al. Semin Cell Dev Biol. 2017 Aug;68:27-33. doi: 10.1016/j.semcdb.2017.05.021. Epub 2017 Jun 1. Semin Cell Dev Biol. 2017. PMID: 28579449 Review.
Cited by
- Visualization of Au Nanoparticles Buried in a Polymer Matrix by Scanning Thermal Noise Microscopy.
Yao A, Kobayashi K, Nosaka S, Kimura K, Yamada H. Yao A, et al. Sci Rep. 2017 Feb 17;7:42718. doi: 10.1038/srep42718. Sci Rep. 2017. PMID: 28210001 Free PMC article. - The capsid revolution.
Taylor IA, Fassati A. Taylor IA, et al. J Mol Cell Biol. 2024 Apr 10;15(11):mjad076. doi: 10.1093/jmcb/mjad076. J Mol Cell Biol. 2024. PMID: 38037430 Free PMC article. Review. - Lost in Transportation: Nucleocytoplasmic Transport Defects in ALS and Other Neurodegenerative Diseases.
Kim HJ, Taylor JP. Kim HJ, et al. Neuron. 2017 Oct 11;96(2):285-297. doi: 10.1016/j.neuron.2017.07.029. Neuron. 2017. PMID: 29024655 Free PMC article. Review. - A physical model describing the interaction of nuclear transport receptors with FG nucleoporin domain assemblies.
Zahn R, Osmanović D, Ehret S, Araya Callis C, Frey S, Stewart M, You C, Görlich D, Hoogenboom BW, Richter RP. Zahn R, et al. Elife. 2016 Apr 8;5:e14119. doi: 10.7554/eLife.14119. Elife. 2016. PMID: 27058170 Free PMC article. - Atomic Force Microscopy for Structural and Biophysical Investigations on Nuclear Pore Complexes.
Liashkovich I, Rosso G, Shahin V. Liashkovich I, et al. Methods Mol Biol. 2022;2502:299-310. doi: 10.1007/978-1-0716-2337-4_20. Methods Mol Biol. 2022. PMID: 35412247
References
- Fahrenkrog B, Aebi U. The nuclear pore complex: nucleocytoplasmic transport and beyond. Nat. Rev. Mol. Cell Biol. 2003;4:757–766. - PubMed
- Alber F, et al. The molecular architecture of the nuclear pore complex. Nature. 2007;450:695–701. - PubMed
- Beck M, Lucic V, Forster F, Baumeister W, Medalia O. Snapshots of nuclear pore complexes in action taken by cryoelectron tomography. Nature. 2007;449:611–615. - PubMed
- Hoelz A, Debler EW, Blobel G. Structure of the nuclear pore complex. Annu. Rev. Biochem. 2011;80:613–643. - PubMed
Publication types
MeSH terms
Grants and funding
- BB/G011729/1/BB_/Biotechnology and Biological Sciences Research Council/United Kingdom
- 083810/Z/07/Z/WT_/Wellcome Trust/United Kingdom
- 083810/WT_/Wellcome Trust/United Kingdom
- WT_/Wellcome Trust/United Kingdom
- G0900950/MRC_/Medical Research Council/United Kingdom
LinkOut - more resources
Full Text Sources
Other Literature Sources


