Activated type 2 innate lymphoid cells regulate beige fat biogenesis - PubMed (original) (raw)
Activated type 2 innate lymphoid cells regulate beige fat biogenesis
Min-Woo Lee et al. Cell. 2015.
Abstract
Type 2 innate lymphoid cells (ILC2s), an innate source of the type 2 cytokines interleukin (IL)-5 and -13, participate in the maintenance of tissue homeostasis. Although type 2 immunity is critically important for mediating metabolic adaptations to environmental cold, the functions of ILC2s in beige or brown fat development are poorly defined. We report here that activation of ILC2s by IL-33 is sufficient to promote the growth of functional beige fat in thermoneutral mice. Mechanistically, ILC2 activation results in the proliferation of bipotential adipocyte precursors (APs) and their subsequent commitment to the beige fat lineage. Loss- and gain-of-function studies reveal that ILC2- and eosinophil-derived type 2 cytokines stimulate signaling via the IL-4Rα in PDGFRα(+) APs to promote beige fat biogenesis. Together, our results highlight a critical role for ILC2s and type 2 cytokines in the regulation of adipocyte precursor numbers and fate, and as a consequence, adipose tissue homeostasis. PAPERCLIP:
Copyright © 2015 Elsevier Inc. All rights reserved.
Figures
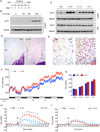
Figure 1. IL-33 promotes growth of functional beige fat in thermoneutral mice
(A) Schematic for cytokine administration and metabolic analysis in thermoneutral mice. (B) Immunoblotting for UCP1 in the scWAT of thermoneutral C57BL/6J administered various doses of IL-33 over 8 days (n=2–3 per treatment dose). (C) Immunoblotting for UCP1 in the scWAT and BAT of thermoneutral mice administered IL-33, IL-13 or IL-4 for 8 days (n=3 per cytokine treatment). (D, E) Representative sections of scWAT from thermoneutral C57BL/6J mice administered Vehicle (Veh) or IL-33 were stained with hematoxylin and eosin. (D) 100× magnification, (E) 400× magnification. (F) Cold-induced changes in oxygen consumption in thermoneutral C57BL/6J mice administered Vehicle (Veh) or IL-33 over 8 days (n=4–5 per treatment). (G) Oxygen consumption rate at various temperatures of C57BL/6J mice treated with Veh or IL-33 (n=4–5 per treatment). (H, I) Norepinephrine stimulated changes in oxygen consumption (VO2) in conscious, thermoneutral C57BL/6J (H) and _Ucp1_−/− mice that were pretreated with vehicle (Veh) or IL-33 for 8 days (n=5 per genotype and treatment). Data are represented as mean ± SEM.
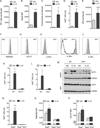
Figure 2. IL-33 stimulates proliferation and commitment of adipocyte precursors to the beige fat lineage
(A, B) Quantification of ILC2 numbers (A) and activation status (B) in the scWAT of thermoneutral, heterozygous Red5 (Il5Red5/+) mice that were administered vehicle (Veh) or IL-33 for 8 days. Expression of IL-5 (td Tomato) from the Red5 allele was used as a marker of ILC2 activation (n=9–10 per treatment). (C) Quantification of eosinophils in the scWAT of thermoneutral heterozygous Red5 (Il5Red5/+) mice that were administered Veh or IL-33 for 8 days (n=8–10 per treatment). (D) Quantification of adipocyte precursor (AP) proliferation in the scWAT of thermoneutral Il5Red5/+ mice administered Veh or IL-33 for 8 days, as assessed by intracellular staining for Ki67 (D) and AP cell number per fat pad (n=8–10 per treatment). (F, G) Expression of beige adipocyte markers TMEM26 and CD137 on the scWAT APs of thermoneutral Il5Red5/+ mice administered Veh or IL-33 for 8 days (n=8–10 per treatment). Representative histograms for TMEM26 (F) and CD137 (G) are shown; clear histogram-Veh, shaded histogram-IL-33. (H–J) Expression of IL1RLI (H), IL-5Rα (I), and IL-4Rα (J) on scWAT APs of mice. For IL1RL1 (H), the clear histogram represents WT APs, while the shaded represents _Il1rl1_−/− APs. For IL-5Rα (I), the dashed line histogram represents isotype, the solid line represents APs stained for IL-5Rα, and the shaded histogram represents eosinophils stained for IL-5Rα. For IL-4Rα (J), the solid line histogram represents isotype and the shaded histogram represents APs stained for IL-4Rα. (K, L) Quantification of IL-33 induced AP proliferation in the scWAT _of 114/13_−/− (K) and _Il4ra_−/− (L) mice (n=4–8 per genotype and treatment). (M) Immunoblotting for UCP1 in the scWAT and BAT of thermoneutral WT and _Il4ra_−/− mice administered IL-33 for 8 days (n=2–3 per genotype and treatment). (N–P) Quantification of AP proliferation (N), TMEM26 (O) and CD137 (P) expression in _Rag2_−/− and _Rag2_−/− _Il2rgc_−/− mice treated with IL-33 (n=6–8 per genotype and treatment). Data are represented as mean ± SEM. See also Figure S1 and S2.
Figure 3. Type 2 cytokine signaling controls physiologic expansion of adipocyte precursors
(A) Age-dependent proliferation of adipocyte precursors (APs) in the scWAT of C57BL/6J mice as assessed by intracellular staining for Ki67 (n=4–5 per age). (B) Age-dependent incorporation of BrdU by scWAT APs in C57BL/6J mice (n=4–5 per age). (C) Quantification of pSTAT6 levels in scWAT APs of C57BL/6J mice at different ages (n=10–l1 per age). (D) Quantification of IL-4-producing cells in the scWAT of 4get mice at different ages. GFP expression marks cells competent for production of IL-4 (n=5 per age). (E–J) Quantification of Ki67+ (E, G, I) and total APs (F, H, J) in scWAT of 5 week-old ΔdblGATA (E, F), _Il4/13_−/− (G, H), and _Il4r_α−/− (I, J) mice (n=5–10 per genotype). Data are represented as mean ± SEM. See also Figure S3.
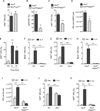
Figure 4. IL-4Rα signaling in PDGFRα+ cells promotes expansion of adipocyte precursors
(A) Quantification of scWAT adipocyte precursor (AP) proliferation in 5 week-old Il4raf/f and Il4raf/f/Lyz2Cre mice (n=8–10 per genotype). (B) Analysis of IL-4-induced phosphorylation of STAT6 (pSTAT6) in scWAT APs of Il4raf/f and Il4raf/f PdgfraCre mice (n=3–4 per genotype). (C–D) Quantification of scWAT AP proliferation by Ki67 staining (C) and total number (D) in 5 week-old Il4raf/f and Il4raf/f PdgfraCre mice (n=7–12). (E) Quantification of scWAT AP proliferation by Ki67 staining in 8–10 week old C57BL/6J mice at 24 and 48 hours after injection with vehicle or IL-4 (n=5 per time point). (F, H) BrdU incorporation by the scWAT APs of wild type and _Il4ra_−/− mice (F) or Il4raf/f and Il4raf/f/PdgfraCre mice (H) 48 hours after administration of IL-4 (n=6–8 per genotype and treatment). (G) Quantification of scWAT AP proliferation by Ki67 staining 48 hours after administration of vehicle or IL-13 (n=6–8 per genotype and treatment). (I) Quantification of scWAT AP number in Il4raf/f and Il4raf/f/PdgfraCre mice 48 hours after administration of vehicle or IL-4 (n=7 per genotype). (J) APs purified from wild type and _Il4ra_−/− mice were stimulated with IL-4, and cellular proliferation was quantified by intracellular staining for Ki67 48 hours later (n=4 per genotype and treatment). (K) Quantification of scWAT AP proliferation in Il4raf/f and Il4raf/f/PdgfraCre mice 48 hours after administration of vehicle or IL-33 (n=8–10 per genotype and treatment). Data are represented as mean ± SEM. See also Figure S4.
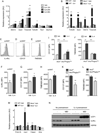
Figure 5. IL-4 and IL-13 direct commitment of PDGFRα+ adipocyte precursors to beige adipogenic precursors
(A) Quantitative RT-PCR analysis of beige adipocyte precursor markers in APs purified from the scWAT of C57BL/6J stimulated with vehicle or IL-4 (n=3 per condition and time point; data presented as mean ± SD). (B) Quantitative RT-PCR analysis of beige adipocyte precursor markers in APs purified from Balb/cJ or _Il4ra_−/− mice that were stimulated with vehicle or IL-4 for 48 hours (n=3 per genotype and treatment; data presented as mean ± SD). (C–E) Flow cytometric analysis of IL-4Rα (C), CD137 (D) and TMEM26 (E) expression in scWAT APs of mice injected with vehicle or IL-4. Clear histogram: vehicle; shaded histogram: IL-4. (F–H) Quantification of IL-4Rα, CD137, and TMEM26 expression in scWAT APs 48 hours after administration of vehicle or IL-4 (n=5 per treatment). (I, J) Quantification of CD137 and TMEM26 expression in the scWAT APs of Il4raf/f and Il4raf/f/PdgfraCre mice 48 hours after administration of IL-4 (n=4–6 per genotype and treatment). (K, L) Quantification of CD137 and TMEM26 expression in the scWAT APs of 5 week-old Il4raf/f and Il4raf/f/PdgfraCre mice (n=8–12 per genotype). (M) Quantitative RT-PCR analysis of beige/brown adipocyte genes after in vitro differentiation of scWAT APs purified from Balb/cJ or _Il4ra_−/− mice (n=3 per genotype and treatment; data presented as mean ± SD). (N) Immunoblot analysis for UCP1 and IL-4Rα in _in vitro_-differentiated APs. MDI refers to stimulation of differentiation by adipogenic cocktail, (n=3 genotype and treatment). Unless otherwise indicated, data are represented as mean ± SEM. See also Figure S5 and S6.
Figure 6. IL-4Rα signaling in adipocyte precursors directs growth of beige fat
(A) Representative sections of scWAT from 5 week-old Il4raf/f and Il4raf/f/PdgfraCre mice were stained with hematoxylin and eosin. 100× magnification (top panels), 400× magnification (bottom panels). (B) UCP1 protein expression in scWAT and BAT of 5 week-old Il4raf/f and Il4raf/f/PdgfraCre mice housed at 22°C (n=3 per genotype). (C–F) Assessment of metabolic rate, food intake, and activity in 5-week-old Il4raf/f and Il4raf/f/PdgfraCre mice housed at 22°C (n=8 per genotype); (C) oxygen consumption (VO2), (D) RER, (E) food intake, and (F) total activity. Data are represented as mean ± SEM.
Figure 7. IL-4Rα signaling in mature adipocytes is dispensable for growth of beige fat
(A) Histological analysis of scWAT of 5-week-old Il4raf/f and Il4raf/f/AdipoqCre mice housed at 22°C. Representative sections were stained with hematoxylin and eosin, and images are shown at 100× magnification (top panels) and 400× magnification (bottom panels). (B) Immunoblot analysis of UCP1 protein expression in scWAT and BAT of 5-week-old Il4raf/f and Il4raf/f/AdipoqCre mice. (C–F) Assessment of energy expenditure in 5 week-old Il4raf/f and Il4raf/f/AdipoqCre mice was performed using CLAMS; (C) oxygen consumption (VO2), (D) RER, (E) food intake, and (F) total activity. Data are represented as mean ± SEM.
Comment in
- White, brown, and beige; type 2 immunity gets hot.
Uhm M, Saltiel AR. Uhm M, et al. Immunity. 2015 Jan 20;42(1):15-7. doi: 10.1016/j.immuni.2015.01.001. Immunity. 2015. PMID: 25607455 - Adipose tissue: ILC2 crank up the heat.
Flach M, Diefenbach A. Flach M, et al. Cell Metab. 2015 Feb 3;21(2):152-153. doi: 10.1016/j.cmet.2015.01.015. Cell Metab. 2015. PMID: 25651167
Similar articles
- Group 2 innate lymphoid cells promote beiging of white adipose tissue and limit obesity.
Brestoff JR, Kim BS, Saenz SA, Stine RR, Monticelli LA, Sonnenberg GF, Thome JJ, Farber DL, Lutfy K, Seale P, Artis D. Brestoff JR, et al. Nature. 2015 Mar 12;519(7542):242-6. doi: 10.1038/nature14115. Epub 2014 Dec 22. Nature. 2015. PMID: 25533952 Free PMC article. - Reversing Pdgfrβ signaling restores metabolically active beige adipocytes by alleviating ILC2 suppression in aged and obese mice.
Benvie AM, Berry DC. Benvie AM, et al. Mol Metab. 2024 Nov;89:102028. doi: 10.1016/j.molmet.2024.102028. Epub 2024 Sep 13. Mol Metab. 2024. PMID: 39278546 Free PMC article. - Eosinophils and type 2 cytokine signaling in macrophages orchestrate development of functional beige fat.
Qiu Y, Nguyen KD, Odegaard JI, Cui X, Tian X, Locksley RM, Palmiter RD, Chawla A. Qiu Y, et al. Cell. 2014 Jun 5;157(6):1292-1308. doi: 10.1016/j.cell.2014.03.066. Cell. 2014. PMID: 24906148 Free PMC article. - Inflammatory group 2 innate lymphoid cells.
Huang Y, Paul WE. Huang Y, et al. Int Immunol. 2016 Jan;28(1):23-8. doi: 10.1093/intimm/dxv044. Epub 2015 Aug 1. Int Immunol. 2016. PMID: 26232596 Free PMC article. Review. - Revisiting the adipocyte: a model for integration of cytokine signaling in the regulation of energy metabolism.
Rodríguez A, Ezquerro S, Méndez-Giménez L, Becerril S, Frühbeck G. Rodríguez A, et al. Am J Physiol Endocrinol Metab. 2015 Oct 15;309(8):E691-714. doi: 10.1152/ajpendo.00297.2015. Epub 2015 Sep 1. Am J Physiol Endocrinol Metab. 2015. PMID: 26330344 Review.
Cited by
- Eosinophils regulate adipose tissue inflammation and sustain physical and immunological fitness in old age.
Brigger D, Riether C, van Brummelen R, Mosher KI, Shiu A, Ding Z, Zbären N, Gasser P, Guntern P, Yousef H, Castellano JM, Storni F, Graff-Radford N, Britschgi M, Grandgirard D, Hinterbrandner M, Siegrist M, Moullan N, Hofstetter W, Leib SL, Villiger PM, Auwerx J, Villeda SA, Wyss-Coray T, Noti M, Eggel A. Brigger D, et al. Nat Metab. 2020 Aug;2(8):688-702. doi: 10.1038/s42255-020-0228-3. Epub 2020 Jul 6. Nat Metab. 2020. PMID: 32694825 Free PMC article. - Thymic stromal lymphopoietin induces IL-4/IL-13 from T cells to promote sebum secretion and adipose loss.
Choa R, Harris JC, Yang E, Yokoyama Y, Okumura M, Kim M, To J, Lou M, Nelson A, Kambayashi T. Choa R, et al. J Allergy Clin Immunol. 2024 Aug;154(2):480-491. doi: 10.1016/j.jaci.2023.11.923. Epub 2023 Dec 28. J Allergy Clin Immunol. 2024. PMID: 38157943 - Th2 Cytokines Increase the Expression of Fibroblast Growth Factor 21 in the Liver.
Kang SG, Lee SE, Choi MJ, Chang JY, Kim JT, Zhang BY, Kang YE, Lee JH, Yi HS, Shong M. Kang SG, et al. Cells. 2021 May 24;10(6):1298. doi: 10.3390/cells10061298. Cells. 2021. PMID: 34073755 Free PMC article. - Metaflammation in obesity and its therapeutic targeting.
Schleh MW, Caslin HL, Garcia JN, Mashayekhi M, Srivastava G, Bradley AB, Hasty AH. Schleh MW, et al. Sci Transl Med. 2023 Nov 22;15(723):eadf9382. doi: 10.1126/scitranslmed.adf9382. Epub 2023 Nov 22. Sci Transl Med. 2023. PMID: 37992150 Free PMC article. Review. - Pulmonary group 2 innate lymphoid cells: surprises and challenges.
Starkey MR, McKenzie AN, Belz GT, Hansbro PM. Starkey MR, et al. Mucosal Immunol. 2019 Mar;12(2):299-311. doi: 10.1038/s41385-018-0130-4. Epub 2019 Jan 21. Mucosal Immunol. 2019. PMID: 30664706 Free PMC article. Review.
References
- Cannon B, Nedergaard J. Nonshivering thermogenesis and its adequate measurement in metabolic studies. The Journal of experimental biology. 2011;214:242–253. - PubMed
- Cayrol C, Girard JP. IL-33: an alarmin cytokine with crucial roles in innate immunity, inflammation and allergy. Current opinion in immunology. 2014;31C:31–37. - PubMed
- Finkelman FD, Madden KB, Morris SC, Holmes JM, Boiani N, Katona IM, Maliszewski CR. Anti-cytokine antibodies as carrier proteins. Prolongation of in vivo effects of exogenous cytokines by injection of cytokine-anti-cytokine antibody complexes. J Immunol. 1993;151:1235–1244. - PubMed
Publication types
MeSH terms
Substances
Grants and funding
- DP1AR064158/AR/NIAMS NIH HHS/United States
- P30 DK063720/DK/NIDDK NIH HHS/United States
- T32 AI007334/AI/NIAID NIH HHS/United States
- HL076746/HL/NHLBI NIH HHS/United States
- P30 DK026743/DK/NIDDK NIH HHS/United States
- AI119944/AI/NIAID NIH HHS/United States
- R37AI026918/AI/NIAID NIH HHS/United States
- P01 HL107202/HL/NHLBI NIH HHS/United States
- R01 HL076746/HL/NHLBI NIH HHS/United States
- DP1 AR064158/AR/NIAMS NIH HHS/United States
- K08 AI113143/AI/NIAID NIH HHS/United States
- R01 DK094641/DK/NIDDK NIH HHS/United States
- DK094641/DK/NIDDK NIH HHS/United States
- R37 AI026918/AI/NIAID NIH HHS/United States
- R01 AI030663/AI/NIAID NIH HHS/United States
- K08 DK101604/DK/NIDDK NIH HHS/United States
LinkOut - more resources
Full Text Sources
Other Literature Sources
Miscellaneous


