Erk2 phosphorylation of Drp1 promotes mitochondrial fission and MAPK-driven tumor growth - PubMed (original) (raw)
Erk2 phosphorylation of Drp1 promotes mitochondrial fission and MAPK-driven tumor growth
Jennifer A Kashatus et al. Mol Cell. 2015.
Abstract
Ras is mutated in up to 30% of cancers, including 90% of pancreatic ductal adenocarcinomas, causing it to be constitutively GTP-bound, and leading to activation of downstream effectors that promote a tumorigenic phenotype. As targeting Ras directly is difficult, there is a significant effort to understand the downstream biological processes that underlie its protumorigenic activity. Here, we show that expression of oncogenic Ras or direct activation of the MAPK pathway leads to increased mitochondrial fragmentation and that blocking this phenotype, through knockdown of the mitochondrial fission-mediating GTPase Drp1, inhibits tumor growth. This fission is driven by Erk2-mediated phosphorylation of Drp1 on Serine 616, and both this phosphorylation and mitochondrial fragmentation are increased in human pancreatic cancer. Finally, this phosphorylation is required for Ras-associated mitochondrial fission, and its inhibition is sufficient to block xenograft growth. Collectively, these data suggest mitochondrial fission may be a target for treating MAPK-driven malignancies.
Copyright © 2015 Elsevier Inc. All rights reserved.
Figures
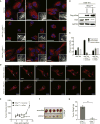
Figure 1. Ras-induced mitochondrial fission is required for tumor growth
(A) Mitochondrial morphologies of HEK-TtH cells or HEK-TtH cells stably expressing HRasG12V plus scramble or Drp1 shRNA. Red: MitoTracker Red; Blue: DAPI. Scale Bar = 20μm. (B) Immunoblot of Flag-HRasG12V and Drp1 in cells visualized in (A). GAPDH = Loading control. (C) Quantitation of mitochondrial morphologies observed in cells described in (A). n>50 cells, blindly scored by 3 people, 3 independent experiments; Error bar: S.E.M of mean percentages from 1 representative experiment. (D) HEK-TtH cells expressing vector or HRasG12V were transfected with mito-dsRed and mito-PA-GFP. mito-PA-GFP was activated by a 405-nm laser pulse in a 4μm region of interest (white box) then green fluorescence was tracked over a 1 hour time course. (E–G) HEK-TtH cell expressing HRasG12V and an shRNA targeting either scramble control or Drp1 were injected into mice and tumor volume (E) was measured over time. Tumors were removed at day 17 to be photographed (F) and weighed (G). n=5 tumors per cell line; error bars: S.E.M. of mean tumor volume (E) or tumor weight (G). ** Two-tailed student t-test, p=0.00749 (E) or p=0.00242 (G).
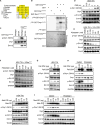
Figure 2. Erk2 phosphorylates Drp1 Serine 616
(A) Alignment of the consensus Erk2 target sequence with amino acids 612–620 of human Drp1 (isoform 1) and the corresponding sequence from the indicated species. (B–C) Recombinant, active GST-Erk2R67S was incubated with either GST alone, GST-Drp1518–736 or GST-Drp1518–736, S616A in the presence of γ32P-ATP (B) or ATP (C) and resolved by SDS-PAGE. Drp1 phosphorylation was detected by autoradiography (B) or immunoblot (A). (D–J) Phosphorylation of Drp1 (P616) and Erk1/2 (Y202/T204) were monitored by immunoblot in the following cells: (D) HEK-TtH cells grown in serum-free DMEM supplemented with 10μM Mek inhibitor PD325901 for 16 hrs, then supplemented with 10% FBS over an 8-hour time course; (E) HEK-TtH cells supplemented with 10% FBS and treated with 0.78–200nM of PD325901 for 8 hrs. (F) HEK-TtH cells stably expressing HRasG12V treated with 0.78–200nM of PD325901 for 8 hrs; (G) HEK-TtH cells transfected with increasing amounts of Raf-22W; (H) HeLa cells transfected with increasing amounts of Raf-22W in the presence of DMSO or PD325901; (I) HEK-TtH cells transfected with increasing amounts of MEK-DD; (J) HeLa cells transfected with increasing amounts of active MEK-DD in the presence of DMSO or PD325901; Tom20, CoxIV, GAPDH: Loading Controls.
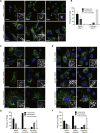
Figure 3. Activation of Ras or MAPK signaling leads to Mek-dependent mitochondrial fragmentation
(A) Mitochondrial morphologies of HEK-TtH cells stably expressing mito-YFP and HRasG12V and treated with either DMSO or 200nM PD325901 for 24 hours. Green: mito-YFP; Blue: DAPI. Scale Bar = 20μm. (B) Quantitation of mitochondrial morphologies observed in cells described in (A). n>50 cells, blindly scored by 5 people, 3 independent experiments; Error bar: S.E.M of mean percentages from 1 representative experiment. (C–F) Mitochondrial morphologies of HEK-TtH cells transfected with mito-YFP plus either vector, Raf-22W or Mek-DD and treated with either DMSO or 200nM PD325901 for 24 hours as indicated. Green: mito-YFP; Blue: DAPI. Scale Bar = 20μm; Quantitation of mitochondrial morphologies: n>50 cells, blindly scored by 5 people, 3 independent experiments; Error bar: S.E.M of mean percentages from 1 representative experiment.
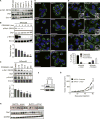
Figure 4. Patient-derived pancreatic cancer cell lines are characterized by Mek-dependent Drp1 phosphorylation and mitochondrial fragmentation
(A) Immunoblot analysis of phospho-Drp1 (P616) and Drp1 in a panel of 8 patient-derived pancreatic cell lines. CoxIV: Loading Control. (B–C) Immunoblot analysis of MPanc96 cells treated with 200nM PD325901 over a timecourse of 12 hours (C) or treated with 0.78–200nM for 8 hours (D). Graph: p-Drp1 levels normalized to total Drp1 levels; n=3, Error bars: S.E.M. Two-tailed student t-test comparing treatment to control, **p<0.01; *p<0.05. (D) Mitochondrial morphology of 8 patient-derived pancreatic cancer cell lines. Green: anti-Tom20; Blue: DAPI. Scale Bar = 20μm. (E) Mitochondrial morphology of MPanc96 cells treated with DMSO or 200nM PD325901 for 48hrs. Green: anti-Tom20; Blue: DAPI. Scale Bar = 20μm. Graph: quantitation of mitochondrial morphologies. n>50 cells, blindly scored by 5 people, 3 independent experiments; Error bar: S.E.M of mean percentages from 1 representative experiment. (F–H) BxPC3 cells expressing scramble or Drp1 shRNA were analyzed by immunoblot (F) then injected into mice and tumor volume was measured over time (G). Tumors were excised and analyzed by immunoblot (H). Blot represents first 7 tumors for each cell type (red boxes). Tubulin, GAPDH: Loading controls. Error bars: S.E.M. of mean tumor volume. ** Two-tailed student t-test, p<0.004.
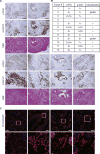
Figure 5. Drp1 S616 is phosphorylated in human pancreatic ductal adenocarcinoma
(A) Three serial sections were cut from formalin-fixed, paraffin-embedded sections from 12 pancreatic ductal adenocarcinomas and stained with Hematoxylin and Eosin (H&E) or antibodies against phospho-Drp1 (S616) and phospho-Erk1/2 (T202/Y204). Representative images of colocalization are shown from 6 tumors. Scale Bar = 100μm (IHC). (B) The levels of phospho-Drp1 (S616) and phospho-Erk1/2 (T202/Y204) staining, as well as the degree of co-localization, were determined for each of 12 pancreatic ductal adenocarcinomas examined. (C) Additional sections were cut from two of the tumors (7, 11) and stained with an anti-mitochondria antibody (MTC02) to detect mitochondria (red). Blue: DAPI. Scale Bar = 20μm.
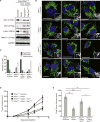
Figure 6. Drp1 Serine 616 is required for Ras-induced mitochondrial fission and Ras-induced tumor growth
(A) HEK-TtH cells were engineered to express Flag-HRasG12V plus an shRNA targeting either scramble or Drp1 and rescued with either vector, Flag-Drp1WT or Flag-Drp1S616A. (B) The mitochondrial morphologies were analyzed. Green: anti-Tom20; Blue: DAPI. (C) Mitochondrial morphologies were quantified in: n>50 cells, blindly scored by 5 people, 3 independent experiments; Error bar: S.E.M of mean percentages from 1 representative experiment. Scale Bar = 20μm. (D–E) Cells were injected into mice and tumor volume measured over time (D). Tumor volumes at day 17 are shown in (E). n=10 tumors per cell line; error bar: S.E.M. of mean tumor volume. Two-tailed student t-test, **p<0.001; *p<0.05; n.s.=p>0.15.
Similar articles
- Drp1 regulates mitochondrial morphology and cell proliferation in cutaneous squamous cell carcinoma.
Kitamura S, Yanagi T, Imafuku K, Hata H, Abe R, Shimizu H. Kitamura S, et al. J Dermatol Sci. 2017 Dec;88(3):298-307. doi: 10.1016/j.jdermsci.2017.08.004. Epub 2017 Aug 5. J Dermatol Sci. 2017. PMID: 28818497 - Different mitochondrial fragmentation after irradiation with X-rays and carbon ions in HeLa cells and its influence on cellular apoptosis.
Jin X, Li F, Liu B, Zheng X, Li H, Ye F, Chen W, Li Q. Jin X, et al. Biochem Biophys Res Commun. 2018 Jun 12;500(4):958-965. doi: 10.1016/j.bbrc.2018.04.214. Epub 2018 May 2. Biochem Biophys Res Commun. 2018. PMID: 29709476 - Mitochondrial division is requisite to RAS-induced transformation and targeted by oncogenic MAPK pathway inhibitors.
Serasinghe MN, Wieder SY, Renault TT, Elkholi R, Asciolla JJ, Yao JL, Jabado O, Hoehn K, Kageyama Y, Sesaki H, Chipuk JE. Serasinghe MN, et al. Mol Cell. 2015 Feb 5;57(3):521-36. doi: 10.1016/j.molcel.2015.01.003. Mol Cell. 2015. PMID: 25658204 Free PMC article. - The role of Drp1 adaptor proteins MiD49 and MiD51 in mitochondrial fission: implications for human disease.
Atkins K, Dasgupta A, Chen KH, Mewburn J, Archer SL. Atkins K, et al. Clin Sci (Lond). 2016 Nov 1;130(21):1861-74. doi: 10.1042/CS20160030. Clin Sci (Lond). 2016. PMID: 27660309 Review. - [Mechanism of mitochondrial fission - structure and function of Drp1 protein].
Michalska B, Duszyński J, Szymański J. Michalska B, et al. Postepy Biochem. 2016;62(2):127-137. Postepy Biochem. 2016. PMID: 28132464 Review. Polish.
Cited by
- High glucose induces Drp1-mediated mitochondrial fission via the Orai1 calcium channel to participate in diabetic cardiomyocyte hypertrophy.
Wu QR, Zheng DL, Liu PM, Yang H, Li LA, Kuang SJ, Lai YY, Rao F, Xue YM, Lin JJ, Liu SX, Chen CB, Deng CY. Wu QR, et al. Cell Death Dis. 2021 Feb 26;12(2):216. doi: 10.1038/s41419-021-03502-4. Cell Death Dis. 2021. PMID: 33637715 Free PMC article. - Role of dynamin-related protein 1-mediated mitochondrial fission in resistance of mouse C2C12 myoblasts to heat injury.
Yu T, Deuster P, Chen Y. Yu T, et al. J Physiol. 2016 Dec 15;594(24):7419-7433. doi: 10.1113/JP272885. Epub 2016 Nov 29. J Physiol. 2016. PMID: 27730652 Free PMC article. - Recent advances in mitochondria-targeting theranostic agents.
Qian K, Gao S, Jiang Z, Ding Q, Cheng Z. Qian K, et al. Exploration (Beijing). 2024 Mar 5;4(4):20230063. doi: 10.1002/EXP.20230063. eCollection 2024 Aug. Exploration (Beijing). 2024. PMID: 39175881 Free PMC article. Review. - Role of Autophagy and AMPK in Cancer Stem Cells: Therapeutic Opportunities and Obstacles in Cancer.
Kovale L, Singh MK, Kim J, Ha J. Kovale L, et al. Int J Mol Sci. 2024 Aug 8;25(16):8647. doi: 10.3390/ijms25168647. Int J Mol Sci. 2024. PMID: 39201332 Free PMC article. Review. - Mechanisms shaping the role of ERK1/2 in cellular senescence (Review).
Zou J, Lei T, Guo P, Yu J, Xu Q, Luo Y, Ke R, Huang D. Zou J, et al. Mol Med Rep. 2019 Feb;19(2):759-770. doi: 10.3892/mmr.2018.9712. Epub 2018 Nov 29. Mol Med Rep. 2019. PMID: 30535440 Free PMC article. Review.
References
- Arismendi-Morillo G. Electron microscopy morphology of the mitochondrial network in human cancer. Int J Biochem Cell Biol. 2009;41:2062–2068. - PubMed
- Bos JL. ras oncogenes in human cancer: a review. Cancer Res. 1989;49:4682–4689. - PubMed
- Brunet A, Pagès G, Pouysségur J. Constitutively active mutants of MAP kinase kinase (MEK1) induce growth factor-relaxation and oncogenicity when expressed in fibroblasts. Oncogene. 1994;9:3379–3387. - PubMed
Publication types
MeSH terms
Substances
Grants and funding
- R01 DK101803/DK/NIDDK NIH HHS/United States
- P30 CA044579/CA/NCI NIH HHS/United States
- R21 AA022154/AA/NIAAA NIH HHS/United States
- T32 GM008136/GM/NIGMS NIH HHS/United States
- R01 CA094184/CA/NCI NIH HHS/United States
- T32 CA009109/CA/NCI NIH HHS/United States
LinkOut - more resources
Full Text Sources
Other Literature Sources
Medical
Molecular Biology Databases
Research Materials
Miscellaneous
