Circulating precursors of human CD1c+ and CD141+ dendritic cells - PubMed (original) (raw)
Circulating precursors of human CD1c+ and CD141+ dendritic cells
Gaëlle Breton et al. J Exp Med. 2015.
Abstract
Two subsets of conventional dendritic cells (cDCs) with distinct cell surface markers and functions exist in mouse and human. The two subsets of cDCs are specialized antigen-presenting cells that initiate T cell immunity and tolerance. In the mouse, a migratory cDC precursor (pre-CDC) originates from defined progenitors in the bone marrow (BM). Small numbers of short-lived pre-CDCs travel through the blood and replace cDCs in the peripheral organs, maintaining homeostasis of the highly dynamic cDC pool. However, the identity and distribution of the immediate precursor to human cDCs has not been defined. Using a tissue culture system that supports the development of human DCs, we identify a migratory precursor (hpre-CDC) that exists in human cord blood, BM, blood, and peripheral lymphoid organs. hpre-CDCs differ from premonocytes that are restricted to the BM. In contrast to earlier progenitors with greater developmental potential, the hpre-CDC is restricted to producing CD1c(+) and CD141(+) Clec9a(+) cDCs. Studies in human volunteers demonstrate that hpre-CDCs are a dynamic population that increases in response to levels of circulating Flt3L.
© 2015 Breton et al.
Figures
Figure 1.
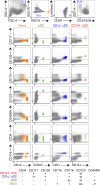
Expression of cytokine receptors on DCs and monocytes. Flow cytometry plots show expression of CD117, CD135, CD115, CD123, CD45RA, CD34, and CD116 on gated CD3−CD19−CD56− cells (gray), differentiated monocytes (CD14+ orange), pDCs (CD303+ green), CD1c+ cDCs (blue), and CD141+ cDCs (red) from peripheral blood. Table summarizes results of flow cytometry.
Figure 2.
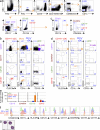
Screening of populations in the cord blood for committed cDC lineage potential. (a) Flow cytometry plots show gating of CD45+CD3−CD19−CD56−CD14−CD66b−CD1c−CD141−CD303− cells in human cord blood can be divided into four populations based on CD117, CD34, and CD135: CD34+CD117+ (CD34+), CD34−CD117− (CD117−), CD34−CD117+CD135− (CD135−), and CD34−CD117+CD135+ (CD135+). Numbers indicate the frequency of respective gates. (b) Differentiation potential of 1,000 purified cells from each of 4 populations indicated in (a) in MS5+FSG cultures for 7 d. Flow cytometry plots show gated live human CD45+ cells. (c) Flow cytometry plots show CD135+ cells indicated as in (a) can be further separated into 4 populations based on CD116, CD115, and CD45RA: CD135+CD116− (CD116−), CD135+CD116+CD45RA−(CD45RA−), CD135+CD116+CD45RA+CD115+ (CD115+), and CD135+CD116+CD45RA+ CD115− (CD115−). (d and e) Differentiation potential of 100 purified cells from each of 4 populations indicated in (c) in MS5+FSG cultures for 7 d. (d) Flow cytometry plots of CD45+ cells gated as in (c), showing expression of CD141, CLEC9a, CD1c, and CD19. (e) Graphs show mean output of pDC, CD1c+ cDC, CD141+ cDC and monocytes from each population from three independent experiments. (f) Histograms show expression of CD11c, HLA-DR, CD123, CD135, CD117, CD45RA, CD116, and CD115 on indicated cell-type. (g) Morphology of purified cord blood hpre-CDCs by Giemsa staining of cytospin preparations (100×). Dotted lines indicate cropping out of white space between cells. Bar, 10 µm.
Figure 3.
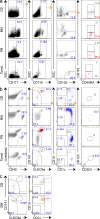
hpre-CDCs in human lymphoid organs and blood. (a) Representative flow cytometry plots of gated Lin(CD3/19/56/14/66b)−DC(CD1c/141/303)−CD34− cells show gating strategy and composition of hpre-CDCs (SSCloCD117+CD116+CD135+ CD45RA+CD115−, red) and premonocytes (SSCloCD117+CD116+CD135+ CD45RA+CD115+, green) in human cord blood (CB), BM, peripheral blood (PB), and tonsil. Numbers indicate frequency of cells of parent gate (CB, n = 5; BM, n = 4, PB, n = 5; Tonsil, n = 3; n, number of donors). (b) Differentiation potential of purified hpre-CDCs indicated in (a) in MS5+FSG cultures for 5 d. Flow cytometry plots of gated live human CD45+ cells show culture output of CD141+ cDC (red) and CD1c+ cDC (blue). Representative results of four (CB), three (BM), three (PB), and two (tonsil) independent experiments are shown. (c) Differentiation potential of purified premonocytes from cord blood (CB) and BM in MS5+FSG cultures for 5 d. FACs plots show phenotype of gated live human CD45+ culture-derived cells including monocytes (orange) and CD1c+ cDCs (blue). Representative of three independent experiments are shown.
Figure 4.
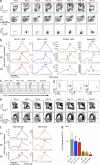
Proliferative capacity of hpre-CDCs. (a) Expansion of purified hpre-CDCs or CD34+ HSPCs from peripheral blood (PB) or cord blood (CB) in MS5+FSG cultures for 7 d. Graph shows the mean fold change of live human CD45+ cells from 100 input cells from three independent experiments. *, P < 0.005, unpaired two-tailed Student’s t test. (b and c) CD34+ HSPCs and hpre-CDCs were purified from CB, labeled with CFSE, and cultured in MS5+FSG for 2 or 7 d; proliferation was assessed by flow cytometry. FACs plots show (b) gated CD45+ culture-derived cells, including CD34+ cells (purple), CD34−CD1c−CD141− cells (orange), CD141+ cDCs (red), and CD1c+ cDCs (blue) and (c) their CFSE dilution. Dotted lines mark last division by hpre-CDCs. Plots are representative of three independent experiments.
Figure 5.
Clonal efficiency and potential of hpre-CDC. (a) Limiting dilution outgrowth assay show clonal efficiency of CD34+ HSPCs (n = 3) or hpre-CDCs from peripheral (PB, n = 4) and cord blood (CB, n = 3) in MS5+FSG cultures for 5 d (for hpre-CDCs) or 14 d (for CD34+ HSPCs; Materials and methods). **, P < 0.05, pairwise test by ELDA. (b) Representative flow cytometry plots of gated CD45+ cells derived from single hpre-CDC clones indicated in (a) show output of CD1c+ cDCs (blue) and CD141+ cDCs (red). (c) Graphs summarize the lineage output of single clones from CD34+ HSPCS, and hpre-CDCs from cord (CB) or peripheral blood (PB). G, granulocyte; M, monocyte; L, lymphocytes.
Figure 6.
hpre-CDCs descend from hCDPs. (a) Flow cytometry plots show comparison of hCDP (purple) and hpre-CDC (orange) in cord blood. (b) Flow cytometry plots of gated CD45+Lin(CD3/19/56/14)−CD34+ show phenotype and purity of magnetically enriched cord blood (CB) CD34+ cells (presorting, upper) and sorted cells (post-sorting, bottom). hCDPs were gated as CD34+CD38hiCD45RA+CD10−CD123hi. (c) Differentiation kinetics of hCDPs purified from CB in MS5+FSG cultures for 1, 2, or 4 d. FACs plots show culture output of live human CD45+ cells, including CD34+ cells (purple), pDC (green), CD1c+ cDC (blue), CD141+ cDCs (red), and hpre-CDCs (orange). Representative of four independent experiments are shown. Graphs summarize composition of indicated populations among total hCD45_+_ cells. Bars are mean values from four independent experiments, and error bars are SEM.
Figure 7.
Flt3L administration increases circulating DC subsets and hpre-CDCs in humans. PBMCs from Flt3L-treated volunteers (n = 3; 25 µg/kg for 10 consecutive days) were analyzed by flow cytometry over a 21-d period to assess the expansion of DC subsets (CD1c+ cDCs [blue], CD141+ cDCs [red], and pDCs [green]; hpre-CDCs (gray); monocytes (orange); and granulocytes (brown). (a) Representative flow cytometry dot plots show DC subsets and hpre-CDCs in blood (gating strategy in
Fig. S4
). (b) Graphs show the kinetics of cell number of cDC subsets, pDCs, and hpre-CDCs over 21 d in 3 Flt3L-treated volunteers. The absolute numbers per milliliter of blood were obtained by multiplying the number of cells (obtained by flow cytometry) by the total number of PBMCs per milliliter of blood. (c) Representative histograms show CD135 expression on CD141+ cDCs, CD1c+ cDCs, pDCs and hpre-CDCs over 21 d in one Flt3L-treated volunteer. (d) Differentiation potential of purified hpre-CDCs from blood of Flt3L-injected volunteers in MS5+FSG cultures after 7 d. Flow cytometry plots of gated CD45+ cells from culture show output of CD141+ cDCs (red), CD1c+ cDCs (blue), and lack of pDCs (green gate). (e) Representative flow cytometry dot plots show CD14+ monocytes and CD66b+ granulocytes in blood (gating strategy in Fig. S4). (f) Graphs show the kinetics of cell number of monocytes and granulocytes over 21 d in 3 Flt3L-treated volunteers. The absolute numbers per milliliter of blood were obtained by multiplying the number of cells (obtained by flow cytometry) by the total number of PBMCs per milliliter of blood. (g) Graph showing the mean fold change increase from the three patients (d1 vs. d14) of hpre-CDCs (gray), CD1c+ cDCs (blue), CD141+ cDCs (red), pDCs (green), monocytes (orange), and granulocytes (brown) per milliliter of blood. Error bars are SDs.
Comment in
- The real thing: how to make human DC subsets.
Geissmann F. Geissmann F. J Exp Med. 2015 Mar 9;212(3):285. doi: 10.1084/jem.2123insight2. J Exp Med. 2015. PMID: 25754119 Free PMC article. No abstract available.
Similar articles
- Human dendritic cells (DCs) are derived from distinct circulating precursors that are precommitted to become CD1c+ or CD141+ DCs.
Breton G, Zheng S, Valieris R, Tojal da Silva I, Satija R, Nussenzweig MC. Breton G, et al. J Exp Med. 2016 Dec 12;213(13):2861-2870. doi: 10.1084/jem.20161135. Epub 2016 Nov 18. J Exp Med. 2016. PMID: 27864467 Free PMC article. - FLT3-ligand treatment of humanized mice results in the generation of large numbers of CD141+ and CD1c+ dendritic cells in vivo.
Ding Y, Wilkinson A, Idris A, Fancke B, O'Keeffe M, Khalil D, Ju X, Lahoud MH, Caminschi I, Shortman K, Rodwell R, Vuckovic S, Radford KJ. Ding Y, et al. J Immunol. 2014 Feb 15;192(4):1982-9. doi: 10.4049/jimmunol.1302391. Epub 2014 Jan 22. J Immunol. 2014. PMID: 24453245 - Single cell RNA-Seq reveals pre-cDCs fate determined by transcription factor combinatorial dose.
Ma W, Lee J, Backenroth D, Zhou YJ, Bush E, Sims P, Liu K, Shen Y. Ma W, et al. BMC Mol Cell Biol. 2019 Jun 28;20(1):20. doi: 10.1186/s12860-019-0199-y. BMC Mol Cell Biol. 2019. PMID: 31253076 Free PMC article. - What Makes a pDC: Recent Advances in Understanding Plasmacytoid DC Development and Heterogeneity.
Musumeci A, Lutz K, Winheim E, Krug AB. Musumeci A, et al. Front Immunol. 2019 May 29;10:1222. doi: 10.3389/fimmu.2019.01222. eCollection 2019. Front Immunol. 2019. PMID: 31191558 Free PMC article. Review. - Subsets of CD1c+ DCs: Dendritic Cell Versus Monocyte Lineage.
Heger L, Hofer TP, Bigley V, de Vries IJM, Dalod M, Dudziak D, Ziegler-Heitbrock L. Heger L, et al. Front Immunol. 2020 Sep 30;11:559166. doi: 10.3389/fimmu.2020.559166. eCollection 2020. Front Immunol. 2020. PMID: 33101275 Free PMC article. Review.
Cited by
- The known unknowns of the human dendritic cell network.
Durand M, Segura E. Durand M, et al. Front Immunol. 2015 Mar 23;6:129. doi: 10.3389/fimmu.2015.00129. eCollection 2015. Front Immunol. 2015. PMID: 25852695 Free PMC article. Review. - The Flt3L/Flt3 Axis in Dendritic Cell Biology and Cancer Immunotherapy.
Cueto FJ, Sancho D. Cueto FJ, et al. Cancers (Basel). 2021 Mar 26;13(7):1525. doi: 10.3390/cancers13071525. Cancers (Basel). 2021. PMID: 33810248 Free PMC article. Review. - Development of a standardized and validated flow cytometry approach for monitoring of innate myeloid immune cells in human blood.
van der Pan K, de Bruin-Versteeg S, Damasceno D, Hernández-Delgado A, van der Sluijs-Gelling AJ, van den Bossche WBL, de Laat IF, Díez P, Naber BAE, Diks AM, Berkowska MA, de Mooij B, Groenland RJ, de Bie FJ, Khatri I, Kassem S, de Jager AL, Louis A, Almeida J, van Gaans-van den Brink JAM, Barkoff AM, He Q, Ferwerda G, Versteegen P, Berbers GAM, Orfao A, van Dongen JJM, Teodosio C. van der Pan K, et al. Front Immunol. 2022 Sep 14;13:935879. doi: 10.3389/fimmu.2022.935879. eCollection 2022. Front Immunol. 2022. PMID: 36189252 Free PMC article. - WT1 Pulsed Human CD141+ Dendritic Cell Vaccine Has High Potential in Solid Tumor-Targeted Immunotherapy.
Cho SY, Jeong SM, Jeon YJ, Yang SJ, Hwang JE, Yoo BM, Kim HS. Cho SY, et al. Int J Mol Sci. 2023 Jan 12;24(2):1501. doi: 10.3390/ijms24021501. Int J Mol Sci. 2023. PMID: 36675017 Free PMC article. - Clonal Analysis of Human Dendritic Cell Progenitors Using a Stromal Cell Culture.
Liu K, Lee J, Luh T. Liu K, et al. Methods Mol Biol. 2023;2618:155-170. doi: 10.1007/978-1-0716-2938-3_12. Methods Mol Biol. 2023. PMID: 36905516
References
- Bachem A., Güttler S., Hartung E., Ebstein F., Schaefer M., Tannert A., Salama A., Movassaghi K., Opitz C., Mages H.W., et al. . 2010. Superior antigen cross-presentation and XCR1 expression define human CD11c+CD141+ cells as homologues of mouse CD8+ dendritic cells. J. Exp. Med. 207:1273–1281 10.1084/jem.20100348 - DOI - PMC - PubMed
- Cohn L., Chatterjee B., Esselborn F., Smed-Sörensen A., Nakamura N., Chalouni C., Lee B.C., Vandlen R., Keler T., Lauer P., et al. . 2013. Antigen delivery to early endosomes eliminates the superiority of human blood BDCA3+ dendritic cells at cross presentation. J. Exp. Med. 210:1049–1063 10.1084/jem.20121251 - DOI - PMC - PubMed
Publication types
MeSH terms
Substances
Grants and funding
- HHMI/Howard Hughes Medical Institute/United States
- UL1RR024143/RR/NCRR NIH HHS/United States
- UL1 RR024143/RR/NCRR NIH HHS/United States
- U19AI111825/AI/NIAID NIH HHS/United States
- NS084776/NS/NINDS NIH HHS/United States
- U19 AI111825/AI/NIAID NIH HHS/United States
- R01 AI013013/AI/NIAID NIH HHS/United States
- F31 NS084776/NS/NINDS NIH HHS/United States
- K23 AR063461/AR/NIAMS NIH HHS/United States
- AI101251/AI/NIAID NIH HHS/United States
- AR063461-01A1/AR/NIAMS NIH HHS/United States
- R01 AI101251/AI/NIAID NIH HHS/United States
- AI13013/AI/NIAID NIH HHS/United States
LinkOut - more resources
Full Text Sources
Other Literature Sources


