WNT signaling drives cholangiocarcinoma growth and can be pharmacologically inhibited - PubMed (original) (raw)
. 2015 Mar 2;125(3):1269-85.
doi: 10.1172/JCI76452. Epub 2015 Feb 17.
Rachel V Guest, Timothy J Kendall, David H Wilson, Davina Wojtacha, Andrew J Robson, Rachel A Ridgway, Kay Samuel, Nico Van Rooijen, Simon T Barry, Stephen J Wigmore, Owen J Sansom, Stuart J Forbes
- PMID: 25689248
- PMCID: PMC4362247
- DOI: 10.1172/JCI76452
WNT signaling drives cholangiocarcinoma growth and can be pharmacologically inhibited
Luke Boulter et al. J Clin Invest. 2015.
Abstract
Cholangiocarcinoma (CC) is typically diagnosed at an advanced stage and is refractory to surgical intervention and chemotherapy. Despite a global increase in the incidence of CC, little progress has been made toward the development of treatments for this cancer. Here we utilized human tissue; CC cell xenografts; a p53-deficient transgenic mouse model; and a non-transgenic, chemically induced rat model of CC that accurately reflects both the inflammatory and regenerative background associated with human CC pathology. Using these systems, we determined that the WNT pathway is highly activated in CCs and that inflammatory macrophages are required to establish this WNT-high state in vivo. Moreover, depletion of macrophages or inhibition of WNT signaling with one of two small molecule WNT inhibitors in mouse and rat CC models markedly reduced CC proliferation and increased apoptosis, resulting in tumor regression. Together, these results demonstrate that enhanced WNT signaling is a characteristic of CC and suggest that targeting WNT signaling pathways has potential as a therapeutic strategy for CC.
Figures
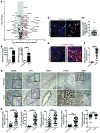
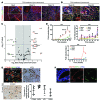
Figure 1. Canonical WNT signaling is activated in human CC.
(A) mRNA expression of WNT pathway genes and WNT target genes in CC versus patient-matched non-cancerous tissue (n = 11). Represented as a 3-fold change; P < 0.05. (B) WNT7B and WNT10A mRNA expression in human CC versus non-diseased liver (n = 37 vs. n = 30). (C) Immunohistochemistry of WNT7B (green) in CD68-positive macrophages (red). (D) Quantification of CD68+WNT7B+ TAMs (n = 42). (E) Immunohistochemistry for CTNNB1 (red) and BCL9 (green) in human CC and non-tumor, patient-matched liver. (F) Quantification of biliary nuclear staining for BCL9 (n = 42 per group). (G) Immunohistochemistry in non-tumor versus CC for CCND2, LEF1, BIRC5, C-MYC, and SOX9. Yellow lines, non-cancerous bile ducts; red lines, malignant biliary ducts; black arrows, nuclear positivity for C-MYC. (H) Quantification of biliary nuclear staining for CCND2, LEF1, BIRC5, C-MYC, and SOX9 in non-tumor and CC tissue (n = 42 per group). Data are presented as mean ± SEM. Mann-Whitney U test; **P < 0.01, ***P < 0.001. Photomicrograph scale bars: 50 μm (in C, right panel, 20 μm).
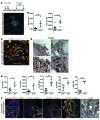
Figure 9. Loss of WNT signaling reduces proliferation and induces apoptosis in CC in vivo.
(A) Immunohistochemistry for KRT19 (green) and CTNNB1 (red) in TAA CC treated with vehicle, C59, or ICG-001. White arrows, nuclear positivity for CTNNB1. (B) Quantification of nuclear CTNNB1 staining in TAA CC following treatment with vehicle C-59 or ICG-001 (n = 10 per group). (C) Immunohistochemistry for BIRC5 in TAA CC following treatment with vehicle, C-59, or ICG-001 (black arrows, nuclear positivity for BIRC5 in epithelium; red, non-epithelial BIRC5 positivity; yellow, epithelium negative for BIRC5). (D) Quantification of epithelial BIRC5 positivity following treatment with vehicle, C-59, or ICG-001 (n = 10 per group). (E) Immunohistochemistry for TUNEL (green) and Ki-67 (red) in TAA CC treated with vehicle, C-59, or ICG-001. White boxes, regions magnified in lower panels; white arrows, epithelial positivity for Ki-67; yellow arrows, epithelial positivity for TUNEL. (F) Quantification of Ki-67 and TUNEL staining in CC epithelial nuclei following treatment with vehicle, C-59, or ICG-001 (n = 10 per group). Data are presented as mean ± SEM. Kruskal-Wallis test; *P < 0.05, ***P < 0.001. Scale bars: 50 μm; inset, 10 μm.
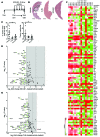
Figure 8. Inhibition of the canonical WNT signaling pathway reduces CC in vivo.
(A) Schematic representing WNT inhibition in the TAA CC model. (B) H&E of TAA CC treated with vehicle, C-59, or ICG-001. (C) Quantification of tumor area and number in TAA CC following treatment with vehicle (n = 10), C-59 (n = 4), or ICG-001 (n = 8). (D) mRNA expression of WNT targets in TAA CC following treatment with ICG-001 (n = 6 in both groups). Data are presented as 3-fold change; P < 0.05; green, downregulation. (E) mRNA expression of WNT targets in TAA CC following treatment with C-59. Data are presented 3-fold change; P < 0.05; green, downregulation; red, upregulation (n = 6 in vehicle and n = 4 in C-59). (F) Heat map comparing expression of individual samples treated with vehicle, ICG0-001, or C-59. Data are presented as mean ± SEM. Kruskal-Wallis test; *P < 0.05. Scale bars: 5 mm.
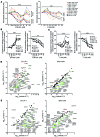
Figure 7. Inhibition of the canonical WNT signaling pathway alters cell viability in vitro.
(A) MTT assay using SNU-1079, CC-SW-1, SNU-1196, CC-LP-1, and WITT-1 CC lines treated with increasing concentrations of ICG-001 or C-59. Dose response data are presented as the mean of 3 experimental replicates that were run in triplicate. (B) Quantification of caspase-3/7 activity and BrdU incorporation with increasing concentrations of ICG-001 in SNU-1079, CC-SW-1, SNU-1196, CC-LP-1, and WITT-1 CC lines. (C) Quantification of caspase-3/7 activity (left graph) and BrdU incorporation (right graph) with increasing concentrations of C-59 in SNU-1079, CC-SW-1, SNU-1196, CC-LP-1, and WITT-1 CC lines. (D) mRNA expression of WNT target genes and cell cycle genes in CC-LP-1 and SNU-1079 cells following inhibition with ICG-001. Data are presented as >2-fold-change. (E) mRNA expression of WNT target genes and cell cycle genes in CC-LP-1 and SNU-1079 cells following inhibition with C-59. Data are presented >2-fold-change. Dose response data are presented as the mean of 3 experimental replicates that were run in triplicate. Kruskal-Wallis test; **P < 0.01, ***P < 0.001. Gene expression data represent pooled material from 3 experimental replicates run in triplicate.
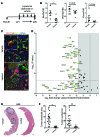
Figure 6. Macrophage inhibition reduces CC growth in vivo.
(A) Schematic representing macrophage depletion in TAA using Lipclod. (B) mRNA expression of Wnt7b, Wnt10a, and Porcn following macrophage depletion in TAA CC using vehicle versus Lipclod (n = 5 vs. n = 7). (C) Immunohistochemistry on vehicle- versus Lipclod-treated TAA tissue for WNT7B (red) and KRT19 (green). (D) mRNA expression of WNT pathway target genes following Lipclod depletion of macrophages (n = 6 per group); green denotes downregulation. Represented as a 3-fold change; P < 0.05 (E) H&E of rat liver from TAA rats treated with vehicle versus Lipclod. (F) Quantification of area and number of rat TAA-induced CC tumors following treatment with vehicle or Lipclod (n = 14 vs. n = 5). Data are represented as mean ± SEM. Mann-Whitney U test; *P < 0.05, **P < 0.01. Scale bars in C: 50 μm; insets, 10 μm. Scale bars in E: 1 mm.
Figure 5. Macrophage ablation in human CC cell xenografts reduces tumor penetrance.
(A) Schematic demonstrating the strategy for macrophage depletion in human CC cell xenografts. (B) Quantification of CD68-positive macrophage number in SNU-1079 and CC-LP-1 xenografts following treatment with Lipclod, GW2580, or AZD7507 compared with vehicle alone. Photomicrographs: Immunohistochemistry in xenografts for CD68-positive macrophages (red). (C) Volume and mass of SNU-1079 and CC-LP-1 xenografts following treatment with Lipclod, GW2580, or AZD7507 compared with vehicle alone. (D) Murine Wnt7b expression in SNU-1079 and CC-LP-1 xenografts following treatment with Lipclod, GW2580, or AZD7507 compared with vehicle alone. Data are presented as mean ± SEM. A Kruskal-Wallis test was used to compare GW2580 and AZD7507 and control. Lipclod and control were compared using a Mann-Whitney U test in both cases. **P < 0.01, ***P < 0.001. Photomicrograph scale bars: 50 μm. For SNU-1079: PBS n = 11, liposomes n = 8, Lipclod n = 8, gavage vehicle n = 8, GW2580 n = 4, and AZD7507 n = 6. For CC-LP-1: PBS n = 9, liposomes n = 6, Lipclod n = 15, gavage vehicle n = 6, GW2580 n = 3, and AZD7507 n = 3.
Figure 4. M2 macrophages initiate a WNT-high state in CC.
(A) Immunohistochemistry in TAA-induced CC for WNT7B (green) and CD68 (red). White arrows, macrophage expression of WNT7B; yellow arrows, epithelial positivity for WNT7B. (B) Schematic representing the GFP BM transplant (Tx.) strategy. (C) Immunohistochemistry for CD68 or CD163 (red) and GFP (green) in 26-week TAA BM-transplanted rats. Dotted line, tumor boundary. (D) Immunohistochemistry of GFP (green)/CD68 (red) dual-positive TAMs expressing CD206 (white). (E) Quantification of CD68/GFP dual-positive TAMs expressing CD206 (n = 10). (F) Immunohistochemistry for GFP (green), CD68 (white), and WNT7B (red) in 26-week TAA CC. (G) Quantification of CD68-positive macrophages expressing WNT7B in rat CC (n = 10). Data are presented as mean ± SEM. Photomicrograph scale bars: 50 μm; insets, 10 μm.
Figure 3. The WNT pathway is activated in a rat model of CC.
(A) Immunohistochemistry for CTNNB1 (red) and KRT19 (green) in precancerous TAA rats. (B) Immunohistochemistry for CTNNB1 and KRT19 in cancerous TAA rats. White arrows in insets, nuclear positivity of CTNNB1; dotted line, tumor interface. (C) mRNA expression of WNT pathway targets in 26-week TAA versus matched non-treated controls (n = 6 per group). (D) mRNA expression of WNT ligands Wnt10a and Wnt7b; WNT pathway effectors Rspo1, Bcl9, Birc5, Axin2, Rnf43, and Lgr4; and cell cycle targets Aurka, Aurkb, and Aurkc. (E) Immunohistochemistry in rat CC for CTNNB1 (red), BIRC5 (green), and LEF1 and CCND2 (brown). Graph: Quantification of epithelial nuclear staining in 26-week TAA rat (n = 10). (F) Immunohistochemistry for WNT7B (red) and RSPO-1 (green) in TAA-induced CC. Data are presented as mean ± SEM. Kruskal-Wallis test; ***P < 0.001. Photomicrograph scale bars: 50 μm; insets, 10 μm.
Figure 2. Transgenic induction of TAA in mouse has an activated WNT pathway.
(A) Schematic showing strategy for generating CC using Krt19-CreERT R26R-eYFP p53fl/fl mice. (B) Wnt7b and Wnt10a mRNA expression in Krt19-CreERT R26R-eYFP p53fl/WT or Krt19-CreERT R26R-eYFP p53WT/WT versus Krt19-CreERT R26R-eYFP p53fl/fl mice (n = 6 vs. n = 4). (C) Immunohistochemistry for CTNNB1 (red), WNT7B (pink), and YFP (green) in Krt19-CreERT R26R-eYFP p53fl/fl mice. Dotted line, the tumor—non-tumor interface. (D) Immunohistochemistry for CTNNB1. Boxes, regions that are magnified in the images below; black arrows, strong nuclear staining. (E) mRNA expression of Axin2, Lef1, Ccnd2, Sox9, and c-Myc in Krt19-CreERT R26R-eYFP p53fl/+ or Krt19-CreERT R26R-eYFP p53+/+ versus Krt19-CreERT R26R-eYFP p53fl/fl mice (n = 6 vs. n = 4). (F) Immunohistochemistry in Krt19-CreERT R26R-eYFP p53fl/fl tumors for active (dephosphorylated) CTNNB1, LEF1, CCND2, or SOX9 (red), and YFP (green) or C-MYC (brown). Data are presented as mean ± SEM. Mann-Whitney U test; *P < 0.05, **P < 0.01. Photomicrograph scale bars: 50 μm; insets, 10 μm.
Comment in
- Moving upstream in the war on WNTs.
Virshup DM. Virshup DM. J Clin Invest. 2015 Mar 2;125(3):975-7. doi: 10.1172/JCI80819. Epub 2015 Feb 17. J Clin Invest. 2015. PMID: 25689251 Free PMC article. - Biliary tract: Therapeutic strategies for cholangiocarcinoma-wishing on WNT inhibitors?
Ray K. Ray K. Nat Rev Gastroenterol Hepatol. 2015 Apr;12(4):187. doi: 10.1038/nrgastro.2015.39. Epub 2015 Mar 10. Nat Rev Gastroenterol Hepatol. 2015. PMID: 25752712 No abstract available.
Similar articles
- Moving upstream in the war on WNTs.
Virshup DM. Virshup DM. J Clin Invest. 2015 Mar 2;125(3):975-7. doi: 10.1172/JCI80819. Epub 2015 Feb 17. J Clin Invest. 2015. PMID: 25689251 Free PMC article. - Biliary tract: Therapeutic strategies for cholangiocarcinoma-wishing on WNT inhibitors?
Ray K. Ray K. Nat Rev Gastroenterol Hepatol. 2015 Apr;12(4):187. doi: 10.1038/nrgastro.2015.39. Epub 2015 Mar 10. Nat Rev Gastroenterol Hepatol. 2015. PMID: 25752712 No abstract available. - Wnt/β-catenin signaling as an emerging potential key pharmacological target in cholangiocarcinoma.
Zhang GF, Qiu L, Yang SL, Wu JC, Liu TJ. Zhang GF, et al. Biosci Rep. 2020 Mar 27;40(3):BSR20193353. doi: 10.1042/BSR20193353. Biosci Rep. 2020. PMID: 32140709 Free PMC article. Review. - Evaluation of potential targets to enhance the sensitivity of cholangiocarcinoma cells to anticancer drugs.
Sanchon-Sanchez P, Briz O, Macias RIR, Abad M, Sanchez-Martin A, Marin JJG, Lozano E. Sanchon-Sanchez P, et al. Biomed Pharmacother. 2023 Dec;168:115658. doi: 10.1016/j.biopha.2023.115658. Epub 2023 Oct 11. Biomed Pharmacother. 2023. PMID: 37832404 - Involvement of Wnt/β-catenin signaling in the mesenchymal stem cells promote metastatic growth and chemoresistance of cholangiocarcinoma.
Wang W, Zhong W, Yuan J, Yan C, Hu S, Tong Y, Mao Y, Hu T, Zhang B, Song G. Wang W, et al. Oncotarget. 2015 Dec 8;6(39):42276-89. doi: 10.18632/oncotarget.5514. Oncotarget. 2015. PMID: 26474277 Free PMC article.
Cited by
- The Tumor Immune Microenvironment plays a Key Role in Driving the Progression of Cholangiocarcinoma.
Zhang Y, Yan HJ, Wu J. Zhang Y, et al. Curr Cancer Drug Targets. 2024;24(7):681-700. doi: 10.2174/0115680096267791231115101107. Curr Cancer Drug Targets. 2024. PMID: 38213139 Review. - Cholangiocarcinoma 2020: the next horizon in mechanisms and management.
Banales JM, Marin JJG, Lamarca A, Rodrigues PM, Khan SA, Roberts LR, Cardinale V, Carpino G, Andersen JB, Braconi C, Calvisi DF, Perugorria MJ, Fabris L, Boulter L, Macias RIR, Gaudio E, Alvaro D, Gradilone SA, Strazzabosco M, Marzioni M, Coulouarn C, Fouassier L, Raggi C, Invernizzi P, Mertens JC, Moncsek A, Ilyas SI, Heimbach J, Koerkamp BG, Bruix J, Forner A, Bridgewater J, Valle JW, Gores GJ. Banales JM, et al. Nat Rev Gastroenterol Hepatol. 2020 Sep;17(9):557-588. doi: 10.1038/s41575-020-0310-z. Epub 2020 Jun 30. Nat Rev Gastroenterol Hepatol. 2020. PMID: 32606456 Free PMC article. Review. - Blocking the Wnt/β‑catenin signaling pathway to treat colorectal cancer: Strategies to improve current therapies (Review).
Chen Y, Chen M, Deng K. Chen Y, et al. Int J Oncol. 2023 Feb;62(2):24. doi: 10.3892/ijo.2022.5472. Epub 2022 Dec 29. Int J Oncol. 2023. PMID: 36579676 Free PMC article. Review. - NOTCH signalling - a core regulator of bile duct disease?
Martinez Lyons A, Boulter L. Martinez Lyons A, et al. Dis Model Mech. 2023 Sep 1;16(9):dmm050231. doi: 10.1242/dmm.050231. Epub 2023 Aug 22. Dis Model Mech. 2023. PMID: 37605966 Free PMC article. Review. - Tumor-associated macrophages promote cholangiocarcinoma progression via exosomal Circ_0020256.
Chen S, Chen Z, Li Z, Li S, Wen Z, Cao L, Chen Y, Xue P, Li H, Zhang D. Chen S, et al. Cell Death Dis. 2022 Jan 28;13(1):94. doi: 10.1038/s41419-022-04534-0. Cell Death Dis. 2022. PMID: 35091535 Free PMC article.
References
Publication types
MeSH terms
Substances
Grants and funding
- G1000868/97900/MRC_/Medical Research Council/United Kingdom
- 21139/CRUK_/Cancer Research UK/United Kingdom
- 14889/CRUK_/Cancer Research UK/United Kingdom
- MR/K017047/1/MRC_/Medical Research Council/United Kingdom
- MR/M007588/1/MRC_/Medical Research Council/United Kingdom
- WT_/Wellcome Trust/United Kingdom
- G1000868/MRC_/Medical Research Council/United Kingdom
- MR/K026666/1/MRC_/Medical Research Council/United Kingdom
- C26848/A14889/CRUK_/Cancer Research UK/United Kingdom
LinkOut - more resources
Full Text Sources
Other Literature Sources
Medical
Molecular Biology Databases
Research Materials
Miscellaneous
