Comparative study of the effectiveness and limitations of current methods for detecting sequence coevolution - PubMed (original) (raw)
Comparative Study
Comparative study of the effectiveness and limitations of current methods for detecting sequence coevolution
Wenzhi Mao et al. Bioinformatics. 2015.
Abstract
Motivation: With rapid accumulation of sequence data on several species, extracting rational and systematic information from multiple sequence alignments (MSAs) is becoming increasingly important. Currently, there is a plethora of computational methods for investigating coupled evolutionary changes in pairs of positions along the amino acid sequence, and making inferences on structure and function. Yet, the significance of coevolution signals remains to be established. Also, a large number of false positives (FPs) arise from insufficient MSA size, phylogenetic background and indirect couplings.
Results: Here, a set of 16 pairs of non-interacting proteins is thoroughly examined to assess the effectiveness and limitations of different methods. The analysis shows that recent computationally expensive methods designed to remove biases from indirect couplings outperform others in detecting tertiary structural contacts as well as eliminating intermolecular FPs; whereas traditional methods such as mutual information benefit from refinements such as shuffling, while being highly efficient. Computations repeated with 2,330 pairs of protein families from the Negatome database corroborated these results. Finally, using a training dataset of 162 families of proteins, we propose a combined method that outperforms existing individual methods. Overall, the study provides simple guidelines towards the choice of suitable methods and strategies based on available MSA size and computing resources.
Availability and implementation: Software is freely available through the Evol component of ProDy API.
© The Author 2015. Published by Oxford University Press.
Figures
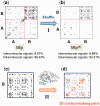
Fig. 1.
Two criteria for assessing the performance of different methods: (I) exclusion of intermolecular FPs and (II) detection of residue pairs that make intramolecular contacts. (a) and (b) The MIp and MIp(S) matrices obtained for a pair of proteins [in this case, porphobilinogen deaminase (protein A) and ribosomal 50S L1 protein (protein B)] (
Supplementary Table S1
). Residue pairs yielding the top-ranking 1% signals are displayed by dots. Shuffling reduces the percentage of intermolecular signals (FPs) from 9.57 to 6.69%. (c) and (d) The individual proteins are separately analyzed and the physical distance between coevolving pairs is evaluated by examining the corresponding structure in the PDB
Fig. 2.
Comparison of the performance of different methods. The ability of the methods to detect residue pairs that make 3D contacts is illustrated for the pair 2 in
Supplementary Table S1
. Panel (a) displays the percentage of TPs among intramolecular predictions (based on subsets of different size, from top 0.1% to top 20%), TPs being defined as residue pairs that make contacts in the 3D structure. Panels (b) and (c) show the residue pairs (blue stick representation) within γ-glutamyl phosphate reductase (top) and pantetheine phosphate adenylyl transferase (bottom) predicted among the top 1% signals by all nine methods (red lines), or eight methods (orange lines) or seven methods (yellow lines)
Fig. 3.
Comparative analysis of the performance of different methods. (a) Ability to detect residue pairs that make contacts in the 3D structure. The fraction of contact-making pairs is plotted for increasingly larger subsets of pairs predicted to be coevolving (between the strongest 0.1% and 20% signals obtained by the indicated methods). DI and PSICOV outperform all other methods. (b) Results from two tests: elimination of intermolecular signals for non-interacting pairs (top) and detection of intramolecular contact-making pairs (bottom) displayed for six methods as a function of coverage. See more details in SI,
Supplementary Figure S2
. The bars in the lower plot are broken down into four pieces corresponding to contacts of various orders (1, 2, 3, and ≥4, starting from bottom) permitting us to distinguish between local (near-neighbours along the sequence) and non-local (spatially close but sequentially distant) contacts. Top-ranking predictions made by PSICOV contain the largest proportion of non-local contacts
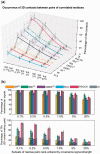
Fig. 4.
Effectiveness of shuffling algorithm as a function of MSA size and coverage. The performance of three methods before (lower surface) and after (upper surface) implementation of shuffling algorithm is compared, with respect to their ability to eliminate intermolecular FPs (a–c) and to identify evolutionarily correlated pairs that make direct contacts in the 3D structure (d–f). Shuffling algorithm partially compensates for the loss in accuracy that originates from the use of smaller size MSAs (containing for example a few hundreds of sequences) as well as that occurring with increasing coverage
Fig. 5.
Dependence of the performance of different methods on the size of the MSA. The abscissa shows the number m of sequences included in the MSAs. The ordinate shows the percentage of 3D contact-making pairs among the most strongly coevolving (top 1%) pairs of residues predicted by different methods. PSICOV and DI show a strong dependence on m. MIp(S) is distinguished by its superior performance when the number of sequences is as low as 50. See also the results for top 0.1% and 10% covarying residues in SI,
Supplementary Figure S5
. The latter case further exposes the distinctive effectiveness of MIp(S) for identifying 3D contact-making pairs
Fig. 6.
Correlation between the predictions of different methods. The entries represent the correlation coefficients calculated for the top 20% predictions made by the different methods, averaged over all proteins
Fig. 7.
Development of hybrid methods. (a) Assessment of prior probability of 3D contact, P(+), by a regression analysis of a training set of 162 structurally known protein sequences. (b) Density distributions of positive and negative signals, P(DI, PSICOV∣+) and P(DI, PSICOV∣−) (see Equation 1), modelled by kernel density estimation. (c and d) Comparative performance of the individual methods DI (gray) and PSICOV (red), and the combined naïve Bayes classifier method (Equation 1) (black), based on the fraction of intramolecular signals (c) and fraction of 3D contact-making pairs (d). The predictions based on the intersection of MIp, DI and PSICOV are shown by the green curve
Similar articles
- Evol and ProDy for bridging protein sequence evolution and structural dynamics.
Bakan A, Dutta A, Mao W, Liu Y, Chennubhotla C, Lezon TR, Bahar I. Bakan A, et al. Bioinformatics. 2014 Sep 15;30(18):2681-3. doi: 10.1093/bioinformatics/btu336. Epub 2014 May 21. Bioinformatics. 2014. PMID: 24849577 Free PMC article. - Accurate simulation and detection of coevolution signals in multiple sequence alignments.
Ackerman SH, Tillier ER, Gatti DL. Ackerman SH, et al. PLoS One. 2012;7(10):e47108. doi: 10.1371/journal.pone.0047108. Epub 2012 Oct 16. PLoS One. 2012. PMID: 23091608 Free PMC article. - Mutual information without the influence of phylogeny or entropy dramatically improves residue contact prediction.
Dunn SD, Wahl LM, Gloor GB. Dunn SD, et al. Bioinformatics. 2008 Feb 1;24(3):333-40. doi: 10.1093/bioinformatics/btm604. Epub 2007 Dec 5. Bioinformatics. 2008. PMID: 18057019 - Applications of sequence coevolution in membrane protein biochemistry.
Nicoludis JM, Gaudet R. Nicoludis JM, et al. Biochim Biophys Acta Biomembr. 2018 Apr;1860(4):895-908. doi: 10.1016/j.bbamem.2017.10.004. Epub 2017 Oct 7. Biochim Biophys Acta Biomembr. 2018. PMID: 28993150 Free PMC article. Review. - Emerging methods in protein co-evolution.
de Juan D, Pazos F, Valencia A. de Juan D, et al. Nat Rev Genet. 2013 Apr;14(4):249-61. doi: 10.1038/nrg3414. Epub 2013 Mar 5. Nat Rev Genet. 2013. PMID: 23458856 Review.
Cited by
- Dissecting mutational allosteric effects in alkaline phosphatases associated with different Hypophosphatasia phenotypes: An integrative computational investigation.
Xiao F, Zhou Z, Song X, Gan M, Long J, Verkhivker G, Hu G. Xiao F, et al. PLoS Comput Biol. 2022 Mar 23;18(3):e1010009. doi: 10.1371/journal.pcbi.1010009. eCollection 2022 Mar. PLoS Comput Biol. 2022. PMID: 35320273 Free PMC article. - Codon-level information improves predictions of inter-residue contacts in proteins by correlated mutation analysis.
Jacob E, Unger R, Horovitz A. Jacob E, et al. Elife. 2015 Sep 15;4:e08932. doi: 10.7554/eLife.08932. Elife. 2015. PMID: 26371555 Free PMC article. - Trivial and nontrivial error sources account for misidentification of protein partners in mutual information approaches.
Pontes C, Andrade M, Fiorote J, Treptow W. Pontes C, et al. Sci Rep. 2021 Mar 25;11(1):6902. doi: 10.1038/s41598-021-86455-0. Sci Rep. 2021. PMID: 33767294 Free PMC article. - Widespread evolutionary crosstalk among protein domains in the context of multi-domain proteins.
Jakubec D, Kratochvíl M, Vymĕtal J, Vondrášek J. Jakubec D, et al. PLoS One. 2018 Aug 31;13(8):e0203085. doi: 10.1371/journal.pone.0203085. eCollection 2018. PLoS One. 2018. PMID: 30169546 Free PMC article. - A genome-wide scan for correlated mutations detects macromolecular and chromatin interactions in Arabidopsis thaliana.
Perlaza-Jiménez L, Walther D. Perlaza-Jiménez L, et al. Nucleic Acids Res. 2018 Sep 19;46(16):8114-8132. doi: 10.1093/nar/gky576. Nucleic Acids Res. 2018. PMID: 29986106 Free PMC article.
References
- Bahar I., Jernigan R.L. (1996) Coordination geometry of nonbonded residues in globular proteins. Fold Des., 1, 357–370. - PubMed
- Bernstein F.C., et al. (1977) The Protein Data Bank: a computer-based archival file for macromolecular structures. J. Mol. Biol., 112, 535–542. - PubMed
Publication types
MeSH terms
Substances
Grants and funding
- 5R01 GM099738/GM/NIGMS NIH HHS/United States
- R01 GM086238/GM/NIGMS NIH HHS/United States
- 5P41 GM103712/GM/NIGMS NIH HHS/United States
- P41 GM103712/GM/NIGMS NIH HHS/United States
- R01 GM099738/GM/NIGMS NIH HHS/United States
LinkOut - more resources
Full Text Sources
Other Literature Sources
Miscellaneous


