The interplay between cyclic AMP, MAPK, and NF-κB pathways in response to proinflammatory signals in microglia - PubMed (original) (raw)
The interplay between cyclic AMP, MAPK, and NF-κB pathways in response to proinflammatory signals in microglia
Mousumi Ghosh et al. Biomed Res Int. 2015.
Abstract
Cyclic AMP is an important intracellular regulator of microglial cell homeostasis and its negative perturbation through proinflammatory signaling results in microglial cell activation. Though cytokines, TNF-α and IL-1β, decrease intracellular cyclic AMP, the mechanism by which this occurs is poorly understood. The current study examined which signaling pathways are responsible for decreasing cyclic AMP in microglia following TNF-α stimulation and sought to identify the role cyclic AMP plays in regulating these pathways. In EOC2 microglia, TNF-α produced a dramatic reduction in cyclic AMP and increased cyclic AMP-dependent PDE activity that could be antagonized by Rolipram, myristoylated-PKI, PD98059, or JSH-23, implicating a role for PDE4, PKA, MEK, and NF-κB in this regulation. Following TNF-α there were significant increases in iNOS and COX-2 immunoreactivity, phosphorylated ERK1/2 and NF-κB-p65, IκB degradation, and NF-κB p65 nuclear translocation, which were reduced in the presence of high levels of cyclic AMP, indicating that reductions in cyclic AMP during cytokine stimulation are important for removing its inhibitory action on NF-κB activation and subsequent proinflammatory gene expression. Further elucidation of the signaling crosstalk involved in decreasing cyclic AMP in response to inflammatory signals may provide novel therapeutic targets for modulating microglial cell activation during neurological injury and disease.
Figures
Figure 1
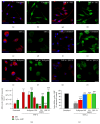
Reduced cyclic AMP levels in EOC2 microglia following TNF-α are rescued by PDE4, MEK, m-PKI, or NF-_κ_B p65 inhibition. Unstimulated, resting EOC2 microglia express very little ED1 ((a) red) and exhibit significant intracellular immunoreactivity for cyclic AMP ((b) green). Upon activation with TNF-α, there was a marked induction of ED1 (c) and a dramatic reduction in cyclic AMP (d) within 3 h. Inhibiting PDE4 activity with Rolipram in TNF-α treated microglial cells did not alter ED1 expression (e) but restored cyclic AMP (f). The antagonism of PKA with m-PKI did not alter the production of either ED1 (g) or cyclic AMP (h). Inhibiting MEK with PD98059 or p-p65Ser536 NF-kB nuclear translocation with JSH-23 reduced ED1 ((i) and (k), resp.) and also restored cyclic AMP ((j) and (l), resp.). Scale bar = 20 _μ_m. Measurements of ED1 (red) and cyclic AMP (green) immunoreactive (IR) signal intensity were obtained in microglia using fluorescent microscopy and Image J software for the different imaged conditions (m). Quantitation of cyclic AMP concentrations in TNF-α challenged microglial cells (i) showed the restoration of cyclic AMP to resting levels following treatment with inhibitors of PKA, ERK, and NF-_κ_B and partially with PDE4. Results shown are the average from three independent culture plate replicates for each treatment condition examined. Cell nuclei are visualized using the nuclear stain Hoechst (blue). Errors are given as SEMs. Statistical significance relative to naive controls is indicated at * P < 0.05, ** P < 0.01, or *** P < 0.001 and versus TNF-α stimulated cells at ### P < 0.001.
Figure 2
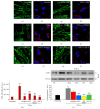
TNF-α induced increases in COX-2 are perturbed by the inhibition of PDE4, MEK, PKA, or NF-_κ_B p65 in microglia. Unstimulated, resting EOC2 microglia, the morphology of which was demarcated by phalloidin-488 staining ((a) green), showed very little expression of COX-2 ((b) red). Upon stimulation with TNF-α, there was a marked production within 3 h of COX-2 in the cytoplasm (d). Inhibiting PDE4 activity with Rolipram (f), PKA with m-PKI (h), MEK with PD98059 (j), or NF-_κ_B translocation with JSH-23 (l) significantly reduced COX-2 immunoreactivity in TNF-α treated microglial cells. Measurements of COX-2 (red) immunoreactive signal intensity were obtained in microglia using fluorescent microscopy and Image J software for the different imaged conditions (m). Confirmation of changes in COX-2 was then confirmed by immunoblot (n). Quantification of COX-2 levels was performed by densitometry analysis (arbitrary units) normalized to _β_-actin. Stimulation of microglia with TNF-α (gray bar) produced a significant increase in COX-2 band intensity, recognized at 72 kDa, compared to untreated controls (black bar). Antagonism of PDE4 (red bar), PKA (blue bar), MEK (yellow bar), or NF-_κ_B (green bar) all significantly perturbed the increase in COX-2 observed in microglia after TNF-α stimulation. Results shown are the average from three independent culture plate replicates for each treatment examined. Cell nuclei are visualized using the nuclear stain Hoechst (blue). Scale bar = 20 _μ_m. Errors are given as SEMs. Statistical significance relative to naive controls is indicated at ** P < 0.01 and versus TNF-α stimulated cells at # P < 0.05 or ### P < 0.001.
Figure 3
TNF-α induced increases in iNOS are inhibited by the antagonism of PDE4 or NF-_κ_B p65 in microglia. In unstimulated, resting EOC2 microglia with their morphology shown by phalloidin-488 staining ((a) green), iNOS expression was low ((b) red). Upon stimulation with TNF-α there was significant iNOS production within 3 h (d). Inhibiting PDE4 activity with Rolipram (f) or NF-_κ_B translocation with JSH-23 (h) significantly reduced iNOS immunoreactivity in TNF-α treated microglial cells. Measurements of iNOS (red) immunoreactive (IR) signal intensity were obtained in microglia using fluorescent microscopy and Image J software for the different imaged conditions (m). Results shown are the average from three independent culture plate replicates for each treatment examined. Cell nuclei are visualized using the nuclear stain Hoechst (blue). Scale bar = 20 _μ_m. Errors are given as SEMs. Statistical significance relative to naive controls is indicated at *** P < 0.001 and versus TNF-α stimulated cells at ### P < 0.001.
Figure 4
TNF-α reduced levels of catalytic pPKAcat_α_ Thr197 and altered its subcellular localization while increasing cytosolic levels of activated pERK 1/2Thr-202/Tyr-204 in EOC2 microglia. Compared to the levels of pPKAcat_α_ Thr197 (red) in resting EOC2 microglia (a–c), TNF-α stimulation (d–f) produced a significant reduction in pPKAcat_α_ Thr197 immunoreactivity as well as altered its subcellular localization from a diffuse to particulate cytosolic appearance at 3 h. Western blot analysis of the total cell lysates of untreated and TNF-α stimulated EOC2 microglia showed no change in total PKAcat_α_ (g-h) and confirmed quantitatively the significant reduction in pPKAcat_α_ Thr197 within 3 h of stimulation, which remained depressed through 24 h (i-j). Quantification of pPKAcat_α_ Thr197 levels using immunoblot densitometry values (arbitrary units) normalized to _β_-actin (j). Conversely, pERK 1/2Thr-202/Tyr-204 immunoreactivity (green), which was almost undetectable in resting microglia (k–m), was significantly increased within 3 h of stimulation with TNF-α (n–p). Western blot analysis confirmed the upregulation of pERK 1/2Thr-202/Tyr-204 at 3 h post-TNF-α activation, though by 24 h these levels had returned to near normal values (q-r). Quantification of ERK 1/2Thr-202/Tyr-204 levels by densitometry analysis (arbitrary units) normalized to _β_-actin (r). The results shown are the averages from three independent culture plate replicates for each treatment condition; the bands from all three (g) or two (o) of the replicates are presented on the blot images. Scale bars = 20 _μ_m. Errors are given as SEMs. Statistical significance relative to naive controls is indicated at ** P < 0.01 and versus 24 h post-TNF-α stimulation at # P < 0.05 or ## P < 0.01.
Figure 5
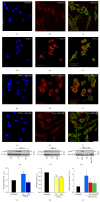
Elevating cyclic AMP levels in TNF-α activated microglia using the PDE4 inhibitor Rolipram or a cyclic AMP analog inhibits nuclear translocation of p-p65Ser-536. Resting EOC2 microglial cells (a–c) showed very little p-p65Ser-536 immunoreactivity (red). Within 3 h of TNF-α stimulation, robust nuclear immunoreactivity for p-p65Ser-536 was observed (d–f). Treatment of TNF-α activated cells with either the PDE4 inhibitor Rolipram (g–i) or the cyclic AMP analogue db-cyclic AMP (j–l) significantly reduced nuclear p-p65Ser-536 immunoreactivity, with p-p65Ser-536 appearing to have been sequestered in the cytoplasm. Cell morphology is demarcated by staining with Alexa 488-tagged phalloidin (green) and the nuclear dye Hoechst (blue). Scale bar = 30 μ_m. White arrows and white asterisks show pronounced p-p65Ser-536 immunoreactivity within the nuclear and cytoplasmic compartments, respectively, among TNF-α stimulated microglia and TNF-α stimulated microglia with Rolipram. Immunoblotting of EOC2 microglial cell lysates showed significantly elevated levels of p-p65Ser-536 at 3 h following stimulation with TNF-α (m), which had returned to normal levels by 24 h. Quantification of p-p65Ser-536 levels by densitometry analysis (arbitrary units) normalized to β_-actin (n). Immunoblotting for p-I_κ_B_α following TNF-α showed a persistent decrease through 24 h in EOC2 microglial cells (o). Quantification of p-I_κ_B_α levels by densitometry analysis (arbitrary units) normalized to _β_-actin (p). Western blot analysis of the purified nuclear fraction showed a trend towards elevated levels of nuclear p-p65Ser-536 following TNF-α, which did not occur in the presence of cyclic AMP elevating agents Rolipram or db-cyclic AMP (q). Quantification of nuclear p-p65Ser-536 levels by densitometry analysis (arbitrary units) normalized to p-84 nuclear matrix protein (r) revealed a trend for a cyclic AMP effect on nuclear p-p65Ser-536 after TNF-α, though no statistical significance was indicated. The results shown are the averages from four independent culture plate replicates for each treatment condition; the bands from up to two of the replicates are presented on the blot images. Errors are given as SEMs. Statistical significance to naive controls is indicated at, * P < 0.05, ** P < 0.01, or *** P < 0.001.
Figure 6
Antagonism of PDE4, PKA, MEK, and NF-_κ_B reduces cyclic AMP-dependent PDE activity in TNF-α stimulated microglia. In TNF-α stimulated microglia, the effect of antagonism of PKA, MEK, and NF-_κ_B on pde4b2 expression was measured using Q-PCR (a). At 3 h after exposure to TNF-α, pde4b2 mRNA expression increased 2.5–3.0-fold in microglia compared to untreated controls, similar to that previously reported [21]. The addition of m-PKI or JSH-23, but not PD98059, showed a trend for a reduction in pde4b2 expression, though it was not statistically significant at this time point. Next, the effect of inhibiting PDE4, PKA, MEK, and NF-_κ_B on cyclic AMP-dependent PDE activity in microglia at 3 h after TNF-α challenge was investigated (b). Compared to TNF-α only stimulated controls (gray bar), the addition of Rolipram (red bar), m-PKI (blue bar), PD98059 (yellow bar), or JSH-23 (green bar) all significantly reduced cyclic AMP-dependent PDE activity by at least 50%. The results shown are obtained from three independent culture plate replicates for each treatment condition. Errors are given as SEMs. Statistical significance versus TNF-α stimulated cells is given at ### P < 0.001.
Figure 7
NF-_κ_B and PKA are important for TNF-_α_-induced increases in microglial cell phagocytic function. Phagocytic uptake of phycoerythrin-conjugated latex beads (red) is low in resting cells (a), though it is dramatically increased upon microglial cell activation with TNF-α (b). Elevating cyclic AMP levels in TNF-α stimulated EOC2 microglial cells by inhibiting PDE4 activity with Rolipram (c) or adding either PKA-specific cyclic AMP analog, db-cyclic AMP (f), or an EPAC-specific cyclic AMP analog, CPT-2′methyl cyclic AMP (g) does not reduce phagocytic ability. Conversely, antagonism of PKA with m-PKI peptide (d) or inhibition of p65 nuclear translocation with JSH-23 (e) reduces phagocytic activity in TNF-α stimulated microglia to levels comparative to untreated controls. Scale bar = 20 _μ_m. Cell morphology is shown by staining with phalloidin-488 (green) and the nuclear dye Hoechst (blue). Quantification of the percent of EOC2 microglial cells showing phagocytic uptake of PE-conjugated latex beads with different treatment conditions (h). The results shown are obtained from four independent culture plate replicates for each treatment condition. Errors are given as SEMs. Statistical significance to naive controls is indicated at ** P < 0.01 or *** P < 0.001 and versus 24 h post-TNF-α stimulation at ### P < 0.001.
Figure 8
Cell signaling schema illustrating the proposed interactions between the PDE-PKA-cyclic AMP, MAPK, and NF-_κ_B pathways in regulating proinflammatory microglial cell phenotype and function in response to TNF-α. This cell diagram shows the proposed interactions between PDE-PKA-cyclic AMP, MAPK, and NF-_κ_B pathways in the cytoplasm and nucleus of microglia in response to TNF-α stimulation. These interactions control the proinflammatory gene program that alters microglial cell phenotype and function.
Similar articles
- Proinflammatory cytokine regulation of cyclic AMP-phosphodiesterase 4 signaling in microglia in vitro and following CNS injury.
Ghosh M, Garcia-Castillo D, Aguirre V, Golshani R, Atkins CM, Bramlett HM, Dietrich WD, Pearse DD. Ghosh M, et al. Glia. 2012 Dec;60(12):1839-59. doi: 10.1002/glia.22401. Epub 2012 Aug 2. Glia. 2012. PMID: 22865690 Free PMC article. - Daphnetin attenuates microglial activation and proinflammatory factor production via multiple signaling pathways.
Yu W, Wang H, Ying H, Yu Y, Chen D, Ge W, Shi L. Yu W, et al. Int Immunopharmacol. 2014 Jul;21(1):1-9. doi: 10.1016/j.intimp.2014.04.005. Epub 2014 Apr 18. Int Immunopharmacol. 2014. PMID: 24747094 - (+)-Catechin Attenuates NF-κB Activation Through Regulation of Akt, MAPK, and AMPK Signaling Pathways in LPS-Induced BV-2 Microglial Cells.
Syed Hussein SS, Kamarudin MN, Kadir HA. Syed Hussein SS, et al. Am J Chin Med. 2015;43(5):927-52. doi: 10.1142/S0192415X15500548. Am J Chin Med. 2015. PMID: 26227399 - Mutual regulation of metabolic processes and proinflammatory NF-κB signaling.
Kracht M, Müller-Ladner U, Schmitz ML. Kracht M, et al. J Allergy Clin Immunol. 2020 Oct;146(4):694-705. doi: 10.1016/j.jaci.2020.07.027. Epub 2020 Aug 6. J Allergy Clin Immunol. 2020. PMID: 32771559 Review. - Cyclic AMP: a selective modulator of NF-κB action.
Gerlo S, Kooijman R, Beck IM, Kolmus K, Spooren A, Haegeman G. Gerlo S, et al. Cell Mol Life Sci. 2011 Dec;68(23):3823-41. doi: 10.1007/s00018-011-0757-8. Epub 2011 Jul 9. Cell Mol Life Sci. 2011. PMID: 21744067 Free PMC article. Review.
Cited by
- MKP-1 negative regulates Staphylococcus aureus induced inflammatory responses in Raw264.7 cells: roles of PKA-MKP-1 pathway and enhanced by rolipram.
Pan Y, Xu C, Pan ZK. Pan Y, et al. Sci Rep. 2017 Sep 28;7(1):12366. doi: 10.1038/s41598-017-10187-3. Sci Rep. 2017. PMID: 28959039 Free PMC article. - Cyclic AMP is a key regulator of M1 to M2a phenotypic conversion of microglia in the presence of Th2 cytokines.
Ghosh M, Xu Y, Pearse DD. Ghosh M, et al. J Neuroinflammation. 2016 Jan 13;13:9. doi: 10.1186/s12974-015-0463-9. J Neuroinflammation. 2016. PMID: 26757726 Free PMC article. - Modulating Neuroinflammation as a Prospective Therapeutic Target in Alzheimer's Disease.
Lee E, Chang Y. Lee E, et al. Cells. 2025 Jan 22;14(3):168. doi: 10.3390/cells14030168. Cells. 2025. PMID: 39936960 Free PMC article. Review. - Pharmacological Modulation of Functional Phenotypes of Microglia in Neurodegenerative Diseases.
Song GJ, Suk K. Song GJ, et al. Front Aging Neurosci. 2017 May 15;9:139. doi: 10.3389/fnagi.2017.00139. eCollection 2017. Front Aging Neurosci. 2017. PMID: 28555105 Free PMC article. Review.
References
- Popovich P. G., Guan Z., McGaughy V., Fisher L., Hickey W. F., Basso D. M. The neuropathological and behavioral consequences of intraspinal microglial/macrophage activation. Journal of Neuropathology & Experimental Neurology. 2002;61(7):623–633. - PubMed
Publication types
MeSH terms
Substances
Grants and funding
- R01 NS056281/NS/NINDS NIH HHS/United States
- R01 NS042133/NS/NINDS NIH HHS/United States
- NINDS 056072/PHS HHS/United States
- NINDS 056281/PHS HHS/United States
- R01 NS056072/NS/NINDS NIH HHS/United States
LinkOut - more resources
Full Text Sources
Other Literature Sources
Molecular Biology Databases
Research Materials
Miscellaneous


