Forkhead Box O6 (FoxO6) Depletion Attenuates Hepatic Gluconeogenesis and Protects against Fat-induced Glucose Disorder in Mice - PubMed (original) (raw)
. 2015 Jun 19;290(25):15581-15594.
doi: 10.1074/jbc.M115.650994. Epub 2015 May 5.
Jun Yamauchi 2, Sojin Lee 1, Ting Zhang 1, Yun-Zi Liu 3, Kelsey Sadlek 1, Gina M Coudriet 4, Jon D Piganelli 4, Chun-Lei Jiang 5, Rita Miller 1, Mark Lowe 1, Hideyoshi Harashima 6, H Henry Dong 7
Affiliations
- PMID: 25944898
- PMCID: PMC4505471
- DOI: 10.1074/jbc.M115.650994
Forkhead Box O6 (FoxO6) Depletion Attenuates Hepatic Gluconeogenesis and Protects against Fat-induced Glucose Disorder in Mice
Virtu Calabuig-Navarro et al. J Biol Chem. 2015.
Abstract
Excessive endogenous glucose production contributes to fasting hyperglycemia in diabetes. FoxO6 is a distinct member of the FoxO subfamily. To elucidate the role of FoxO6 in hepatic gluconeogenesis and assess its contribution to the pathogenesis of fasting hyperglycemia in diabetes, we generated FoxO6 knock-out (FoxO6-KO) mice followed by determining the effect of FoxO6 loss-of-function on hepatic gluconeogenesis under physiological and pathological conditions. FoxO6 depletion attenuated hepatic gluconeogenesis and lowered fasting glycemia in FoxO6-KO mice. FoxO6-deficient primary hepatocytes were associated with reduced capacities to produce glucose in response to glucagon. When fed a high fat diet, FoxO6-KO mice exhibited significantly enhanced glucose tolerance and reduced blood glucose levels accompanied by improved insulin sensitivity. These effects correlated with attenuated hepatic gluconeogenesis in FoxO6-KO mice. In contrast, wild-type littermates developed fat-induced glucose intolerance with a concomitant induction of fasting hyperinsulinemia and hyperglycemia. Furthermore, FoxO6-KO mice displayed significantly diminished macrophage infiltration into liver and adipose tissues, correlating with the reduction of macrophage expression of C-C chemokine receptor 2 (CCR2), a factor that is critical for regulating macrophage recruitment in peripheral tissues. Our data indicate that FoxO6 depletion protected against diet-induced glucose intolerance and insulin resistance by attenuating hepatic gluconeogenesis and curbing macrophage infiltration in liver and adipose tissues in mice.
Keywords: FoxO6; diabetes; gluconeogenesis; glucose metabolism; liver; mice; obesity.
© 2015 by The American Society for Biochemistry and Molecular Biology, Inc.
Figures
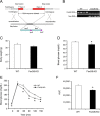
FIGURE 1.
Effect of FoxO6 deletion on glucose metabolism. A, schematic depiction of FoxO6 gene deletion. Shown is the FoxO6 locus on the chromosome 4. Neo stands for the neomycin-resistant gene. LacZ encodes bacterial β-galactosidase. B, genotyping of WT and FoxO6-KO mice. Genomic DNA isolated from mouse tail was subjected to PCR analysis using primers specific for FoxO6 or Neo gene. PCR products were resolved by agarose gel electrophoresis. C, body weight. D, blood glucose. Blood glucose levels were determined after 16-h fasting. E, glucose tolerance test. Mice were fasted for 16 h followed by intraperitoneal injection of glucose (2 g/kg body weight). Blood glucose levels before and at different times post glucose injection were determined. F, area under curve. AUC was calculated from blood glucose profiles during the glucose tolerance test. Data in panels C–F were obtained from male FoxO6-KO mice (n = 14) and age/sex-matched WT littermates (n = 7) on regular chow at 4 months of age. *, p < 0.05 versus WT control.
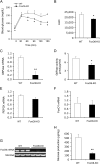
FIGURE 2.
Effect of FoxO6 deletion on hepatic gluconeogenesis. A, pyruvate tolerance test. B, AUC. The AUC was calculated from blood glucose profiles during pyruvate tolerance test. C, G6Pase mRNA levels. D, hepatic G6Pase activity. E, PEPCK mRNA levels. F, FoxO1 mRNA levels. G, hepatic FoxO6 mRNA. Mice were sacrificed after 16-h fasting. Liver tissues were used for isolating total RNA, which was subjected to real-time qRT-PCR analysis. Hepatic G6Pase, PEPCK, FoxO1, and FoxO6 mRNA levels were determined using 18S RNA as control. Aliquots of liver tissues (40 mg) were used for the preparation of microsomes, which were subjected to G6Pase activity assay for determining hepatic G6Pase activity, defined as the production of Pi (in μmole) per unit time (in minutes) per μg of cellular microsomes. H, glucose production in mouse primary hepatocytes. Mouse primary hepatocytes of FoxO6-KO and WT mice were cultured in the absence or presence of 8-cpt-cAMP (cAMP analog, 500 μ
m
) and dexamethasone (100 μ
m
). Each condition was run in six replicates. After 24-h of incubation, the amount of glucose released from hepatocytes into culture medium was determined. Data in panels A–G were obtained from male FoxO6-KO mice (n = 14) and age/sex-matched WT littermates (n = 7) on regular chow at 4 months of age. p < 0.05 (*) and p < 0.001 (**) versus WT control.
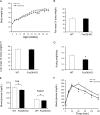
FIGURE 3.
Glucose metabolism in FoxO6-KO mice on high fat diet. A, growth curve. Mice were fed a high fat diet at 4 weeks of age for 16 weeks. Body weight was determined weekly. B, fat mass. Fat mass was determined by MRI. C, lean mass. Lean mass was determined by MRI. D, food intake. Food intake per mouse during a 24-h period was determined for two consecutive days. E, blood glucose levels. Fed blood glucose levels were determined in fed states, and fasting blood glucose levels were determined after 16-h fasting. F, glucose tolerance test. Data were obtained from high fat-fed male FoxO6-KO (n = 9) and age/sex-matched WT littermates (n = 8) at 20–22 weeks of age. *, p < 0.05 versus WT control.
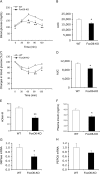
FIGURE 4.
Effect of FoxO6 depletion on hepatic gluconeogenesis and insulin sensitivity in high fat-fed FoxO6-KO mice. A, pyruvate tolerance test. B, AUC. AUC was calculated from blood glucose profiles during pyruvate tolerance test. C, insulin tolerance test. Mice were injected intraperitoneally with regular human insulin (1.5 IU/kg) followed by determination of blood glucose levels. D, AUC. AUC was calculated from blood glucose profiles during insulin tolerance test. E, HOMA-IR. The HOMA-IR was determined by multiplying fasting blood glucose (mmol/liter) and fasting plasma insulin (μIU/ml) levels, divided by 22.5. F, fasting plasma insulin levels. Plasma insulin levels were determined after 16-h fasting. G, G6Pase mRNA levels. H, PEPCK mRNA levels. Data were obtained from high fat-fed male FoxO6-KO (n = 9) and age/sex-matched WT littermates (n = 8) at 20–22 weeks of age. Hepatic G6Pase and PEPCK mRNA levels were determined by real-time qRT-PCR using 18S RNA as control. *, p < 0.05 versus WT control.
FIGURE 5.
Effect of FoxO6 depletion on energy homeostasis in high fat-fed FoxO6-KO mice. Male FoxO6-KO (n = 9, 22 weeks old) and age/sex-matched WT littermates (n = 8) after 16-weeks of high fat feeding were subjected to metabolic cage studies. Mice were placed individually in metabolic cages with free access to food and water in the Oxymax Lab Animal Monitoring System. After acclamation for 2 days, oxygen consumption and respiratory exchange ratio of mice were determined during a 48-h period. A, the respiratory exchange ratio (RER) in a 12-h light/dark cycle. B, the mean respiratory exchange ratio. C, the oxygen consumption rate. D, the mean oxygen consumption rate. *, p < 0.05 versus WT control.
FIGURE 6.
Effect of FoxO6 depletion on Kupffer cell content in the liver. Liver tissues were obtained from high fat-fed WT control (A) and FoxO6-KO mice (B) as described in Fig. 5. Frozen sections of liver tissues were subjected to anti-F4/80 immunohistochemistry. F4/80 positive cells (stained red) were counted and normalized to the total number of cells (with nuclei stained blue by DAPI) in liver sections (C). Aliquots of liver tissues (20 mg) were used for the preparation of total RNA, which was subjected to real-time qRT-PCR using 18S RNA as the control for determining F4/80, CD68, IL-1β, TNFα, IL6, CCR2, CCL2, CCL3, and CCL7 mRNA levels (D). Frozen sections (6 μm) of liver tissues from high fat-fed WT (E) and FoxO6-KO (F) mice were subjected to oil red O staining. In addition, aliquots of liver tissues (20 mg) were used for determining hepatic lipid content, which was defined as mg of triglyceride (TG) per gram of liver protein (G). *, p < 0.05 versus WT control. n = 8–9 per group. Bar, 50 μm.
FIGURE 7.
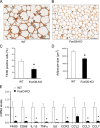
Effect of FoxO6 depletion on macrophage infiltration in adipose tissues. Adipose tissues were procured from high fat-fed WT control (A) and FoxO6-KO mice (B) as described in Fig. 5. Paraffin-embedded adipose tissues were subjected to anti-F4/80 immunohistochemistry. F4/80-positive cells (stained brown) were scored and normalized to the total number of adipose cells (C). In addition, the size of adipose cells was determined and compared between control and FoxO6-KO groups (D). Epididymal adipose tissues were minced for the preparation of stromal vascular cells. Total RNA was isolated from stromal vascular cells and subjected to real-time qRT-PCR using 18S RNA as control for determining F4/80, CD68, IL-1β, TNFα, IL-6, CCR2, CCL2, CCL3, and CCL7 mRNA levels (E). *, p < 0.05 versus WT control. n = 8–9 per group. Bar, 100 μm.
Similar articles
- FoxO6 integrates insulin signaling with gluconeogenesis in the liver.
Kim DH, Perdomo G, Zhang T, Slusher S, Lee S, Phillips BE, Fan Y, Giannoukakis N, Gramignoli R, Strom S, Ringquist S, Dong HH. Kim DH, et al. Diabetes. 2011 Nov;60(11):2763-74. doi: 10.2337/db11-0548. Epub 2011 Sep 22. Diabetes. 2011. PMID: 21940782 Free PMC article. - FoxO6 in glucose metabolism (FoxO6).
Kim DH, Zhang T, Lee S, Dong HH. Kim DH, et al. J Diabetes. 2013 Sep;5(3):233-40. doi: 10.1111/1753-0407.12027. Epub 2013 May 28. J Diabetes. 2013. PMID: 23324123 Free PMC article. Review. - FoxO6-mediated ApoC3 upregulation promotes hepatic steatosis and hyperlipidemia in aged rats fed a high-fat diet.
Kim DH, Lee S, Noh SG, Lee J, Chung HY. Kim DH, et al. Aging (Albany NY). 2024 Mar 3;16(5):4095-4115. doi: 10.18632/aging.205610. Epub 2024 Mar 3. Aging (Albany NY). 2024. PMID: 38441531 Free PMC article. - Dexamethasone-induced Krüppel-like factor 9 expression promotes hepatic gluconeogenesis and hyperglycemia.
Cui A, Fan H, Zhang Y, Zhang Y, Niu D, Liu S, Liu Q, Ma W, Shen Z, Shen L, Liu Y, Zhang H, Xue Y, Cui Y, Wang Q, Xiao X, Fang F, Yang J, Cui Q, Chang Y. Cui A, et al. J Clin Invest. 2019 Apr 29;129(6):2266-2278. doi: 10.1172/JCI66062. eCollection 2019 Apr 29. J Clin Invest. 2019. PMID: 31033478 Free PMC article. - FoxO integration of insulin signaling with glucose and lipid metabolism.
Lee S, Dong HH. Lee S, et al. J Endocrinol. 2017 May;233(2):R67-R79. doi: 10.1530/JOE-17-0002. Epub 2017 Feb 17. J Endocrinol. 2017. PMID: 28213398 Free PMC article. Review.
Cited by
- Functions of Forkhead Box O on Glucose Metabolism in Abalone Haliotis discus hannai and Its Responses to High Levels of Dietary Lipid.
Wang L, Guo Y, Pan M, Li X, Huang D, Liu Y, Wu C, Zhang W, Mai K. Wang L, et al. Genes (Basel). 2021 Feb 20;12(2):297. doi: 10.3390/genes12020297. Genes (Basel). 2021. PMID: 33672704 Free PMC article. - Role of FoxO transcription factors in aging and age-related metabolic and neurodegenerative diseases.
Du S, Zheng H. Du S, et al. Cell Biosci. 2021 Nov 2;11(1):188. doi: 10.1186/s13578-021-00700-7. Cell Biosci. 2021. PMID: 34727995 Free PMC article. Review. - Interaction between CHOP and FoxO6 promotes hepatic lipid accumulation.
Kim DH, Kim BM, Chung KW, Choi YJ, Yu BP, Chung HY. Kim DH, et al. Liver Int. 2020 Nov;40(11):2706-2718. doi: 10.1111/liv.14594. Epub 2020 Jul 26. Liver Int. 2020. PMID: 32639626 Free PMC article. - Elevated FOXO6 expression correlates with progression and prognosis in gastric cancer.
Wang JH, Tang HS, Li XS, Zhang XL, Yang XZ, Zeng LS, Ruan Q, Huang YH, Liu GJ, Wang J, Cui SZ. Wang JH, et al. Oncotarget. 2017 May 9;8(19):31682-31691. doi: 10.18632/oncotarget.15920. Oncotarget. 2017. PMID: 28404958 Free PMC article. - Treatment with a Catalytic Superoxide Dismutase (SOD) Mimetic Improves Liver Steatosis, Insulin Sensitivity, and Inflammation in Obesity-Induced Type 2 Diabetes.
Coudriet GM, Delmastro-Greenwood MM, Previte DM, Marré ML, O'Connor EC, Novak EA, Vincent G, Mollen KP, Lee S, Dong HH, Piganelli JD. Coudriet GM, et al. Antioxidants (Basel). 2017 Nov 1;6(4):85. doi: 10.3390/antiox6040085. Antioxidants (Basel). 2017. PMID: 29104232 Free PMC article.
References
- Edgerton D. S., Johnson K. M., Cherrington A. D. (2009) Current strategies for the inhibition of hepatic glucose production in type 2 diabetes. Front. Biosci. 14, 1169–1181 - PubMed
- Wahren J., Ekberg K. (2007) Splanchnic regulation of glucose production. Annu. Rev. Nutr. 27, 329–345 - PubMed
- Ekberg K., Landau B. R., Wajngot A., Chandramouli V., Efendic S., Brunengraber H., Wahren J. (1999) Contributions by kidney and liver to glucose production in the postabsorptive state and after 60 h of fasting. Diabetes 48, 292–298 - PubMed
- Tonelli J., Kishore P., Lee D. E., Hawkins M. (2005) The regulation of glucose effectiveness: how glucose modulates its own production. Curr. Opin. Clin. Nutr. Metab. Care 8, 450–456 - PubMed
- Rossetti L., Massillon D., Barzilai N., Vuguin P., Chen W., Hawkins M., Wu J., Wang J. (1997) Short term effects of leptin on hepatic gluconeogenesis and in vivo insulin action. J. Biol. Chem. 272, 27758–27763 - PubMed
Publication types
MeSH terms
Substances
LinkOut - more resources
Full Text Sources
Medical
Molecular Biology Databases
Research Materials
