Glypican-1 identifies cancer exosomes and detects early pancreatic cancer - PubMed (original) (raw)
. 2015 Jul 9;523(7559):177-82.
doi: 10.1038/nature14581. Epub 2015 Jun 24.
Linda B Luecke 1, Christoph Kahlert 1, Agustin F Fernandez 2, Seth T Gammon 3, Judith Kaye 1, Valerie S LeBleu 1, Elizabeth A Mittendorf 4, Juergen Weitz 5, Nuh Rahbari 5, Christoph Reissfelder 5, Christian Pilarsky 5, Mario F Fraga 6, David Piwnica-Worms 3, Raghu Kalluri 1
Affiliations
- PMID: 26106858
- PMCID: PMC4825698
- DOI: 10.1038/nature14581
Glypican-1 identifies cancer exosomes and detects early pancreatic cancer
Sonia A Melo et al. Nature. 2015.
Erratum in
- Author Correction: Glypican-1 identifies cancer exosomes and detects early pancreatic cancer.
Melo SA, Luecke LB, Kahlert C, Fernandez AF, Gammon ST, Kaye J, LeBleu VS, Mittendorf EA, Weitz J, Rahbari N, Reissfelder C, Pilarsky C, Fraga MF, Piwnica-Worms D, Kalluri R. Melo SA, et al. Nature. 2022 Oct;610(7932):E15-E17. doi: 10.1038/s41586-022-05062-9. Nature. 2022. PMID: 36198804 No abstract available.
Abstract
Exosomes are lipid-bilayer-enclosed extracellular vesicles that contain proteins and nucleic acids. They are secreted by all cells and circulate in the blood. Specific detection and isolation of cancer-cell-derived exosomes in the circulation is currently lacking. Using mass spectrometry analyses, we identify a cell surface proteoglycan, glypican-1 (GPC1), specifically enriched on cancer-cell-derived exosomes. GPC1(+) circulating exosomes (crExos) were monitored and isolated using flow cytometry from the serum of patients and mice with cancer. GPC1(+) crExos were detected in the serum of patients with pancreatic cancer with absolute specificity and sensitivity, distinguishing healthy subjects and patients with a benign pancreatic disease from patients with early- and late-stage pancreatic cancer. Levels of GPC1(+) crExos correlate with tumour burden and the survival of pre- and post-surgical patients. GPC1(+) crExos from patients and from mice with spontaneous pancreatic tumours carry specific KRAS mutations, and reliably detect pancreatic intraepithelial lesions in mice despite negative signals by magnetic resonance imaging. GPC1(+) crExos may serve as a potential non-invasive diagnostic and screening tool to detect early stages of pancreatic cancer to facilitate possible curative surgical therapy.
Conflict of interest statement
The authors declare no competing financial interests.
Figures
Extended Data Figure 1. Exosomes isolation
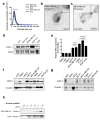
a, Exosomes concentration and size distribution by NanoSight® analysis of culture supernatant from NIH/3T3, MCF10A, HDF, MDA-MB-231 and E10 cells. Size mode: 105 nanometers (nm; 3 technical replicates). b, Transmission electron microscopy (TEM) micrograph of MDA-MB-231-derived exosomes. Upper right image shows a digitally zoomed inset. c, TEM micrograph of MDA-MB-231-derived exosomes following immunogold labeling for CD9. Gold particles are depicted as black dots. Upper right image shows a digitally zoomed inset.d, Immunoblot of flotillin1 and CD81 in exosomal proteins extracted from culture supernatant of E10, NIH/3T3, MDA-MB-231, MCF10A and HDF cells. e, RT–qPCR measurement of GPC1 mRNA levels in HMEL, HDF, HMLE, MCF7, MDA-MB-231, T3M4, Panc-1, MIA Paca2. Results are shown as mean ± standard deviation; n=3, 3 biological replicates, with 3 technical replicates each. f, Immunoblot of GPC1 in HMEL, HDF, HMLE, MCF7, MDA-MB-231, T3M4, Panc-1 and MIA Paca2 cell lysates (upper panel). β-actin was used as a loading control (lower panel). g, Immunoblot of GPC1 in exosomal protein lysates derived from the culture supernatant of 3 non-tumorigenic cell lines (HDF, HMEL, HMLE) and 5 tumorigenic cell lines (MCF7, MDA-MB-231, T3M4, Panc-1, MIA Paca2) (upper panel). Immunoblot of flotillin1 was used as loading control (lower panel). h, Immunoblot of flotillin1 in exosomal protein lysates from the culture supernatant of MDA-MB-231 and T3M4 following sucrose gradient purification. The protein content is assayed in each of the density layers listed.
Extended Data Figure 2. NanoSight® analysis in human serum samples
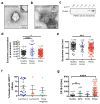
a, Transmission electron microscopy (TEM) micrograph of cancer patient serum-derived exosomes. Upper right image shows a digitally zoomed inset. b, TEM micrograph of cancer patient serum-derived exosomes following immunogold labeling for CD9. Gold particles are depicted as black dots. Upper right image shows a digitally zoomed inset.c, Immunoblot of flotillin1 of exosomal protein lysates from serum of cancer patient following exosomes purification by sucrose gradient. The protein content is assayed in each of the density layers listed. d, Exosomes concentration by NanoSight® analysis showing the number of exosomes per 1 ml of serum derived from healthy donors (n=100), from breast cancer patients (n=32) and from patients with a pancreatic ductal adenocarcinoma (PDAC, n=190). ANOVA, post-hoc Tamhane T2, * P<0.05, **** P<0.0001; 3 technical replicates.e, Exosomes size distribution by NanoSight® analysis showing the mode size of exosomes in 1 ml of serum derived from healthy donors (n=100), from breast cancer patients (n=32) and from patients with a pancreatic ductal adenocarcinoma (PDAC, n=190). ANOVA, post-hoc Tukey-Kramer test, *** P<0.001; 3 technical replicates.f, Scatter dot plots depicting the percentage of beads with GPC1+ bound exosomes purified from the serum of breast cancer patients. The patients are subdivided into three subtypes: Luminal A, Luminal B and Triple Negative breast cancer. g, Scatter plots depicting the serum CA 19-9 concentration (U/mL), evaluated by ELISA, in healthy donors (n=100), patients with benign pancreas disease (BPD, n=26), pancreas cancer precursor lesion (PCPL, n=5) and pancreatic ductal adenocarcinoma (PDAC, n=190). Discovery cohort, ANOVA, post-hoc Tamhane T2 * P<0.05; **** P<0.0001; 3 technical replicates. Data is presented as the mean ± standard deviation.
Extended Data Figure 3. Tumor stage-specific analysis
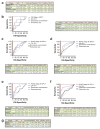
a, Table associated with receiver Operating Characteristic (ROC) curve analysis depicted in Figure 1f. b–f, ROC curve analysis for percent GPC1+ crExos (red line), CA 19-9 serum levels (blue scattered line), exosomes concentration (black line) and exosomes size (scattered black line) in patients with carcinoma in situ (CIS) or stage I pancreatic cancer (n=5) (a), stage IIa pancreatic cancer (n=18) (b), stage IIb pancreatic cancer (n=117) (c), stage III pancreatic cancer (n=11) (d), and stage IV pancreas cancer (n=41) (e), compared to control (healthy donors (n=100) and patients with a benign pancreatic disease (n=26), total n=126). g, Table associated with ROC curve analysis depicted in Figure 1h. AUC: Area under the curve, CI: confidence interval.
Extended Data Figure 4. Longitudinal human study
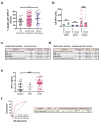
a, Scatter plots of percent beads with GPC1+ crExos by flow cytometry in patients with pancreas cancer. Patients are divided based on metastatic disease (non-metastatic lesions, lymph node metastases and distant metastases). ANOVA, post-hoc Tukey-Kramer test, * P<0.05; 3 technical replicates. b, Scatter plots depicting serum CA 19-9 levels (U/ml) in patients with benign pancreas disease (BPD) (n=4), cancer precursor lesion (PCPL) (n=4), and pancreatic ductal adenocarcinoma (PDAC) (n=29) on the preoperative day and postoperative day 7 in patients. Paired two-tailed Student’s _t_-test, ** P<0.01; 3 technical replicates.c–d, Multivariate analysis (Cox proportional hazards regression model) of prognostic parameters for overall (c) and disease-specific (d) survival of patients with pancreas cancer in the longitudinal cohort (n=29). e, Scatter plots depicting serum GPC1 (ng/ml) levels by ELISA in patients with benign pancreas disease (BPD, n=6), pancreatic ductal adenocarcinoma (PDAC, n=56) and healthy controls (n=20). ANOVA, post-hoc Tukey-Kramer test, **** P<0.0001; 3 technical replicates.f, ROC curve for circulating GPC1 protein (red line) in patients with pancreas cancer (n=56) vs. control (healthy donors (n=20) and patients with a benign pancreatic disease (n=26), total n=6). AUC: Area under the curve, CI: confidence interval.
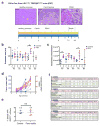
Extended Data Figure 5. PDAC GEMM longitudinal study
a, Schematic diagram depicting the spontaneous development and progression of pancreatic cancer in Ptf1acre/+;LSL-KrasG12D/+;Tgfbr2L/L(PKT) mice and H&E of the pancreas at the indicated time points showing healthy pancreas, PanIN lesions, and PDAC lesions. Scale bars: 100 μm. b–c, Exosomes size (b) and concentration (c) assayed by NanoSight® analysis from the serum of PKT mice (E: experimental, red) and control mice (C: control, blue) at 4, 5, 6,7 and 8 weeks of age. ANOVA, post-hoc Tukey-Kramer test, * P<0.05; 3 technical replicates. d, Graph depicting the time wise progression of tumor volume measured by MRI and the % beads with GPC1+ bound crExos in individual PKT mice (blue: tumor volume, red: % GPC1+ crExos).e, Percent beads with GPC1+ crExos on beads from control mice (n=3) and mice with cerulein-induced acute pancreatitis (n=4). Two-tailed Student’s_t_-test, ns: not significant; 3 technical replicates.f, Results from ROC curves for percent beads with GPC1+ bound crExos, exosomes concentration and exosomes size in 4, 5, 6 and 7 weeks old PKT mice (n=7) vs. control (including age-matched littermate healthy control (n=6) and mice with induced acute pancreatitis (n=4), n=10)). Data is presented as the mean ± standard deviation.
Extended Data Figure 6. PDAC GEMM cross sectional studies
a, Representative micrographs of H&E stained pancreas from 16 days old control mice (left panel) and PKT mice presenting with (right panel, encircled) and without (middle panel) PanIN lesions. Scale bars: 100 μm. b, Ct values following qPCR analyses for oncogenic KRASG12D, wild-type KRAS and 18S internal control RNA from exosomes of 44–48 days old PKT mice serum segregated using FACS for GPC1+ bead bound exos (red) and GPC1− bead bound exos (blue). Data is presented as the mean ± standard deviation.
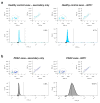
Extended Data Figure 7. Raw scatter dot plot depicting flow cytometry analyses of beads with GPC1+ bound exosomes
a, Scatter plots and histogram of flow cytometry analyses of serum exosomes on beads of a representative healthy control (left panels are secondary antibody only; right panels are GPC1 antibody and secondary antibody). b, Scatter plots and histogram of flow cytometry analysis of serum exosomes on beads of a representative pancreas cancer sample (left panels are secondary antibody only; right panels are with GPC1 antibody and secondary antibody).
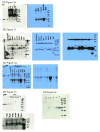
Extended Data Figure 8
Uncropped Western blots
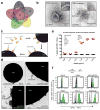
Figure 1. GPC1 is present specifically on cancer exosomes
a, Venn diagram of exosomal proteins from NIH/3T3 (blue), MCF 10A (red), HDF (green), E10 (yellow) and MDA-MB-231 (purple) cells. 48 proteins were exclusively detected in exosomes from MDA-MB-231 cells (n=3 protein samples, technical replicates). b, Transmission electron micrographs (TEM; left image) and immunogold TEM (right image) of GPC1. Upper right: digitally zoomed inset (n=2 experiments). c, Diagram of flow cytometry experiment to detect GPC1 on the surface of exosomes bound to beads. d, TEM of bead-bound exosomes and immunogold labeling of GPC1 (n=2 biological replicates). e, Percent beads with GPC1+ exosomes from cancer cells (red) and non-tumorigenic cells (black). f, Flow cytometry analyses of percent beads with GPC1+ exosomes from indicated cell lines (n=2 biological replicates). Negative control: secondary antibody only.
Figure 2. GPC1+ crExosomes are derived from cancer cells in tumor-bearing mice
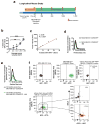
a, Longitudinal blood collection: nude mice with orthotopic MDA-MB-231 tumors (n=4 mice). b, Percentage of beads with GPC1+ exosomes harvested from systemic circulation (crExos) plotted against average tumor volume (n=4 mice, each sample analyzed in technical triplicates for GPC1). ANOVA, post-hoc Tamhane T2, ** P<0.01, *** P<0.001. Data is shown as mean ± standard deviation. c, Correlation between tumor volume and percent beads with GPC1+crExos (Pearson correlation test). d, NanoSight® analyses of exosomes from cultured MDA-MB-231 CD63-GFP cells. Black: all exosomes; green: CD63-GFP+ exosomes (n=3 technical replicates).e, NanoSight® analyses of crExos from mice with MDA-MB-231 CD63-GFP orthotopic tumor. Black: all exosomes; green: CD63-GFP+ exosomes (n=3 technical replicates).f, Flow cytometry analyses of beads with exosomes from cultured MDA-MB-231 (upper left) and MDA-MB-231 CD63-GFP (upper middle) cells, and from crExos of mice with MDA-MB-231 CD63-GFP orthotopic tumors (lower left). Staining of CD63-GFP+ (cancer cell derived) and CD63-GFP− (host derived) crExos for GPC1 (APC+, lower right; n=3 biological replicates and 3 technical replicates). Percent positive beads are listed. Negative control: secondary antibody alone (right upper panel).
Figure 3. GPC1+ crExos is a non-invasive biomarker for pancreas cancer
a, Percent beads with GPC1+ crExos in healthy donors (n=100), breast cancer patients (n=32) and patients with PDAC (n=190; ANOVA, post-hoc Tamhane T2, **** P<0.0001). b, Frequency of KRAS mutation in 47 tumor specimens and representative DNA sequencing chromatograms. c, TEM of GPC1 immunogold of crExos from three PDAC patients following flow cytometry isolation of GPC1+ (left column) and GPC1− (right column) crExos (n=3, 3 technical replicates). d, Ct value for KRAS G12D/G12V, KRAS WT mRNA and 18S rRNA expression in GPC1+ (red and blue) and GPC1− (black) crExos (after flow cytometry isolation; n=2, 2 biological replicates and 3 technical replicates each)e, Percent beads with GPC1+ crExos, discovery cohort (healthy donors, n=100; patients with a benign pancreatic disease (BPD), n=26; pancreatic cancer precursor lesion (PCPL), n=5; and PDAC patients, n=190; ANOVA, post-hoc Tamhane T2, ** P<0.01, **** P<0.0001; 3 technical replicates.f, ROC curve of discovery cohort. g, Percent beads with GPC1+ crExos, validation cohort (healthy donors, n=20; BPD, n=6; PDAC, n=56; ANOVA, post-hoc Tukey-Kramer test, **** P<0.0001; 3 technical replicates).h, ROC curve of validation cohort. Data is shown as mean ± standard deviation.
Figure 4. Levels of circulating GPC1+ exosomes inform pancreas cancer resection outcome
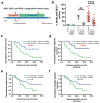
a, Longitudinal blood collection pre- (pre-op) and post-operatively (day 7). b, Percent beads with GPC1+ crExos from patients with BPD (n=4), PCPL (n=4) or PDAC (n=29) (paired two-tailed Student’s _t_-test, ** P<0.01, **** P<0.0001). Data is shown as mean ± standard deviation. c–d, Kaplan–Meier curves (log-rank test) displaying overall (c) and disease-specific survival (d) of patients with GPC1+ crExos drop ≥ median (blue) and GPC1+ crExos drop < median (green) drop after resection. e–f, Kaplan–Meier curves (log-rank test) displaying overall (e) and disease-specific survival (f) of patients with a CA 19-9 drop ≥ median (blue) and a CA 19-9 drop < median (green) drop after resection.
Figure 5. GPC1+ circulating exosomes predict pancreas cancer in GEMM
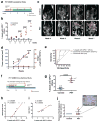
a, Longitudinal blood collection from control and PKT mice: 4 (n=6 and n=7, respectively), 5 (n=6 and n=7), 6 (n=6 and n=6), 7 (n=6 and n=6) and 8 (n=2 and n=3) weeks of age. b, Percent beads with GPC1+ crExos from PKT (red) and control (blue) mice; ANOVA, post-hoc Tukey-Kramer test, **** P<0.0001; 3 technical replicates. c, MRI with tumor encircled in red. d, Tumor volume and percent GPC1+ crExos in PKT mice at indicated age (ANOVA, post-hoc Tamhane T2), *P<0.05, ** P<0.01, *** P<0.001**** P<0.0001; 3 technical replicates) e, ROC curve analysis of 4 weeks-old control mice (n=6) and mice with acute pancreatitis (n=4) vs. 4 weeks-old PKT mice (n=7). f, Cross sectional study: blood collected from 16 or 20 days old control (n=6) and PKT (n=7) mice.g, Percent beads with GPC1+ crExos from control and PKT (16 – 20 days-old) mice (paired two-tailed Student’s _t_-test, P<0.0001; 3 technical replicates).h–i, Correlation between histological score (h) or age (i) and percent beads with GPC1+ crExos (Pearson correlation test). j, Relative percent PanIN lesions and representative staining for phosphorylated ERK. Data is shown as mean ± standard deviation.
Comment in
- Cancer: Diagnosis by extracellular vesicles.
Théry C. Théry C. Nature. 2015 Jul 9;523(7559):161-2. doi: 10.1038/nature14626. Epub 2015 Jun 24. Nature. 2015. PMID: 26106856 No abstract available. - Biomarkers: The challenge to find biomarkers for the early detection of pancreatic cancer.
Weber C. Weber C. Nat Rev Gastroenterol Hepatol. 2015 Aug;12(8):427. doi: 10.1038/nrgastro.2015.118. Epub 2015 Jul 14. Nat Rev Gastroenterol Hepatol. 2015. PMID: 26170217 No abstract available. - Diagnosis: Fishing for exosomes.
Alderton GK. Alderton GK. Nat Rev Cancer. 2015 Aug;15(8):453. doi: 10.1038/nrc3990. Nat Rev Cancer. 2015. PMID: 26205334 No abstract available. - Glypican-1 as a highly sensitive and specific pancreatic cancer biomarker.
Diamandis EP, Plebani M. Diamandis EP, et al. Clin Chem Lab Med. 2016 Jan;54(1):e1-2. doi: 10.1515/cclm-2015-0773. Clin Chem Lab Med. 2016. PMID: 26389634 No abstract available. - Glypican-1 exosomes: do they initiate a new era for early pancreatic cancer diagnosis?
Lorenzon L, Blandino G. Lorenzon L, et al. Transl Gastroenterol Hepatol. 2016 Mar 16;1:8. doi: 10.21037/tgh.2016.01.07. eCollection 2016. Transl Gastroenterol Hepatol. 2016. PMID: 28164166 Free PMC article. No abstract available.
Similar articles
- Exosomal glypican-1 is elevated in pancreatic cancer precursors and can signal genetic predisposition in the absence of endoscopic ultrasound abnormalities.
Moutinho-Ribeiro P, Batista IA, Quintas ST, Adem B, Silva M, Morais R, Peixoto A, Coelho R, Costa-Moreira P, Medas R, Lopes S, Vilas-Boas F, Baptista M, Dias-Silva D, Esteves AL, Martins F, Lopes J, Barroca H, Carneiro F, Macedo G, Melo SA. Moutinho-Ribeiro P, et al. World J Gastroenterol. 2022 Aug 21;28(31):4310-4327. doi: 10.3748/wjg.v28.i31.4310. World J Gastroenterol. 2022. PMID: 36159010 Free PMC article. - Glypican-1 is enriched in circulating-exosomes in pancreatic cancer and correlates with tumor burden.
Frampton AE, Prado MM, López-Jiménez E, Fajardo-Puerta AB, Jawad ZAR, Lawton P, Giovannetti E, Habib NA, Castellano L, Stebbing J, Krell J, Jiao LR. Frampton AE, et al. Oncotarget. 2018 Apr 10;9(27):19006-19013. doi: 10.18632/oncotarget.24873. eCollection 2018 Apr 10. Oncotarget. 2018. PMID: 29721179 Free PMC article. - Exosomal glypican-1 discriminates pancreatic ductal adenocarcinoma from chronic pancreatitis.
Moutinho-Ribeiro P, Adem B, Batista I, Silva M, Silva S, Ruivo CF, Morais R, Peixoto A, Coelho R, Costa-Moreira P, Lopes S, Vilas-Boas F, Durães C, Lopes J, Barroca H, Carneiro F, Melo SA, Macedo G. Moutinho-Ribeiro P, et al. Dig Liver Dis. 2022 Jul;54(7):871-877. doi: 10.1016/j.dld.2021.10.012. Epub 2021 Nov 25. Dig Liver Dis. 2022. PMID: 34840127 - Tumour-derived exosomes as a signature of pancreatic cancer - liquid biopsies as indicators of tumour progression.
Nuzhat Z, Kinhal V, Sharma S, Rice GE, Joshi V, Salomon C. Nuzhat Z, et al. Oncotarget. 2017 Mar 7;8(10):17279-17291. doi: 10.18632/oncotarget.13973. Oncotarget. 2017. PMID: 27999198 Free PMC article. Review. - Exosomes: potential for early detection in pancreatic cancer.
Lu L, Risch HA. Lu L, et al. Future Oncol. 2016;12(8):1081-90. doi: 10.2217/fon-2015-0005. Epub 2016 Feb 10. Future Oncol. 2016. PMID: 26860951 Review.
Cited by
- Clinical functional proteomics of intercellular signalling in pancreatic cancer.
Huang P, Gao W, Fu C, Wang M, Li Y, Chu B, He A, Li Y, Deng X, Zhang Y, Kong Q, Yuan J, Wang H, Shi Y, Gao D, Qin R, Hunter T, Tian R. Huang P, et al. Nature. 2024 Nov 13. doi: 10.1038/s41586-024-08225-y. Online ahead of print. Nature. 2024. PMID: 39537929 - Nucleic Acid Probes for Single-Molecule Localization Imaging of Cellular Biomolecules.
Wei J, Ji C, Wang Y, Tan J, Yuan Q, Tan W. Wei J, et al. Chem Biomed Imaging. 2023 Apr 14;1(1):18-29. doi: 10.1021/cbmi.3c00012. eCollection 2023 Apr 24. Chem Biomed Imaging. 2023. PMID: 39474303 Free PMC article. Review. - Modeling a biofluid-derived extracellular vesicle surface signature to differentiate pediatric idiopathic nephrotic syndrome clinical subgroups.
Cricri G, Gobbini A, Bruno S, Bellucci L, Tassinari S, Caicci F, Tamburello C, Nittoli T, Paraboschi I, Berrettini A, Grifantini R, Bussolati B, Morello W, Montini G, Collino F. Cricri G, et al. Sci Rep. 2024 Oct 28;14(1):25765. doi: 10.1038/s41598-024-76727-w. Sci Rep. 2024. PMID: 39468184 Free PMC article. - Liquid Biopsy in Pancreatic Ductal Adenocarcinoma: A Review of Methods and Applications.
Dubrovsky G, Ross A, Jalali P, Lotze M. Dubrovsky G, et al. Int J Mol Sci. 2024 Oct 13;25(20):11013. doi: 10.3390/ijms252011013. Int J Mol Sci. 2024. PMID: 39456796 Free PMC article. Review. - High-throughput capture and in situ protein analysis of extracellular vesicles by chemical probe-based array.
Feng X, Shen A, Zhang W, Jia S, Iliuk A, Wang Y, Zhang W, Zhang Y, Tao WA, Hu L. Feng X, et al. Nat Protoc. 2024 Oct 22. doi: 10.1038/s41596-024-01082-z. Online ahead of print. Nat Protoc. 2024. PMID: 39438698 Review.
References
Publication types
MeSH terms
Substances
Grants and funding
- P30 CA016672/CA/NCI NIH HHS/United States
- U01 CA151925/CA/NCI NIH HHS/United States
- P30-CA016672/CA/NCI NIH HHS/United States
- CA16672/CA/NCI NIH HHS/United States
- P30CA016672/CA/NCI NIH HHS/United States
- P50-CA094056/CA/NCI NIH HHS/United States
- DK 081576/DK/NIDDK NIH HHS/United States
- R01 CA155370/CA/NCI NIH HHS/United States
- 5U24-CA126577/CA/NCI NIH HHS/United States
- CA-151925/CA/NCI NIH HHS/United States
- CA-155370/CA/NCI NIH HHS/United States
- P30CA16672/CA/NCI NIH HHS/United States
- P50 CA094056/CA/NCI NIH HHS/United States
- U24 CA126577/CA/NCI NIH HHS/United States
- R01 DK081576/DK/NIDDK NIH HHS/United States
LinkOut - more resources
Full Text Sources
Other Literature Sources
Medical
Molecular Biology Databases
Research Materials
Miscellaneous
