Histone H3.3 maintains genome integrity during mammalian development - PubMed (original) (raw)
Histone H3.3 maintains genome integrity during mammalian development
Chuan-Wei Jang et al. Genes Dev. 2015.
Abstract
Histone H3.3 is a highly conserved histone H3 replacement variant in metazoans and has been implicated in many important biological processes, including cell differentiation and reprogramming. Germline and somatic mutations in H3.3 genomic incorporation pathway components or in H3.3 encoding genes have been associated with human congenital diseases and cancers, respectively. However, the role of H3.3 in mammalian development remains unclear. To address this question, we generated H3.3-null mouse models through classical genetic approaches. We found that H3.3 plays an essential role in mouse development. Complete depletion of H3.3 leads to developmental retardation and early embryonic lethality. At the cellular level, H3.3 loss triggers cell cycle suppression and cell death. Surprisingly, H3.3 depletion does not dramatically disrupt gene regulation in the developing embryo. Instead, H3.3 depletion causes dysfunction of heterochromatin structures at telomeres, centromeres, and pericentromeric regions of chromosomes, leading to mitotic defects. The resulting karyotypical abnormalities and DNA damage lead to p53 pathway activation. In summary, our results reveal that an important function of H3.3 is to support chromosomal heterochromatic structures, thus maintaining genome integrity during mammalian development.
Keywords: apoptosis; cell proliferation; genome integrity; histone H3.3; mouse embryonic development; transcriptional regulation.
© 2015 Jang et al.; Published by Cold Spring Harbor Laboratory Press.
Figures
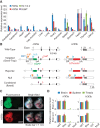
Figure 1.
H3.3 gene expression and generation of H3.3 alleles. (A) Expression of H3f3a, H3f3b, H3.1/3.2, and SLBP in wild-type C57BL/6 adult mouse organs by quantitative PCR (qPCR). H3.1/H3.2 level was detected by using primers amplifying the consensus region of all of the annotated H3.1/H3.1-encoding gene copies in the mouse genome. Levels of individual genes across tissues were normalized to 18S rRNA, with the highest level set to 100. (B) Diagram of mutant H3f3a and H3f3b alleles created in this study. The initial targeted alleles were gene trap alleles with a splice acceptor and a polyA signal in intron 1. Fluorescent reporter alleles (EGFP for H3f3a, and tdTomato for H3f3b) were generated by φC31 integrase-mediated recombination between AttP and AttB sites. Null alleles were created by Cre-mediated deletion of the critical first coding exon (exon 2). Conditional (flox) alleles were created by deleting the gene trap cassette with FLP-mediated recombination between FRT sites. (NEO) Neomycin/G418 resistance gene. (C) Expression of fluorescent reporter alleles. A reporter allele carrier embryonic day 10.5 (E10.5) embryo is shown with a wild-type littermate for either gene. (D) Expression of H3f3a and _H3f3_b alleles in brain (cerebellum), spleen, and testis tissue from wild-type (WT; C57BL/6) and mutant animals homozygous with the indicated alleles by qPCR. Primer sets spanning intron 1 (exons 1 and 2) and intron 2 (exons 2 and 3) of each gene were used to access the transcription and splicing efficiency through introns 1 and 2, respectively. The standard error of the mean (SEM) is from two biological replicates (n = 2) for both A and D.
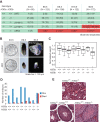
Figure 2.
Lethality and fertility phenotypes of H3.3 gene knockout mutants. (A) The number of embryos/pups of specific genotypes observed at different stages from H3f3a_−/+; H3f3b_−/+ mouse intercrosses. Numbers in parenthesis are expected numbers at the Mendelian ratio. The red background indicates that the observed numbers were significantly lower than expected. All of the A null B het pups died after birth. Significant differences from the expected numbers are indicated by (*) P < 0.05 and (**) P < 0.01 in χ2 test. (B) Double-knockout embryos (H3f3a_−/−; H3f3b_−/−) and their littermate control (H3f3a_−/+; H3f3b_−/+) at different stages. E8.5 embryos were hybridized with Brachyury probe, showing expression at the tail (arrow) and notochord (arrowhead) in the control and presumably the primitive streak in the double-knockout mutant (arrow). (C) Box plot of body weight distribution of E18.5 C-sectioned embryos. Raw values were first normalized to the average weight in the litter. Significant difference from wild type (WT) is indicated. (***) P < 0.001 in ANOVA test. (D) Survival of C-sectioned E18.5 embryos. Shown are total numbers of observed embryos (blue bars) and those that did not survive after C-section (red bars) in each genotype group. (E) Hematoxylin and eosin (H&E) sections of testes from 6- to 8-mo-old adult males of the indicated genotypes.
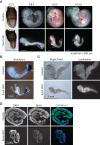
Figure 3.
_Sox2_-cKO embryos died due to increased cell death and decreased cell proliferation. (A) Embryos at different stages from crosses between H3f3a fl/fl; H3f3b fl/fl females and H3f3a fl/+; H3f3b fl/+; Sox2-Cre Tg/0 males. For each stage, a control littermate (H3f3a fl/+; H3f3b fl/+; Sox2-Cre Tg/0) is shown with a _Sox2_-cKO mutant. (B) Brachyury expression detected by whole -mount in situ hybridization. Both the control and the _Sox2_-cKO mutant showed expression at the tail (arrow) and notochord (arrowhead). (C) E8.5 embryos stained with Lysotracker. Scattered positive spots in the control are indicated (arrowheads). (D) BrdU staining of sagittal sections of control and _Sox2_-cKO E9.5 embryos. The faint cytoplasmic signal in the _Sox2-_cKO/BrdU embryo section comes from nonspecific background staining.
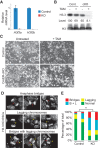
Figure 4.
Cell death and mitotic defects in H3.3 knockout (KO) ES cells. (A) H3f3a and H3f3b expression in TAM-treated control (H3f3a fl/+; H3f3b fl/+; CAG-CreER Tg/0) and CreER-cKO ES cells detected by RT-qPCR. SEM is from two biological replicates. (B) H3.3 protein levels in control and CreER-cKO ES cells with or without TAM detected by Western blot. The numbers below are calculated relative protein levels normalized to total H3. (C) Representative images of control and CreER-cKO ES cells with or without TAM treatment. Equal numbers of cells were seeded for each group at the beginning. (D) Mitotic abnormalities with anaphase bridges (red arrow), lagging chromosomes (yellow arrowhead), or both were observed in H3.3 knockout ES cells. Cells were fixed and stained with DAPI. (E) Percentages of mitotic cells with abnormalities in control and H3.3 knockout ES cells; two lines of each were analyzed. Control is TAM-treated control cells. Twenty-five mitotic events were scored for each line. (**) P < 0.01 in χ2 test.
Figure 5.
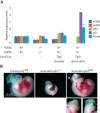
p53 involvement in mediating the H3.3 knockout phenotype. (A) Expression of H3f3a, H3f3b, p53, and two p53 target genes (p21 and Puma) in E8.5 embryos with the indicated genotypes. SEM is from two biological replicates. Significant difference from control in the _Sox2_-cKO is indicated. (*) P < 0.05; (**) P < 0.01 in one-tailed t_-test. (B) E10.5 littermates with control–_p53 null (_H3f3afl/+; H3f3bfl/+; Sox2-CreTg/0; p53_−/−), _Sox2_-cKO–_p53_−/+ (_H3f3afl/−; H3f3bfl/−; Sox2-CreTg/0; p53_−/+), or Sox2_-cKO–_p53 null (_H3f3afl/−; H3f3bfl/−; Sox2-CreTg/0; p53_−/−) genotypes from a cross between a H3f3afl/fl; H3f3bfl/fl; p53_−/+ female and a H3f3a_−/+; H3f3b_−/+; Sox2-CreTg/0; p53_−/− male. Neural tube disclosure in Sox2_-cKO–_p53 null is indicated (arrowhead); the two images below show the arrowhead-indicated region (yellow asterisk) from different angles.
Figure 6.
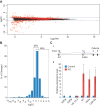
Differential expression analyses of H3.3-null embryos in a _p53_-null background. (A) The edgeR smear plot visualization of RNA-seq results. Each dot represents a gene; the _X_-axis is mean log2 CPM, indicating expression level of the genes, and the _Y_-axis is log2 fold change (log2FC), indicating gene expression change upon H3.3 deletion. Genes with a significant change (FDR < 0.05) are plotted in red. The horizontal dashed blue lines mark the plus or minus twofold change range. (B) Effect size distribution of significantly changed genes. Sixty-five percent of genes have changes between plus and minus twofold, and 66% of genes have positive changes. (C, panel i) Gene structure of Cdkn2a (cyclin-dependent kinase inhibitor 2A); two splice isoforms, Ink4a and Arf, are driven by different promoters and have different first exons (1α and 1β, respectively). (Panel ii) Relative expression levels of H3f3a, H3f3b, H3.1/3.2, Arf (detected by primers spanning exons 1β/2), Ink4a (detected by primers spanning exons 1α/2), and Cdkn2a total output (detected by primers spanning exons 2/3) in H3.3 knockout (KO) versus control embryos. n = 3. (*) P < 0.05 in one-tailed _t_-test.
Figure 7.
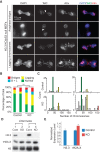
Mitotic defects, karyotypic abnormality, and DNA damage in H3.3 knockout (KO)/p53 null MEFs. (A) Mitotic abnormalities of H3.3 knockout/p53 null MEFs. ATRX immunofluorescence signal on lagging chromosomes (arrows) and telomere FISH signal (TelC) in the middle of bridging chromosomes (arrowheads) are indicated. (B) Percentages of mitotic cells with abnormalities in control and H3.3 knockout/p53 null MEFs. Twenty-five mitotic events were scored in each line. (**) P < 0.01 in χ2 test. (C) Distribution of chromosome numbers counted in metaphase spreads made from H3.3 knockout/p53 null MEF lines (bottom) and their littermate control lines (top). Colors denote close to normal 2N (40) counts (green), 4N (80) counts (yellow), and 8N (160) counts (red). (D) rH2A.X levels in H3.3 knockout/p53 null and control MEFs by Western blot. Lanes 2 and 4 are mutant cell lines, and lanes 1 and 3 are their littermate control lines, respectively. (E) Relative expression levels of H3.3 and rH2A.X calculated from D, normalized to total H3 level. (*) P < 0.05 in one-tailed _t_-test.
Figure 8.
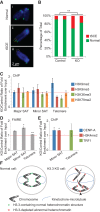
Telomere dysfunction and heterochromatin defects in H3.3 knockout (KO)/p53 null MEFs. (A) CO-FISH results showing normal chromosomes (panel i) and chromosomes with tSCEs, which have either gained additional (yellow dashed circle) (panel ii) or lost (pink dashed circle) (panel iii) FISH signals. (B) Percentages of chromosomes with tSCEs in control and H3.3 knockout/p53 null MEF lines. (**) P < 0.01 in χ2 test. (C,E) ChIP-qPCR results with different antibodies and primers amplifying different repeat sequences. (D) FAIRE (formaldehyde-assisted isolation of regulatory elements)-qPCR results showing increased enrichment of repeat sequences in H3.3 knockout MEFs normalized to littermate control cell lines. In C_–_E, (*) P < 0.05 and (**) P < 0.01 in one-tailed _t_-test. (F) Model showing how loss of H3.3 affects chromosome segregation and genome integrity. Arrows point to aberrant organized kinetochores that lead to chromosome lagging. The arrowhead points to telomere fusion leading to the anaphase bridge.
Similar articles
- SUMOylated PRC1 controls histone H3.3 deposition and genome integrity of embryonic heterochromatin.
Liu Z, Tardat M, Gill ME, Royo H, Thierry R, Ozonov EA, Peters AH. Liu Z, et al. EMBO J. 2020 Jul 1;39(13):e103697. doi: 10.15252/embj.2019103697. Epub 2020 May 12. EMBO J. 2020. PMID: 32395866 Free PMC article. - Histone variant H3.3 provides the heterochromatic H3 lysine 9 tri-methylation mark at telomeres.
Udugama M, M Chang FT, Chan FL, Tang MC, Pickett HA, R McGhie JD, Mayne L, Collas P, Mann JR, Wong LH. Udugama M, et al. Nucleic Acids Res. 2015 Dec 2;43(21):10227-37. doi: 10.1093/nar/gkv847. Epub 2015 Aug 24. Nucleic Acids Res. 2015. PMID: 26304540 Free PMC article. - H3.1K27me1 maintains transcriptional silencing and genome stability by preventing GCN5-mediated histone acetylation.
Dong J, LeBlanc C, Poulet A, Mermaz B, Villarino G, Webb KM, Joly V, Mendez J, Voigt P, Jacob Y. Dong J, et al. Plant Cell. 2021 May 31;33(4):961-979. doi: 10.1093/plcell/koaa027. Plant Cell. 2021. PMID: 33793815 Free PMC article. - Histone Variant H3.3: A versatile H3 variant in health and in disease.
Xiong C, Wen Z, Li G. Xiong C, et al. Sci China Life Sci. 2016 Mar;59(3):245-56. doi: 10.1007/s11427-016-5006-9. Epub 2016 Jan 29. Sci China Life Sci. 2016. PMID: 26825948 Review. - The double face of the histone variant H3.3.
Szenker E, Ray-Gallet D, Almouzni G. Szenker E, et al. Cell Res. 2011 Mar;21(3):421-34. doi: 10.1038/cr.2011.14. Epub 2011 Jan 25. Cell Res. 2011. PMID: 21263457 Free PMC article. Review.
Cited by
- Cell Fate Decisions in the Wake of Histone H3 Deposition.
Franklin R, Murn J, Cheloufi S. Franklin R, et al. Front Cell Dev Biol. 2021 Apr 20;9:654915. doi: 10.3389/fcell.2021.654915. eCollection 2021. Front Cell Dev Biol. 2021. PMID: 33959610 Free PMC article. Review. - Multi-omic profiling of histone variant H3.3 lysine 27 methylation reveals a distinct role from canonical H3 in stem cell differentiation.
Kori Y, Lund PJ, Trovato M, Sidoli S, Yuan ZF, Noh KM, Garcia BA. Kori Y, et al. Mol Omics. 2022 May 11;18(4):296-314. doi: 10.1039/d1mo00352f. Mol Omics. 2022. PMID: 35044400 Free PMC article. - Chromatin regulation and dynamics in stem cells.
Klein DC, Hainer SJ. Klein DC, et al. Curr Top Dev Biol. 2020;138:1-71. doi: 10.1016/bs.ctdb.2019.11.002. Epub 2019 Dec 30. Curr Top Dev Biol. 2020. PMID: 32220294 Free PMC article. Review. - The Histone Variant H3.3 Is Required for Plant Growth and Fertility in Arabidopsis.
Long X, Yang W, Lv Y, Zhong X, Chen L, Li Q, Lv Z, Li Y, Cai Y, Yang H. Long X, et al. Int J Mol Sci. 2024 Feb 22;25(5):2549. doi: 10.3390/ijms25052549. Int J Mol Sci. 2024. PMID: 38473796 Free PMC article. - Plasma cell differentiation is regulated by the expression of histone variant H3.3.
Saito Y, Harada A, Ushijima M, Tanaka K, Higuchi R, Baba A, Murakami D, Nutt SL, Nakagawa T, Ohkawa Y, Baba Y. Saito Y, et al. Nat Commun. 2024 Jun 20;15(1):5004. doi: 10.1038/s41467-024-49375-x. Nat Commun. 2024. PMID: 38902223 Free PMC article.
References
- Adam S, Polo SE, Almouzni G. 2013. Transcription recovery after DNA damage requires chromatin priming by the H3.3 histone chaperone HIRA. Cell 155: 94–106. - PubMed
Publication types
MeSH terms
Substances
LinkOut - more resources
Full Text Sources
Other Literature Sources
Molecular Biology Databases
Research Materials
Miscellaneous
