RNA-Seq of single prostate CTCs implicates noncanonical Wnt signaling in antiandrogen resistance - PubMed (original) (raw)
. 2015 Sep 18;349(6254):1351-6.
doi: 10.1126/science.aab0917.
Yu Zheng 2, Ben S Wittner 3, Richard J Lee 3, Huili Zhu 4, Katherine T Broderick 4, Rushil Desai 4, Douglas B Fox 4, Brian W Brannigan 4, Julie Trautwein 4, Kshitij S Arora 5, Niyati Desai 5, Douglas M Dahl 6, Lecia V Sequist 3, Matthew R Smith 3, Ravi Kapur 7, Chin-Lee Wu 5, Toshi Shioda 4, Sridhar Ramaswamy 3, David T Ting 3, Mehmet Toner 7, Shyamala Maheswaran 8, Daniel A Haber 9
Affiliations
- PMID: 26383955
- PMCID: PMC4872391
- DOI: 10.1126/science.aab0917
RNA-Seq of single prostate CTCs implicates noncanonical Wnt signaling in antiandrogen resistance
David T Miyamoto et al. Science. 2015.
Abstract
Prostate cancer is initially responsive to androgen deprivation, but the effectiveness of androgen receptor (AR) inhibitors in recurrent disease is variable. Biopsy of bone metastases is challenging; hence, sampling circulating tumor cells (CTCs) may reveal drug-resistance mechanisms. We established single-cell RNA-sequencing (RNA-Seq) profiles of 77 intact CTCs isolated from 13 patients (mean six CTCs per patient), by using microfluidic enrichment. Single CTCs from each individual display considerable heterogeneity, including expression of AR gene mutations and splicing variants. Retrospective analysis of CTCs from patients progressing under treatment with an AR inhibitor, compared with untreated cases, indicates activation of noncanonical Wnt signaling (P = 0.0064). Ectopic expression of Wnt5a in prostate cancer cells attenuates the antiproliferative effect of AR inhibition, whereas its suppression in drug-resistant cells restores partial sensitivity, a correlation also evident in an established mouse model. Thus, single-cell analysis of prostate CTCs reveals heterogeneity in signaling pathways that could contribute to treatment failure.
Copyright © 2015, American Association for the Advancement of Science.
Figures
Fig. 1
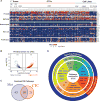
Single cell RNA-sequencing of prostate CTCs. (A) Heat map of unsupervised hierarchical clustering analysis of RNA-seq data from 77 single lineage-confirmed prostate CTCs, 12 primary tumor samples, and 30 single cells from four prostate cancer cell lines. (B) Heterogeneity, measured by mean correlation coefficient within individual samples with 3 or more cells available for analysis. (C) Heterogeneity analysis showing mean correlation coefficients from expression data for CTCs between and within patients (0.0013838 vs. 0.10055, Holm corrected P=2.0×10⁻¹¹), and for prostate cancer cell lines between and within lines (0.11568 vs. 0.43534, Holm corrected P=5.42×10⁻¹⁴).
Fig. 2
Gene signatures and signaling pathways in prostate CTCs. (A) High resolution heat map showing expression of selected gene panels in single prostate CTCs, primary tumor samples, and prostate cancer cell lines. GS, Gleason score; CSPC, castration-sensitive prostate cancer; CRPC, castration-resistant prostate cancer; LNCaP.R, LNCaP cells treated with R1881; LNCaP.D, LNCaP cells treated with dimethyl sulfoxide (DMSO) as a vehicle control. (B) Volcano plot showing genes differentially expressed between prostate CTCs and primary prostate tumors (FDR<0.1 and fold-change >2). (C) Venn diagram showing Pathway Interaction Database (PID) molecular pathways (14) enriched in CTCs compared to primary tumors and in metastases compared to primary tumors (based on analysis of multiple data sets; see Fig. S5 and Table S4). (D) Signaling pathways enriched in prostate CTCs. Molecular pathways from the Pathway Interaction Database (PID) upregulated in CTCs versus primary tumors (excluding those enriched in metastases compared to primary tumors), organized by PID categorization (14) (Fig. S5).
Fig. 3
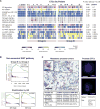
Heterogeneity of treatment resistance mechanisms in prostate CTCs. (A) Heat map depicting androgen receptor (AR) abnormalities, selected signaling pathway signatures, and genes in radical prostatectomy specimens, prostate CTCs from enzalutamide-naïve patients (Group A), and prostate CTCs from patients who had radiographic or biochemical progression of disease while receiving treatment with enzalutamide (Group B). Non-canonical Wnt signature is from reference (14), glucocorticoid receptor (GR) signature is from reference (28), and AR signature is from reference (30) (Table S7). Numbers at top of heatmap represent ID numbers (Pr numbers) for patients from which each CTC is derived. (B) Top, Gene Set Enrichment Analysis (GSEA) plots showing enrichment of non-canonical (nc) Wnt pathway in CTCs from Group B (patients with cancer progression on enzalutamide) compared to Group A (enzalutamide-naïve patients). Bottom, GSEA plots showing enrichment of ncWnt pathway in CTCs from Group B compared to Group A, stratified by GR gene expression. (C) Left: Representative micrograph (40X) of RNA-in situ hybridization assay in metastatic prostate tumors, probing for WNT5A and KRT8/18, scale bar = 50 μm. Inset, high magnification, arrow points to WNT5A signal (red dot), arrowhead points to KRT8/18 signal (blue dot), scale bar = 10 μm. Adjacent tissue sections were probed for WNT7B, and quantification of RNA-ISH data are displayed in the table. Of 9 primary tumors examined, 5 had >1% WNT5A expression in KRT+ cells (range 0.3%–42%) and 7 had >1% WNT7B expression (range 0.5%–33.6%). Of 24 metastatic tumors examined, 16 had >1% WNT5A expression (range 0%–50.5%) and 15 had >1% WNT7B expression (range 0%–26%). Right: Representative fluorescence micrographs of RNA-in situ hybridization in prostate CTCs, probing for WNT5A/7B (yellow dots), and prostate CTC-specific markers (EPCAM, KLK3, FOLH1, KRT8/18/19) (red dots). DNA is stained with DAPI (blue). Scale bar = 10 μm.
Fig. 4
ncWnt signaling and enzalutamide resistance. (A) Ectopic expression of ncWnt in LNCaP cells increases cell survival in the presence of enzalutamide (3 μM). (B) Enzalutamide treatment induces WNT5A mRNA expression in LNCaP cells, and WNT5A suppression in enzalutamide-treated LNCaP cells results in decreased proliferation. (C) Stable enzalutamide-resistant cells (LN_EnzR) derived from LNCaP cells express increased levels of WNT5A, and WNT5A siRNA results in reduced proliferation in the presence of enzalutamide. Each experiment (A–C) was performed ≥3 times. Data are presented as mean +/− SD. (D) GSEA plot showing enrichment of ncWnt pathway in mouse xenografts derived from enzalutamide-resistant LREX cells (28) compared to control LNCaP cells (data from GEO GSE52169). Lower GSEA plots show ncWnt pathway enrichment in enzalutamide-resistant xenografts, when stratified by GR gene expression.
Comment in
- CANCER. Cancer therapies that are gone with the Wnt.
Nanus DM, Giannakakou P. Nanus DM, et al. Science. 2015 Sep 18;349(6254):1283-4. doi: 10.1126/science.aad2448. Science. 2015. PMID: 26383936 No abstract available. - Prostate cancer: Wnt signalling induces resistance.
Sidaway P. Sidaway P. Nat Rev Urol. 2015 Nov;12(11):597. doi: 10.1038/nrurol.2015.244. Epub 2015 Oct 6. Nat Rev Urol. 2015. PMID: 26439505 No abstract available. - Re: RNA-Seq of Single Prostate CTCs Implicates Noncanonical Wnt Signaling in Antiandrogen Resistance.
Atala A. Atala A. J Urol. 2016 May;195(5):1621-1622. doi: 10.1016/j.juro.2016.02.001. Epub 2016 Feb 10. J Urol. 2016. PMID: 27186782 No abstract available.
Similar articles
- Prostate cancer: Wnt signalling induces resistance.
Sidaway P. Sidaway P. Nat Rev Urol. 2015 Nov;12(11):597. doi: 10.1038/nrurol.2015.244. Epub 2015 Oct 6. Nat Rev Urol. 2015. PMID: 26439505 No abstract available. - Prospective Evaluation of Clinical Outcomes Using a Multiplex Liquid Biopsy Targeting Diverse Resistance Mechanisms in Metastatic Prostate Cancer.
Sperger JM, Emamekhoo H, McKay RR, Stahlfeld CN, Singh A, Chen XE, Kwak L, Gilsdorf CS, Wolfe SK, Wei XX, Silver R, Zhang Z, Morris MJ, Bubley G, Feng FY, Scher HI, Rathkopf D, Dehm SM, Choueiri TK, Halabi S, Armstrong AJ, Wyatt AW, Taplin ME, Zhao SG, Lang JM. Sperger JM, et al. J Clin Oncol. 2021 Sep 10;39(26):2926-2937. doi: 10.1200/JCO.21.00169. Epub 2021 Jul 1. J Clin Oncol. 2021. PMID: 34197212 Free PMC article. - CANCER. Cancer therapies that are gone with the Wnt.
Nanus DM, Giannakakou P. Nanus DM, et al. Science. 2015 Sep 18;349(6254):1283-4. doi: 10.1126/science.aad2448. Science. 2015. PMID: 26383936 No abstract available. - Androgen receptor-related micro RNAs in prostate cancer and their role in antiandrogen drug resistance.
Rezaei S, Mahjoubin Tehran M, Sahebkar A, Jalili A, Aghaee-Bakhtiari SH. Rezaei S, et al. J Cell Physiol. 2020 Apr;235(4):3222-3234. doi: 10.1002/jcp.29275. Epub 2019 Oct 10. J Cell Physiol. 2020. PMID: 31599460 Review. - Understanding the mechanisms of androgen deprivation resistance in prostate cancer at the molecular level.
Karantanos T, Evans CP, Tombal B, Thompson TC, Montironi R, Isaacs WB. Karantanos T, et al. Eur Urol. 2015 Mar;67(3):470-9. doi: 10.1016/j.eururo.2014.09.049. Epub 2014 Oct 8. Eur Urol. 2015. PMID: 25306226 Free PMC article. Review.
Cited by
- Liquid biopsies based on DNA methylation as biomarkers for the detection and prognosis of lung cancer.
Li P, Liu S, Du L, Mohseni G, Zhang Y, Wang C. Li P, et al. Clin Epigenetics. 2022 Sep 24;14(1):118. doi: 10.1186/s13148-022-01337-0. Clin Epigenetics. 2022. PMID: 36153611 Free PMC article. Review. - The Role of Next-Generation Sequencing in Castration-Resistant Prostate Cancer Treatment.
Hovelson DH, Tomlins SA. Hovelson DH, et al. Cancer J. 2016 Sep/Oct;22(5):357-361. doi: 10.1097/PPO.0000000000000217. Cancer J. 2016. PMID: 27749331 Free PMC article. Review. - Clinical Application of Circulating Tumour Cells in Prostate Cancer: From Bench to Bedside and Back.
León-Mateos L, Vieito M, Anido U, López López R, Muinelo Romay L. León-Mateos L, et al. Int J Mol Sci. 2016 Sep 20;17(9):1580. doi: 10.3390/ijms17091580. Int J Mol Sci. 2016. PMID: 27657044 Free PMC article. Review. - Clinical Applications of NanoVelcro Rare-Cell Assays for Detection and Characterization of Circulating Tumor Cells.
Chen JF, Zhu Y, Lu YT, Hodara E, Hou S, Agopian VG, Tomlinson JS, Posadas EM, Tseng HR. Chen JF, et al. Theranostics. 2016 Jun 15;6(9):1425-39. doi: 10.7150/thno.15359. eCollection 2016. Theranostics. 2016. PMID: 27375790 Free PMC article. Review. - Applications of single-cell sequencing for the field of otolaryngology: A contemporary review.
Pyle MP, Hoa M. Pyle MP, et al. Laryngoscope Investig Otolaryngol. 2020 Apr 27;5(3):404-431. doi: 10.1002/lio2.388. eCollection 2020 Jun. Laryngoscope Investig Otolaryngol. 2020. PMID: 32596483 Free PMC article. Review.
References
- Egan A, et al. Castration-resistant prostate cancer: adaptive responses in the androgen axis. Cancer Treat Rev. 2014;40:426–433. - PubMed
Publication types
MeSH terms
Substances
Grants and funding
- R01 CA129933/CA/NCI NIH HHS/United States
- EB008047/EB/NIBIB NIH HHS/United States
- HHMI/Howard Hughes Medical Institute/United States
- 2R01CA129933/CA/NCI NIH HHS/United States
- U01 EB012493/EB/NIBIB NIH HHS/United States
- R01 EB008047/EB/NIBIB NIH HHS/United States
LinkOut - more resources
Full Text Sources
Other Literature Sources
Medical
Molecular Biology Databases
Research Materials


