Tumour exosome integrins determine organotropic metastasis - PubMed (original) (raw)
. 2015 Nov 19;527(7578):329-35.
doi: 10.1038/nature15756. Epub 2015 Oct 28.
Bruno Costa-Silva 1, Tang-Long Shen 1 2, Goncalo Rodrigues 1 3, Ayako Hashimoto 1 4, Milica Tesic Mark 5, Henrik Molina 5, Shinji Kohsaka 6, Angela Di Giannatale 1, Sophia Ceder 7, Swarnima Singh 1, Caitlin Williams 1, Nadine Soplop 8, Kunihiro Uryu 8, Lindsay Pharmer 9, Tari King 9, Linda Bojmar 1 10, Alexander E Davies 11, Yonathan Ararso 1, Tuo Zhang 12, Haiying Zhang 1, Jonathan Hernandez 1 13, Joshua M Weiss 1, Vanessa D Dumont-Cole 14, Kimberly Kramer 14, Leonard H Wexler 14, Aru Narendran 15, Gary K Schwartz 16, John H Healey 17, Per Sandstrom 10, Knut Jørgen Labori 18, Elin H Kure 19, Paul M Grandgenett 20, Michael A Hollingsworth 20, Maria de Sousa 1 3, Sukhwinder Kaur 21, Maneesh Jain 21, Kavita Mallya 21, Surinder K Batra 21, William R Jarnagin 13, Mary S Brady 1 22, Oystein Fodstad 23 24, Volkmar Muller 25, Klaus Pantel 26, Andy J Minn 27, Mina J Bissell 11, Benjamin A Garcia 28, Yibin Kang 29 30, Vinagolu K Rajasekhar 31, Cyrus M Ghajar 32, Irina Matei 1, Hector Peinado 1 33, Jacqueline Bromberg 34 35, David Lyden 1 14
Affiliations
- PMID: 26524530
- PMCID: PMC4788391
- DOI: 10.1038/nature15756
Tumour exosome integrins determine organotropic metastasis
Ayuko Hoshino et al. Nature. 2015.
Abstract
Ever since Stephen Paget's 1889 hypothesis, metastatic organotropism has remained one of cancer's greatest mysteries. Here we demonstrate that exosomes from mouse and human lung-, liver- and brain-tropic tumour cells fuse preferentially with resident cells at their predicted destination, namely lung fibroblasts and epithelial cells, liver Kupffer cells and brain endothelial cells. We show that tumour-derived exosomes uptaken by organ-specific cells prepare the pre-metastatic niche. Treatment with exosomes from lung-tropic models redirected the metastasis of bone-tropic tumour cells. Exosome proteomics revealed distinct integrin expression patterns, in which the exosomal integrins α6β4 and α6β1 were associated with lung metastasis, while exosomal integrin αvβ5 was linked to liver metastasis. Targeting the integrins α6β4 and αvβ5 decreased exosome uptake, as well as lung and liver metastasis, respectively. We demonstrate that exosome integrin uptake by resident cells activates Src phosphorylation and pro-inflammatory S100 gene expression. Finally, our clinical data indicate that exosomal integrins could be used to predict organ-specific metastasis.
Conflict of interest statement
The authors declare no competing financial interests.
Figures
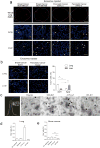
Extended Data Figure 1. Characterization of organotropic exosome properties and biodistribution
a, Human cancer exosome biodistribution in lung and liver. Exosomes (10 μg) derived from each cell line were labelled with lipophilic PKH26 dye (red) and injected retro-orbitally into nude mice 24 h before culling. Top, representative NIR whole-lung image by Odyssey imaging (n = 3). Middle and bottom, represent exosome biodistribution in the lung and liver as determined by immunofluorescence microscopy. Arrows indicate exosome foci (n = 3, three independent experiments). b, Biodistribution of exosomes isolated from mouse cell lines E0771 and Pan02. Mouse exosome biodistribution in the lung and liver was determined by immunofluorescence microscopy. Exosomes (10 μg) derived from each cell line were labelled with lipophilic PKH26 dye (red) and injected retro-orbitally into nude mice 24 h before culling. Top, lung at 40 × magnification. Bottom, liver at 40 × magnification. Arrows indicate exosome foci. Graph represents the quantification of exosome distribution by counting exosome-positive cells. An average of five random fields per sample were counted at 20 × magnification (three independent experiments, each with n = 3). ** P < 0.01 by two-tailed Student’s t-test. c, Analysis of organotropic cell-derived exosomes. MDA-MB-231 organotropic cell-line-derived exosomes were analysed for size distribution by NanoSight and phenotype (purity and shape) by electron microscopy; black arrows indicate representative exosomes. Technical triplicates were analysed, at least 10 images per sample. d, Flow cytometric analysis of exosome+ cells in lung. Exosomes (10 μg) derived from MDA-MB-231 organotropic cell lines were labelled with lipophilic PKH67 dye (green) and injected retro-orbitally into nude mice 24 h before culling. FITC-channel-positive cells were acquired on a FACS Calibur, and the percentage of exosome-positive cells was quantified (representing data pooled from two independent experiments, a total of n = 12). ***P < 0.001 by one-way ANOVA. e, Flow cytometric analysis of exosome-positive cells in the bone marrow. Exosomes (10 μm) derived from MDA-MB-231 organotropic cell lines were labelled with lipophilic PKH67 dye (green) and injected retro-orbitally into nude mice 24 h before culling. FITC-channel-positive cells were acquired on a FACS Calibur, and the percentage of exosome-positive cells was quantified (representative data pooled from two independent experiments, a total of n = 6). ** P < 0.01 and *P < 0.05 by one-way ANOVA for the 831-BrT to 1833-BoT and 4175-LuT comparisons, respectively. Data are mean ± s.e.m. Scale bars, 5 mm (a, top), 50 μm (a, middle and bottom, b) and 100 nm (c).
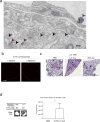
Extended Data Figure 2. 4175-LuT cell-derived exosomes localize to lung and dictate future metastatic sites
a, Electron microscopy imaging of FM1-43-labelled 4175-LuT exosomes. Red arrows, FM1-43-positive exogenous exosomes; black arrows, endogenous exosomes. Two mice were tested, images were taken for several sections from each organ (n = 30 images in total). b, Representative NIR imaging of lung whole mount after daily exosome injections. Exosomes (10 μg) derived from 4175-LuT cells were injected daily for three consecutive days via the retro-orbital sinus and the whole lung was imaged by Odyssey imaging (n = 4). c, Representative haematoxylin/eosin staining of the lung from Fig. 1f at 20 × magnification; n = 5 for all, except for LuT exo/LuT cells, in which n = 4; data representative of two independent experiments. Arrows indicate lung metastasis. d, Analysis of 1833-BoT cell metastasis to the lung, after 3 weeks of continuous treatment with PBS or 4175-LuT exosomes, followed by intracardiac injection of 1 × 10⁵ tumour cells. Mice were injected retro-orbitally with exosomes every other day for 3 weeks, before tumour cell injection. Quantitative bioluminescence imaging of luciferase activity by IVIS imaging. Metastasis was quantified 3 weeks after tumour cell injection (n = 4). Scale bars, 100 nm (a), 5 mm (b, d) and 500 μm (c). Data are mean ± s.e.m. *** P < 0.001 by two-tailed Student’s _t_-test.
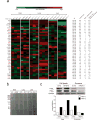
Extended Data Figure 3. Characterization of organotropic exosome protein cargo
a, Top 40 adhesion molecules packaged in exosomes isolated from organ tropic cell lines. Heat map of adhesion molecule signals based on _Z_-scored LFQ values obtained from quantitative mass spectrometry analysis. PEP (posterior error probability), MS/MS count is a number of fragmentation spectra (spectral counting), Razor + unique peptides refers to the number of peptides, and sequence coverage refers to percentage of peptide counts identified. b, Ponceau staining of exosome lysates isolated from organ tropic cell lines. Representative Ponceau staining of total protein from the organ tropic cell-line-derived exosomes. Exosomal protein (10 μg) was loaded in each well (n = 2, three independent experiments). c, Western blot analysis comparison of ITGα6 and ITGβ4 levels in cell lysates versus exosomes derived from organotropic breast cancer and pancreatic cancer cell lines. Graph represents the relative ratios of integrin to GAPDH signals as determined by densitometry. For western blot source data, see Supplementary Fig. 1i–k.
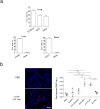
Extended Data Figure 4. Functional characterization of organotropic exosomes
a, Quantification of organotropic exosome uptake by target cells in vivo. Top graph, flow cytometric quantification of the frequency of 4175-LuT exosome-positive fibroblasts and epithelial cells (n = 4). Left bottom graph, flow cytometric quantification of the frequency of BxPC-3 exosome-positive macrophages (n = 3). Right bottom graph, quantification of the frequency of 831-BrT exosome-positive endothelial cells by immunofluorescence microscopy (n = 5). b, Organotropic cell-line-derived exosomes induce vascular leakiness in the lung. Leakiness in the lung 24 h after retro-orbital injection of 10 μg of normal mammary fat pad or MDA-MB-231 organotropic cell-line-derived exosomes was quantified by imaging the presence of fluorescent dextran (red) outside of blood vessels, in the lung parenchyma. Left top panel, 40 × magnification of representative lung image after PBS injection. Left bottom panel, representative lung image after 4175-LuT exosome injection. Scale bar, 50 μm. Right graph depicts the quantification of five random areas at 20 × magnification in arbitrary units (data representative of two independent experiments; n = 3). Data are mean ± s.e.m. * P < 0.05; ** P < 0.01 by one-way ANOVA.
Extended Data Figure 5. Exosome co-localization with specific cell types within target tissues
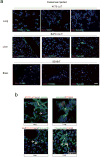
a, Immunofluorescence analysis of resident cells in lung, liver and brain after labelled exosome injection. Analysis of exosome (red) co-staining with markers (green) for tissue-specific stromal cell types. Top, representative images of immunofluorescence microscopy of 4175-LuT exosome co-staining with F4/80, CD31 and EpCAM. Middle, liver sections from mice injected with BxPC-3-LiT-derived exosomes were co-stained with CD31, S100A4 and EpCAM. Bottom, brain sections from mice injected with 831-BrT exosome were co-stained with F4/80, S100A4 and EpCAM (n = 3 per experiment for two independent experiments). b, Exosome biodistribution and co-localization with extracellular matrix proteins. Left top, representative immunofluorescence microscopy images of lung tissue, depicting 4175-LuT exosome (red) co-staining with laminin (green). Right top, laminin (green) co-staining with S100A4 (red). Left bottom, representative immunofluorescence microscopy of liver tissue co-stained for fibronectin (green) and BxPC-3-LiT exosomes (red). Right bottom, fibronectin (green) co-staining with F4/80 (red) (n = 3, two independent experiments). Scale bars, 30 μm.
Extended Data Figure 6. ITGs functionally regulate organotropic exosome uptake and exosome-mediated metastasis
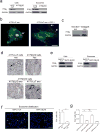
a, Representative western blot analysis of integrin expression in 4175-LuT and 4175β4KD cells and exosomes (representative of three independent experiments). For western blot source data, see Supplementary Fig. 1l. b, In vitro uptake of 4175-LuT exosomes by WI-38 lung fibroblasts. The WI-38 cell membrane was labelled with PKH67 green dye and 4175-LuT exosomes were labelled with PKH26 red dye. Exosomes (10 μg ml−1) were first incubated with PBS or HYD-1 peptide for 30 min at 37°C, followed by 1-h incubation with WI-38 cel ls at 37°C. Excess exosomes were washed and cells were imaged (n = 4 for two independent experiments). c, Representative western blot of ITGβ4 expression in exosomes isolated from wild-type or ITGβ4-overexpressing 1833-BoT cells (representative of two independent experiments). For western blot source data, see Supplementary Fig. 1m. d, Representative haematoxylin/eosin staining of lungs from Fig. 3e. Arrows indicate lung metastasis; n = 6, data representative of two independent experiments. e, Representative western blot analysis of integrin expression in BxPC-3-LiT and BxPC-3β5KD cells and exosomes. For western blot source data, see Supplementary Fig. 1n. f, Immunofluorescence analysis of BxPC-3-LiT control and BxPC-3β5KD-derived exosome biodistribution in the liver. Exosomes (10 μg) isolated from each cell line were labelled with lipophilic PKH26 dye (red) and injected retro-orbitally into nude mice 24 h before culling. Left, 40 × magnification. Arrows indicate exosome foci. Scale bar, 50 μm. Right, quantification of exosome distribution by exosome-positive cells. An average of five random fields were counted at 20 × magnification (data representative of two independent experiments; n = 3). g, Flow cytometry analysis of exosome-positive cells in the liver 24 h after exosome injection. Labelled BxPC-3-LiT exosomes (5 μg) per mouse were incubated with PBS, RGD, HYD-1 or ITGαvβ5 antibody for 30 min at 37°C before retro-orbital injection into nude mice. Livers were collected and analysed for exosome-positive cells by flow cytometry 24 h after injection (n = 4, except for the ITGαvβ5 antibody group, in which n = 5). Scale bars, 10 μm (b), 500 μm (d) and 500 μm (f). ** P < 0.01, *** P < 0.001 by two-tailed Students _t_-test (f) and one-way ANOVA (g). Data are mean ± s.e.m.
Extended Data Figure 7. Functional contribution of exosomes to metastasis
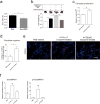
a, Microscopic analysis of exosome-positive cells in the livers of mice injected with liver metastatic Pan02-LiT-derived exosomes. Before injection, Pan02-LiT exosomes were pre-incubated with RGD peptide for 30 min at 37°C. Pan02-LiT exosomes (10 μg) were labelled with lipophilic PKH67 green dye and injected retro-orbitally into C57BL/6 mice 24 h before culling. Livers were digested and exosome-positive cells were quantified by flow cytometr y (n = 3). b, Analysis of Pan02-LiT liver metastasis after 3 weeks of continuous treatment with PBS, Pan02-LiT-derived exosomes, or Pan02-LiT-derived exosomes pre-incubated with RGD peptide for 30 min at 37°C. Pan02-LiT cells were injected intrasplenically. Mice were injected retro-orbitally with 5 μg exosome every other day for 3 weeks. Top, representative liver images showing metastasis taken at culling. Bottom, liver weight quantification (n = 4 except for the control and peptide group for which n = 3 of one experiment). c, Functional analysis of lung fibroblasts educated with 4175-LuT-derived exosomes. Proliferation of lung fibroblasts educated with exosomes every other day for 2 weeks. Three days after cells were plated at equal density, cell numbers were counted using a haemocytometer (n = 3; three independent experiments). d, Migration of lung fibroblasts educated with exosomes every other day for 2 weeks was measured as follows. Fibroblasts were plated in 24-well transwell chamber inserts, and after 6 h the number of cells that migrated was counted using haematoxylin staining. Nine random fields were counted at 20 × magnification and the average number of cells per field was calculated (total of n = 4 from two independent experiments). e, Representative image of the lung stained for S100A4. Mice were treated every other day with PBS, 4175-LuT or 4175β4KD exosomes for 3 weeks. Scale bar, 50 μm; n = 4 mice. f, In situ (in-cell western) protein expression analysis of WI-38 fibroblasts treated with PBS, 4175-LuT or 4175ITGβ4KD exosomes. Relative expression levels of Src and phosphorylated (p-) Src (n = 3, three independent experiments). Data are mean ± s.e.m. * P < 0.05; ** P < 0.01; *** P < 0.001 by two-tailed Student’s _t_-test (a, c, d) and one-way ANOVA (b, f).
Extended Data Figure 8. Exosomal integrin expression as a potential metastatic site biomarker
a, Exosomal ITGβ4 levels in the plasma of mice bearing orthotopic 4175-LuT tumours, as a function of tumour progression. Blood plasma was collected for exosome isolation 6 weeks after intra-mammary fat pad tumour injection, then again 1 week after tumour resection, from mice that were deemed to be either free of tumour or presenting with recurring tumours based on IVIS bioluminescence imaging (n = 5 were pooled for each group, based on one experiment). For western blot source data, see Supplementary Fig. 1o. b, Exosomal ITGβ4 in healthy control subjects (Ctrl) (n = 13); patients with breast cancer (BrCa) and no metastasis (n = 3), liver metastasis (n = 1), or lung metastasis (n = 3); patients with rhabdomyosarcoma (RMS) and no metastasis (n = 1) or lung metastasis (n = 3); patients with pancreatic cancer (PDAC) with liver metastasis (n = 14) and lung metastasis (n = 3); and patients with melanoma (Mel) with lung metastasis (n = 2). c, Exosomal ITGαV in healthy control subjects (n = 13); patients with rhabdomyosarcoma and no metastasis (n = 1) or lung metastasis (n = 3); patients with breast cancer and lung metastasis (n = 3) or liver metastasis (n = 1); and patients with pancreatic cancer and liver metastasis (n = 15). Data are mean ± s.e.m. * P < 0.05; *** P < 0.001 by one-way ANOVA.
Figure 1. Cancer-cell-derived exosomes localize to and dictate future metastatic organs
a, Biodistribution of human cancer-cell-line-derived exosomes in the lung and liver of naive mice. Quantification of exosome-positive (Exo+) areas by NIR imaging of whole lung, in arbitrary units (a.u.) (n = 3 per group). b, Immunofluorescence quantification of exosome-positive cells (n = 3, three independent experiments). c, MDA-MB-231- (parental), 1833-BoT-, 4175-LuT- and 831-BrT-derived exosome biodistribution. Quantification of exosome-positive areas by NIR imaging of whole lung (n = 3 for all, except 831-BrT, in which n = 4). d, Immunofluorescence quantification of exosome-positive cells (n = 5 animals pooled from two independent experiments). e, Top, NIR whole-lung imaging of MDA-MB-231 sublines. BoT, bone-tropic; BrT, brain-tropic; LuT, lung-tropic. Bottom, fluorescence microscopy of lung, liver and brain injected with MDA-MB-231 subline-derived exosomes. Arrows indicate exosome foci. All NIR and immunofluorescence images are representative of five random fields. f, Redirection of metastasis by education with organotropic exosomes. 4175-LuT or 1833-BoT cell metastasis in the lung after treatment with PBS, 4175-LuT or 1833-BoT exosomes. Top, quantitative bioluminescence of metastatic lesions. Bottom, graphs show quantification of luciferase activity (n = 5 for all, except for LuT exo/LuT cells, in which n = 4; data representative of two independent experiments). g, Lung haematoxylin/eosin staining for f. Arrows indicate lung metastasis. Scale bars, 5 mm (e, top, f), 50 μm (e, bottom) and 500 μm (g). Data are mean ± s.e.m. NS, not significant; * P < 0.05; ** P < 0.01; *** P < 0.001 by one-way analysis of variance (ANOVA).
Figure 2. Organ-specific tumour exosomes interact with resident cells
a, Heat map of integrin signals from quantitative mass spectrometry analysis, based on _Z_-scored label-free quantification (LFQ) values (technical triplicates). b, Western blot analysis of integrins from organotropic cell-line-derived exosomes, representative of three independent experiments. For western blot source data, see Supplementary Fig. 1a–h. c, Analysis by immunofluorescence of exosome distribution (red) and different resident cell types (green). Left to right: lung co-staining with 4175-LuT exosomes and S100A4 (fibroblasts) or SPC (epithelial cells), liver co-staining with F4/80 (macrophages) and BxPC-3-LiT exosomes, and brain co-staining with CD31 (endothelial cells) and 831-BrT exosomes. Scale bar, 30 μm. Immunofluorescence images are representative of five exosome-positive cells e ach, f rom n = 5 mice.
Figure 3. Exosomal ITGβ4 expression functionally contributes to 4175-LuT exosome localization and mediates lung metastasis
a, Top, NIR whole-lung imaging of 4175-LuT- or 4175β4KD-derived exosomes, or 4175-LuT-derived exosomes pre-incubated with RGD or HYD-1 peptides. Bottom, fluorescence microscopy. Arrowheads indicate exosome foci. b, Quantification of exosome-positive areas from the whole-lung images in a (top) (n = 4, except 4175, in which n = 6). c, Immunofluorescence quantification of exosome-positive cells from a (bottom) (n = 6 pooled from two independent experiments). d, Left, NIR whole-lung imaging of 1833-BoT (n = 5) or 1833-BoT overexpressing ITGβ4 (1833β4OE) (n = 4) exosomes. Right, quantification of the exosome-positive areas. e, Experimental lung metastasis of 4175β4KD cells after education with wild-type or 4175β4KD exosomes. Bioluminescence imaging of lung metastasis and quantification of luciferase activity (n = 6, data representative of two independent experiments). f, Heat map of S100 gene expression fold change by quantitative reverse transcription PCR (qRT–PCR) in 4175-LuT or 4175β4KD exosome-conditioned lung fibroblast (WI-38) or epithelial (HBEpC) cells, and liver-tropic BxPC-3 or BxPC-3β5KD exosome-conditioned Kupffer cells. Red represents high and green represents low expression (n = 3 in two independent experiments). Scale bars, 5 mm (a, top, d, e) and 50 μm (b, bottom). Data are mean ± s.e.m. * P < 0.05; ** P < 0.01; *** P < 0.001 by one-way ANOVA (b, c, e); *** P < 0.001 by two-tailed Student’s _t_-test (d).
Figure 4. Exosomal integrin expression as a potential predictor of patient organ-specific metastasis
a, Exosomal ITGβ4 levels in breast cancer patients who were metastasis-free at the time of blood draw. Amount of ITGβ4 per microgram of exosome in healthy control (Ctrl) subjects (n = 6); patients with ductal carcinoma in situ (DCIS) (n = 7), invasive breast cancer without relapse within three years (NED, no evidence of disease) (n = 8), locoregional recurrence (LR) within three years (n = 2), bone metastasis within three years (n = 3), or lung metastasis within three years (n = 2). POD, progression of disease. b, Exosomal ITGαv in pancreatic cancer patients who were metastasis-free at the time of blood draw. Amount of ITGαv per microgram of exosome in healthy control subjects (n = 13); patients with pancreatic cancer without relapse within three years (n = 14), or liver metastasis within three years (n = 13). c, Model of exosome-mediated organotropic tumour dissemination. Tumour-derived exosomes are uptaken by organ-specific resident cells in future metastatic organs based on integrin expression. Data are mean ± s.e.m. * P < 0.05; ** P < 0.01 by one-way ANOVA.
Comment in
- Cancer: Organ-seeking vesicles.
Rak J. Rak J. Nature. 2015 Nov 19;527(7578):312-4. doi: 10.1038/nature15642. Epub 2015 Oct 28. Nature. 2015. PMID: 26524529 No abstract available. - Metastasis: Directions to metastatic sites.
Alderton GK. Alderton GK. Nat Rev Cancer. 2015 Dec;15(12):696-7. doi: 10.1038/nrc4046. Epub 2015 Nov 13. Nat Rev Cancer. 2015. PMID: 26563464 No abstract available. - Organotropic metastasis: role of tumor exosomes.
Liu Y, Cao X. Liu Y, et al. Cell Res. 2016 Feb;26(2):149-50. doi: 10.1038/cr.2015.153. Epub 2015 Dec 25. Cell Res. 2016. PMID: 26704450 Free PMC article. - Breast Cancer Exosomes Breach the Blood-Brain Barrier.
Choy C, Jandial R. Choy C, et al. Neurosurgery. 2016 Jun;78(6):N10-1. doi: 10.1227/NEU.0000000000001242. Neurosurgery. 2016. PMID: 27191805 No abstract available.
Similar articles
- Organotropic metastasis: role of tumor exosomes.
Liu Y, Cao X. Liu Y, et al. Cell Res. 2016 Feb;26(2):149-50. doi: 10.1038/cr.2015.153. Epub 2015 Dec 25. Cell Res. 2016. PMID: 26704450 Free PMC article. - The Association of Integrins β3, β4, and αVβ5 on Exosomes, CTCs and Tumor Cells with Localization of Distant Metastasis in Breast Cancer Patients.
Grigoryeva ES, Tashireva LA, Savelieva OE, Zavyalova MV, Popova NO, Kuznetsov GA, Andryuhova ES, Perelmuter VM. Grigoryeva ES, et al. Int J Mol Sci. 2023 Feb 2;24(3):2929. doi: 10.3390/ijms24032929. Int J Mol Sci. 2023. PMID: 36769251 Free PMC article. - Metastasis: Directions to metastatic sites.
Alderton GK. Alderton GK. Nat Rev Cancer. 2015 Dec;15(12):696-7. doi: 10.1038/nrc4046. Epub 2015 Nov 13. Nat Rev Cancer. 2015. PMID: 26563464 No abstract available. - Exosome-Mediated Metastasis: Communication from a Distance.
Wortzel I, Dror S, Kenific CM, Lyden D. Wortzel I, et al. Dev Cell. 2019 May 6;49(3):347-360. doi: 10.1016/j.devcel.2019.04.011. Dev Cell. 2019. PMID: 31063754 Review. - Do tumor exosome integrins alone determine organotropic metastasis?
Grigoryeva ES, Savelieva OE, Popova NO, Cherdyntseva NV, Perelmuter VM. Grigoryeva ES, et al. Mol Biol Rep. 2020 Oct;47(10):8145-8157. doi: 10.1007/s11033-020-05826-4. Epub 2020 Sep 14. Mol Biol Rep. 2020. PMID: 32929649 Review.
Cited by
- New insights into non-small cell lung cancer bone metastasis: mechanisms and therapies.
Xue M, Ma L, Zhang P, Yang H, Wang Z. Xue M, et al. Int J Biol Sci. 2024 Oct 21;20(14):5747-5763. doi: 10.7150/ijbs.100960. eCollection 2024. Int J Biol Sci. 2024. PMID: 39494330 Free PMC article. Review. - Platelet-derived extracellular vesicles inhibit ferroptosis and promote distant metastasis of nasopharyngeal carcinoma by upregulating ITGB3.
Li F, Xu T, Chen P, Sun R, Li C, Zhao X, Ou J, Li J, Liu T, Zeng M, Zheng W, Lin Y, Yang L, Li Z, Chen H, Zhang Q. Li F, et al. Int J Biol Sci. 2022 Sep 24;18(15):5858-5872. doi: 10.7150/ijbs.76162. eCollection 2022. Int J Biol Sci. 2022. PMID: 36263165 Free PMC article. - Exosomes: key players in cancer and potential therapeutic strategy.
Dai J, Su Y, Zhong S, Cong L, Liu B, Yang J, Tao Y, He Z, Chen C, Jiang Y. Dai J, et al. Signal Transduct Target Ther. 2020 Aug 5;5(1):145. doi: 10.1038/s41392-020-00261-0. Signal Transduct Target Ther. 2020. PMID: 32759948 Free PMC article. Review. - Solanine Attenuates Hepatocarcinoma Migration and Invasion Induced by Acetylcholine.
Lin LT, Choong CY, Tai CJ. Lin LT, et al. Integr Cancer Ther. 2020 Jan-Dec;19:1534735420909895. doi: 10.1177/1534735420909895. Integr Cancer Ther. 2020. PMID: 32975458 Free PMC article. - Perivascular cell-derived extracellular vesicles stimulate colorectal cancer revascularization after withdrawal of antiangiogenic drugs.
Huang M, Chen M, Qi M, Ye G, Pan J, Shi C, Yang Y, Zhao L, Mo X, Zhang Y, Li Y, Zhong J, Lu W, Li X, Zhang J, Lin J, Luo L, Liu T, Tang PM, Hong A, Cao Y, Ye W, Zhang D. Huang M, et al. J Extracell Vesicles. 2021 May;10(7):e12096. doi: 10.1002/jev2.12096. Epub 2021 May 21. J Extracell Vesicles. 2021. PMID: 34035882 Free PMC article.
References
- Paget S. The distribution of secondary growths in cancer of the breast. Cancer Metastasis Rev. 1989;8:98–101. 1889. - PubMed
- Hart IR, Fidler IJ. Role of organ selectivity in the determination of metastatic patterns of B16 melanoma. Cancer Res. 1980;40:2281–2287. - PubMed
- Müller A, et al. Involvement of chemokine receptors in breast cancer metastasis. Nature. 2001;410:50–56. - PubMed
Publication types
MeSH terms
Substances
Grants and funding
- R01-CA169416/CA/NCI NIH HHS/United States
- U01-CA169538/CA/NCI NIH HHS/United States
- P30 CA008748/CA/NCI NIH HHS/United States
- U01 CA169538/CA/NCI NIH HHS/United States
- R01 CA169416/CA/NCI NIH HHS/United States
- R50 CA211462/CA/NCI NIH HHS/United States
LinkOut - more resources
Full Text Sources
Other Literature Sources
Molecular Biology Databases
Miscellaneous
